Research Online
Research Online
Theses : Honours Theses
2015
Eye movement patterns as an indicator of task automaticity
Eye movement patterns as an indicator of task automaticity
Olga Clarke
Edith Cowan University
Follow this and additional works at: https://ro.ecu.edu.au/theses_hons
Part of the Psychology Commons Recommended Citation
Recommended Citation
Clarke, O. (2015). Eye movement patterns as an indicator of task automaticity. https://ro.ecu.edu.au/ theses_hons/1473
This Thesis is posted at Research Online. https://ro.ecu.edu.au/theses_hons/1473
Edith Cowan
University
Copyright
Warning
You may print or download ONE copy of this document for the
purpose of your own research or study.
The University does not authorise you to copy, communicate
or otherwise make available electronically to any other
person any copyright material contained on this site.
You are reminded of the following:
•
Copyright owners are entitled to take legal action against
persons who infringe their copyright.
•
A reproduction of material that is protected by copyright may be
a copyright infringement.
•
A court may impose penalties and award damages in relation
to offences and infringements relating to copyright material.
Higher penalties may apply, and higher damages may be
awarded, for offences and infringements involving the
conversion of material into digital or electronic form
.Use of Thesis
This copy is the property of Edith Cowan University. However the literary rights of the author must also be respected. If any passage from this thesis is quoted or closely paraphrased in a paper or written work prepared by the user, the source of the passage must be
acknowledged in the work. If the user desires to publish a paper or written work containing passages copied or closely paraphrased from this thesis, which passages would in total constitute and infringing copy for the purpose of the Copyright Act, he or she must first obtain the written permission of the author to do so.
Signed:
Olga Clarke
Dated: 25 October 2015Eye Movement Patterns as an Indicator of Task Automaticity Olga Clarke
A Report Submitted in Partial Fulfilment of the Requirements for the Award of Bachelor of Science Honours, Faculty of Health, Engineering and Science, Edith Cowan University.
Submitted October, 2015
I declare that this written assignment is my own work and does not include:
(i) Material from published sources used without proper acknowledgement; or (ii) Material copied from the work of other students
Signature:
Olga Clarke
Date: 25 October 2015Eye Movement Patterns as an Indicator of Task Automaticity Abstract
Automaticity is a vital aspect of daily living, as it allows for tasks to be completed quickly and with the fraction of the cognitive load required for tasks that cannot be completed automatically. Task automaticity is commonly measured with reaction time, which is considered to be an indirect measure of behaviour. As more direct measures are becoming available, there is an opportunity to assess task automaticity in greater detail. The purpose of the current study was to determine whether eye movements change as participants reach task automaticity. The study involved 16 participants who were asked to complete the dot
counting task while their eye movements were recorded. Each participant was presented with a stimulus that featured between 6 and 11 dots. Participants were required to indicate the number of dots presented on the screen by pressing a response pad as quickly as possible. The group results showed that the number of fixations and the overall fixation duration decreased as task proficiency increased. It was also found that a greater proportion of fixations was located in the centre of the stimulus as the task progressed. No changes were found in the mean fixation duration. An individual analysis highlighted performance
differences between participants that could be due to factors such as strategy choice. The use of eye tracking and the evaluation of individual as well as group results provided richer insight into task automaticity and will assist in expanding the knowledge of this cognitive phenomenon. Having the ability to track task automaticity with eye tracking could also assist in school settings in situations where there is a need to determine skill proficiency.
Author: Olga Clarke
Supervisor: Professor Craig Speelman
COPYRIGHT AND ACCESS DECLARATION
I certify that this thesis does not, to the best of my knowledge and belief:
(i) incorporate without acknowledgement any material previously submitted for a degree or diploma in any institution of higher education;
(ii) contain any material previously published or written by another person except where due reference is made in the text; or
(iii) contain any defamatory material.
Signed:
Olga Clarke
Dated: 25 October 2015Acknowledgements
I would like to sincerely thank my supervisor, Professor Craig Speelman for his support, advice, patience and guidance throughout the process. I would like to acknowledge the proposal reviewers, Dr Guillermo Campitelli and Mr Shane Rogers, for their suggestions to make the research better. I would like to thank the participants who volunteered their time and contributed to my research project. Last of all, I would like to thank my family and friends for your endless support. You provided the encouragement when it was needed the most.
Table of Contents
List of Tables ... viii
List of Figures ... ix
List of Appendices ... x
Eye Movement Patterns as an Indicator of Task Automaticity ... 1
Task Completion and Automaticity ... 1
Instance Theory of Automaticity... 2
How Is Automaticity Measured? ... 3
Validity of the Instance Theory ... 4
Automaticity and Individual Differences ... 5
Eye Movements and Cognition ... 7
Eye Movement Research ... 8
Eye Movements and Automaticity in the Dot Counting Task ... 10
The Present Study ... 11
Method ... 12 Participants ... 12 Materials ... 12 Procedure ... 14 Results ... 16 Data Analysis ... 16 Findings ... 20 Discussion... 30 Individual Analysis ... 33 Implications ... 36
Limitations and Future Research ... 37
List of Tables
Table 1: Number of Dots in the Analysis Regions of Each Stimulus ... 19 Table 2: Slope and R² Values for Participant Mean Reaction Times per Numerosity for
Early, Middle and Late Phases of the Task... 21 Table 3: Participant Slope and R² Values for Fixation Proportions per Area of Interest
and Mean Fixation Durations as a Function of Block Segment (Where Each Block Segment is Two Experimental Blocks) ... 29
List of Figures
Figure 1: Defined areasof interest during stimulus presentation ... 18 Figure 2: Mean RT as a function of numerosity in the early, middle and late phases of
the task ... 22 Figure 3: Mean RT as a function of numerosity in the early, middle and late phases for
participant 1, who met the criteria for automaticity ... 22 Figure 4: Mean RT as a function of numerosity in the early, middle and late phases for
participant 16. The participant was considered to be completing the task automatically due to a stable slope that was under 100 ms in each phase of the task ... 23 Figure 5: RT as a function of numerosity in the early, middle and late phases for
participant 11, who met the criteria of task automaticity. The slope value was smallest in the middle phase, but was under 100 ms in both the middle and late phases of the task ... 24 Figure 6: Mean RT as a function of numerosity in the early, middle and late phases for
participant 5, who did not meet the criteria for automaticity ... 25 Figure 7: Mean fixation number (and linear regression) as a function of block segment
List of Appendices
Appendix A: Recruitment of Participants... 52
Appendix B: Practice Stimuli Used in the Dot Counting Task ... 53
Appendix C: Stimuli Used in the Dot Counting Task ... 55
Appendix D: Dot Counting Task Instructions ... 57
Appendix E: Information Letter to Participants ... 59
Appendix F: Participant Consent Form ... 61
Eye Movement Patterns as an Indicator of Task Automaticity
Automaticity is an important factor in task completion (Logan, 1988). Task automaticity reduces the time it takes to complete a task and therefore allows for limited cognitive resources to be allocated elsewhere (Haapalainen, Kim, Forlizzi, & Dey, 2010). Extensive research has been conducted on task automaticity, but most of this research has focused on mean group findings. Given the complexity of human behaviour, individual differences must be taken into consideration in order to get the most comprehensive
understanding of cognitive phenomena such as automaticity (Speelman & McGann, 2013). As more direct measures of behaviour are becoming accessible, there is an opportunity to verify what is currently known about automaticity and also extend the knowledge by
assessing any individual differences in the development of task automaticity (Haapalainen et al., 2010). Eye tracking is one such measure and is the focus of this thesis.
Task Completion and Automaticity
How much cognitive capacity is required to complete a task depends on factors such as task difficulty and whether the task has been completed previously (Haapalainen et al., 2010). Tasks that take more effort to complete usually demand more cognitive resources. In some instances, there may be more than one way to complete a task and if the task is new to an individual, there may be uncertainty about how the task should be completed (Bourne, Raymond, & Healy, 2010). An individual may even attempt several strategies prior to determining which one will be the most effective. In this initial period, task completion is conscious and effortful, therefore creating a heavy demand on cognitive resources (Godfroid & Uggen, 2013; Logan, 1988; Pincham & Szücs, 2012). As cognitive resources are limited, this means that there may be insufficient resources left to complete other tasks at the same time (Haapalainen et al., 2010).
With practice, relevant skills can be acquired which allow for task completion to become more proficient (Ashby & Crossley, 2012; Frank, Touron, & Hertzog, 2013). A common way to determine whether a person has reached proficiency with a task is to determine whether task completion is automatic (Logan, 1988; Naparstek & Henik, 2010). When task completion is automatic, the time and the effort taken to complete the task is substantially less than when the task is not processed automatically (Logan, 1988; Logan, 1997). Consequently, automatic tasks do not place the same demand on cognitive resources, therefore allowing for the resources to be allocated to other tasks (Aarts & Dijksterhuis, 2000; Haapalainen et al., 2010; Logan, 1990). Given that the environments in which we live are rich in information, daily life would be impossible without task automaticity (Okon-Singer, Tzelgov, & Henik, 2007). Cognitive resources would be at capacity and the ability to perform tasks simultaneously would be limited. As such, task automaticity is a vital aspect of daily life that allows individuals to achieve optimal task performance (Hélie, Waldschmidt, & Ashby, 2010; Logan, 1988; Touron & Hertzog, 2004).
Instance Theory of Automaticity
Logan’s Instance Theory of Automaticity provides an explanation regarding how tasks may become automatic (Logan, 1988). The Instance Theory states that new tasks are initially completed through the application of what is known as a general algorithm. The algorithm is unique to a specific task and provides a solution in order for that task to be completed (Wilkins & Rawson, 2011). For example, a general algorithm solution to solve a multiplication problem (e.g., 5 x 7 = ?) could involve using an addition algorithm (i.e., adding five lots of seven together) in order to compute the answer. However every time the task is completed, a unique memory trace about how the task was completed, called an instance, is also stored. The instance allows for a solution to be retrieved from memory (i.e.,
remembering the generated solution from a previous calculation episode) rather than relying on algorithm rules to generate a solution.
In the Instance Theory, as instances become available in memory, recall of instances and application of the general algorithm race one another every time the same task is
encountered. According to Logan (1988), the more instances that are available, the more likely it is that the instance (and not the general algorithm) will win the race and therefore provide the solution to the task. The Instance Theory suggests that a task becomes automatic once general algorithm solutions are made redundant and instances are consistently relied upon to provide a solution for the specific task (Logan, 1988; Logan, 1992; Palmeri, 1997; Wilkins & Rawson, 2011). The time taken to transition to automaticity can be different for every individual and every task.
The Instance Theory is based on three assumptions (Logan, 1988). The first is that attention toward a stimulus will result in compulsory encoding into memory (Colonius, 1995; Logan, 1988; Logan, 1990; Logan, 1992). The second is that any prior information regarding stimuli will be retrieved when the attention is directed to the same stimuli in the future. Last of all, each encounter with a stimulus is considered to be separate and will be represented separately in memory. The efficiency of the encoding and retrieval is considered to be associated with the attention provided to the stimuli (Logan, Taylor, & Etherton, 1996; Logan, Taylor, & Etherton, 1999). Which stimuli are attended to and the quality of that attention will ultimately determine how a skill is acquired (Haider & Frensch, 1999; Okon-Singer et al., 2007).
How Is Automaticity Measured?
According to the Instance Theory, automaticity is reflected in the reduction of mean reaction time (RT) as a function of the power law of practice (Colonius, 1995; Hélie et al.,
2010; Logan, 1988; Palmeri, 1997; Touron, Hertzog, & Frank, 2011). It is expected that the largest changes in RT will occur in the initial stages of practice (Logan, 1992; Logan, 1997). The reduction in RT is expected to coincide with an increased retrieval of responses from memory, as retrieval is expected to generate a solution quicker than the general algorithm solution (Touron et al., 2011). Other factors have also been used as an indicator of
automaticity (Hélie et al., 2010). Another common measure is the ability of an individual to complete another task at the same time (Ashby & Crossley, 2012; Hélie et al., 2010; Logan et al., 1996). It is expected that as the task becomes automatic, there will be less interference in the completion of another task.
Validity of the Instance Theory
The Instance Theory was initially tested using the lexical decision task and the alphabet arithmetic task (Logan, 1988). In the lexical decision task, participants were provided with a string of four letters. The task was to determine as quickly as possible whether the letters represented an English word. In the alphabet arithmetic task, participants were presented with equations (for example, A + 2 = C) and had to verify whether they were correct (i.e., whether C occurs 2 letters onwards from A in the alphabet). Experiments with both tasks indicated a reduction in RT as a power law of practice. However it was found that this reduction in RT was only transferable to stimuli that were very similar in nature to the practiced stimuli.
Two separate studies investigated how well the Instance Theory could explain
changes in performance when participants practiced a dot counting task (Lassaline & Logan, 1993; Logan, 1992). Participants were presented with visual patterns of distinct elements (between six and 11 dots) and asked to determine how many elements were presented overall. Counting requires serial spatial indexing, which is where an individual uses an internal
representation of a number sequence to correspond to each visual object. The more items there are to process, the longer the counting takes. As the Instance Theory predicts that a counting algorithm would be used, it was expected that the more elements the participants had to process, the longer it would take for a response to be generated. It was expected that each additional element would increase RT by approximately 300 ms (Lassaline & Logan, 1993).
The Instance Theory also predicts that after a period of practice on the task, responses would be generated via memory retrieval. As a result, serial spatial indexing would no longer be required and so RT would no longer be affected by element numerosity. That is, the RT would not be a function of the number of dots presented in the stimulus. The results of both studies were consistent with these assumptions (Lassaline & Logan, 1993; Logan, 1992). As participants practiced the task, and the same patterns were repeated many times, differences in processing time across the different numerosities decreased. The reduction in RT indicated that task automaticity had been reached. This result supported the notion that as performance becomes automatic, participants recognised the visual patterns and their responses were generated via memory retrieval as opposed to the general counting algorithm.
Results of subsequent studies have consistently supported the notion that automaticity develops as instances for a particular task become available (Palmeri, 1997; Wilkins &
Rawson, 2011). A dot counting task was used in the study conducted by Palmeri (1997) and it was found that RT was significantly higher for larger numerosities at the beginning of the study, indicating that participants were counting the presented dots. However RT decreased significantly over the task period, indicating that the solution was being retrieved from memory and that task completion was becoming automatic.
When conducting cognitive research, it is important for consideration to be given to any individual differences in task performance (Balota & Yap, 2011). Measuring cognitive behaviour by group means alone can be misleading as there may be aspects of an individual’s performance that are only evident when individual differences are considered (Balota & Yap, 2011; Speelman & McGann, 2013; Touron, 2006). Human behaviour is complex and any data deviations from the ‘norm’ may provide us with insight into the phenomena being studied (Speelman & McGann, 2013). Therefore in order to gain the best possible
understanding of performance in cognitive research, it is crucial to consider mean data results in conjunction with any identified individual differences (Balota & Yap, 2011).
The most effective way to understand group and individual performance during task automaticity is to use the most effective measures of the cognitive processes involved in the particular phenomena. Changes in RT during task completion provides an indication of when task processing is becoming automatic (Speelman & McGann, 2013). However RT is an indirect measure of the underlying mental processes involved in task automaticity. For instance, it is accepted that when task processing becomes automatic, there is a reduction in cognitive load and therefore the time taken to complete the task reduces. However RT can be affected by cognitive processes other than automaticity, meaning that RT data may reflect other cognitive factors also.
As more direct behavioural measures of mental processes are becoming available, there is an opportunity for a more in-depth investigation into cognitive phenomena such as skill acquisition and automaticity (Haapalainen et al., 2010). One such measure is eye tracking, which has been identified as a direct and objective reflection of the mental
processes being used to perform a task (Hunt, Clark-Carter, & Sheffield, 2015). For instance, it has been found that eye position is a strong indicator of where an individual has allocated their attention (Henderson & Smith, 2009; Nikolaev, Nakatani, Plomp, Jurica, & van
Leeuwen, 2011). Eye position can also determine what information from an individual’s visual display is encoded into memory (Skotte, Nøjgaard, Jørgensen, Christensen, &
Sjøgaard, 2007). Eye tracking is considered to be an objective measure which is effective for group analysis as well as identifying any individual differences that may exist during task performance (Riby & Doherty, 2009).
Eye Movements and Cognition
Eye tracking can provide information about a variety of psychological processes, including problem solving, reasoning, memory and attention (Huestegge & Koch, 2012; Mele & Federici, 2012; Olk, 2013; Ryan, Hannula, & Cohen, 2007). Eye tracking is unobtrusive (Hartmann, 2015; Riby & Doherty, 2009; Seligman & Giovannetti, 2015) and can be used as an additional measure when investigating cognitive phenomena. Having this additional measure provides researchers with an ability to conduct a more in-depth analysis of the psychological processes and therefore better understand cognitive involvement in task completion (Mele & Federici, 2012; Seligman & Giovannetti, 2015).
Eye movement, attention and memory. As eye tracking measures become more
sophisticated, they are becoming an increasingly popular method for studying human
attention (Risko, Anderson, Lanthier, & Kingstone, 2012; Stickler & Shi, 2015). For instance, the study of eye fixations, which can be defined as a state in which the eyes hold a gaze in a particular location, can provide objective information about what an individual attends to (Andrá et al., 2015; Bulling, Roggen, & Tröster, 2011; Glaholt, Rayner, & Reingold, 2013; Huestegge & Koch, 2012; Rosch, & Vogel-Walcutt, 2013; Steichen, Conati, & Carenini, 2014; Stickler & Shi, 2015). Subsequently, the attention given to a particular stimulus can be an indicator of the likelihood that features of that stimulus will be encoded into memory (Nikolaev et al., 2011). Fixations can also measure an individual’s cognitive load capacity
during task completion (Haapalainen et al., 2010; Rosch, & Vogel-Walcutt, 2013; Seligman & Giovannetti, 2015).
The location and the duration of eye fixations can identify how attention has been allocated to a task and consequently the role that attention has played in other cognitive processes such as memory (Lisi, Cavanagh, & Zorzi, 2015; Mall, Morey, Wolff, & Lehnert, 2014; Olk, 2013; Piras, Lobietti, & Squatrito, 2010). For instance, several studies have found that eye fixation is a reflection of where attention is being targeted when a solution for a task is being identified (Blythe, 2014; Olk, 2013). As attention is linked to visual encoding, it subsequently determines what information is available for use in short term memory (Bundesen, Habekost, & Kyllingsbӕk, 2005).
Eye tracking measures may also provide insight into the strategies an individual is using in order to complete a task (Hartmann, 2015). For instance, fixations have been found to identify areas of stimuli that individuals feel to be important (Rayner, 2009). However the significance of particular features of stimuli can be different depending on the goal of the task. For instance, in visual search, the goal may be to fixate on as many features of a
stimulus as quickly as possible (Mele & Federici, 2012). However in a problem-solving task, individuals may be more selective about where attention is allocated in order to ensure that limited cognitive resources are utilised for the completion of the task (Huestegge & Koch, 2012).
Eye Movement Research
Eye tracking measures have been used since the 1800s and have provided insight into cognitive processes across a variety of scientific research fields (Mele & Federici, 2012; Seligman & Giovannetti, 2015). Studies have been conducted to identify how eye movements change during tasks such as reading, visual search, driving and problem solving (Bulling et
al., 2011; Haapalainen et al., 2010; Jarodzka, Scheiter, Gerjets, & van Gog, 2010; Mele & Federici, 2012, Merkley & Ansari, 2010; Rayner, 2009). For instance, a study conducted by Desroches, Joanisse and Robertson (2006) found that eye tracking measures allowed for a more direct measure of phonological ability in dyslexic people than alternative measures such as RT. Consequently, new features of dyslexia were discovered that would not be identifiable using the traditional measures.
Although relatively rare, the use of eye tracking in numerical cognition has been found to be a useful method for developing new knowledge relating to numerical cognition (Hartmann, 2015; Moeller, Klein, & Nuerk, 2011). In particular, eye tracking has been used to identify the cognitive processes that are used when numerical information is being processed. For instance, in a study conducted by Merkley and Ansari (2010), participants were simultaneously presented with two pairs of single Arabic digits. Participants were required to divide the smallest number by the largest number in each pair and then determine which combination of numbers produced the largest ratio. The purpose of the study was to identify whether ratio size would affect eye movements. It was found that there were significantly more fixations and that fixation durations were longer for the digit pair that produced the larger ratio. It was suggested that eye tracking results provide a more in-depth analysis of cognitive processes than measures such as RT and could therefore enrich existing theories of numerical cognition.
Another study was conducted by Li, Logan and Zbrodoff (2010) in order to determine the role of eye movements in enumeration. Participants were presented with dot patterns for different levels of numerosity and were asked to either count the dots or to look at the dots. The findings of the study were that the time taken to enumerate increased as more items are added to the pattern. It was found the RT increased with numerosity in both task conditions, with each additional item adding approximately 354 ms to the overall RT in the counting
condition and 360 ms in the looking condition. There was also an increase in fixations as a function of numerosity, with an increase of 1.03 fixations per dot in the counting condition and 1.14 fixations per dot in the looking condition. It was suggested that eye movements are strongly associated with the cognitive processes involved in counting.
Eye Movements and Automaticity in the Dot Counting Task
Attention and memory are both important cognitive processes in the dot counting task (Baroody, Bajwa, & Eiland, 2009). Sufficient attention needs to be allocated to stimuli for a solution to be generated and memorising the correct solutions leads to better task
performance. At the initial stages of the dot counting task, producing a correct response is a deliberate and conscious process. If participants transition to solution retrieval, task
processing becomes automatic and the cognitive load to complete the task is reduced. Although RT can identify reductions in processing time when a participant transitions to solution retrieval, RT alone cannot provide a direct indication of any changes in cognitive processes (Merkley & Ansari, 2010).
In contrast, there is strong evidence that eye movements are directly linked to visual perception, attention and memory recall (Blythe, 2014; Bulling et al., 2011; Huestegge & Koch, 2012). Therefore, the two measures used concurrently may provide a better indication of cognitive processing during task completion. This notion is supported by a study
conducted by Hunt et al. (2015), which found that eye fixations and RT are related. It was found that eye fixation measures can be used to provide information about the cognitive processes involved in the reduction of RT during task completion. There has also been support for using eye tracking to determine how individuals process numerical information (Li et al., 2010; Sullivan, Juhasz, Slattery, & Barth, 2011). It has therefore been suggested
that eye movement measurements in conjunction with RT may provide the greatest insight into cognitive process involvement during transition to automaticity (Olk, 2013).
The Present Study
Although eye tracking techniques have been found to be reliable measures of cognitive function overall, no research has utilised these techniques in the cognitive field of automaticity (Mele & Federici, 2012). The overall purpose of this research was therefore to identify whether eye tracking can be used as an indicator of automaticity. As eye movements are considered to be a direct measure of the cognitive processes underlying behaviour, it was expected that assessing task automaticity with eye tracking would provide support to the existing theoretical framework relating to task automaticity. In particular, that an algorithm is used to provide a solution to a task until memory retrieval is possible.
The aim of the current research was therefore to identify whether changes in eye movement patterns while undertaking the dot counting task correspond to the transition to automaticity as traditionally indicated by changes in RT. It was predicted that as the strategy to find a solution changes from the application of a general algorithm to memory retrieval, the need to look at each dot in a stimulus would be reduced. As a result, the overall time to make a response should be reduced with practice, as should the number of fixations per stimulus. It was therefore hypothesised that the RT and fixation count would decline as performance moved towards automaticity. It was also hypothesised that eye fixations would become more concentrated in the centre of the stimulus as the stimulus becomes familiar and a solution can be retrieved from memory. It was expected that fixation duration would increase as participants transitioned from counting each dot to fixating on features of the stimulus which would aid overall pattern recognition. An additional hypothesis was therefore
that the mean fixation duration would increase as a participant fixated on the stimulus centre to generate a solution via memory retrieval.
Method
Participants
Approval for this experiment was granted by the Edith Cowan University School of Psychology and Social Science (SPSS) Ethics Sub-committee. Convenience sampling was used to recruit 16 participants (seven males and nine females, ranging in age from 24 to 64 years), who were recruited via word of mouth and advertising on social media (see Appendix A). As data analysis focussed on individual performance characteristics rather than estimation of population parameters from sample statistics, 16 participants was considered adequate to achieve the goals of the research. In order to be eligible for the research, participants were required to be over the age of 18 years, have basic numeracy skills (the ability to count to at least 20) and have normal vision (whether corrected or otherwise). All participants were placed in a raffle draw for the opportunity to win one of two $50 Coles/Myer gift vouchers.
Materials
The dot counting task was conducted using the Cedrus SuperLab 5.0 (Cedrus Corporation) software program. The task was presented on a 13.3 inch Dell Latitude E4300 laptop. The laptop was connected to the Cedrus RB-840 USB (Cedrus Corporation) stimulus response pad. The response pad had six buttons in two groups of three arranged in one horizontal row. These buttons were labelled six to 11, corresponding to the number of dots in the six dot stimuli. The laptop was also connected to the Tobii X2-30 (Tobii Technology AB) Eye Tracking Device. The device recorded each participant’s eye movement data as they completed the dot counting task.
Stimuli. Two groups of six dot pictures were constructed. One set (see Appendix B)
was used in the practice phase of the experiment, whereas the other set (see Appendix C) were used in the experimental phase. The stimulus images consisted of solid black dots contained within a rectangular frame. All dots were 12 mm in diameter. Both the practice and the task stimulus sets had one image for each numerosity value (i.e., six to 11). Having more than five dots for each stimulus eliminated the possibility of participants subitizing
(generating a quick and accurate response without the requirement to count) to produce a solution (Lassaline & Logan, 1993; Plaisier, Bergmann Tiest, & Kappers, 2010; Watson, Maylor, & Bruce, 2007). The dots in each stimulus were positioned randomly.
Reaction time.The RT measure identifies how long it takes for a participant to
record a response during task completion (Palmeri, 1999). The RT identified the length of time (in milliseconds) the participant took in order to record a response after the presentation of a stimulus. The RT was recorded by the Cedrus SuperLab 5.0 (Cedrus Corporation) software package. Test-retest reliability measures have shown that RT is a good measure of individual performance as it remains stable over time (Balota & Yap, 2011). In addition, current theories about skill acquisition measure task improvement through changes in RT, therefore using this measure ensures that consistency is maintained with other studies that have also focused on skill acquisition and task performance (Touron, Hoyer, & Cerella, 2001).
Fixation.All fixation measures were recorded using Tobii Studio 3.2.2 (Tobii
Technology AB) software. The eye selection filter was set up to calculate the average gaze point from both eyes. The velocity and distance thresholds were set to 35 pixels. The sampling rate was 30 Hz and the binocular gaze accuracy was 0.32°. The Tobii Fixation Filter (Tobii Technology AB) was used as the classification algorithm to determine when one fixation would end and another fixation would commence.
Procedure
An instruction sheet explaining the experimental procedure was used to ensure consistent communication across participants (Appendix D). Participants were provided with an information sheet that explained the details of the research (see Appendix E). Participants were also provided with a consent form (see Appendix F) and written consent was obtained prior to proceeding with data collection. Participants were advised that their involvement in the researchwas completely voluntary and that participation could be withdrawn at any time with no consequences. Each participant was required to attend the Edith Cowan University Memory and Cognition laboratory for a session that was approximately 45 minutes in duration.
This research used a quantitative design to determine whether differences exist in eye movements before and after a task becomes automatic. The independent variable was the numerosity in a stimulus and the amount of practice that a participant had in completing the task, whereas the dependent variables were the RT to complete the task, as well as the fixation count, location and duration. In order to complete the task, participants were positioned approximately 65cm from the laptop screen and within comfortable reach of the response pad. Participants were verbally advised to sit upright and to remain as still as possible while the task was in progress.
A five point automatic calibration procedure was conducted for each participant to ensure that the eye tracking was recorded accurately. The calibration error vectors for each participant were checked to ensure that no calibration points were missed. The calibration was repeated until adequate gaze information was obtained by the eye tracking device. The dot counting task was then launched through SuperLab 5.0 (Cedrus Corporation) and further instruction regarding the task was presented on the screen. The participant was left alone in
the laboratory to ensure that minimum distraction would be experienced. The researcher advised each participant that they would be in the adjacent room in case any difficulties were experienced.
The screen instructions were presented in size 18 black type Arial font on a white background. The instructions informed the participants that images would be presented on the screen. Images were presented one at a time and consisted of between six and 11 dots. Prior to the presentation of each image, a cross (acting as a cue) appeared in the middle of the screen. The cue appeared on the screen for 500 ms. Participants were advised that their task was to determine how many dots were on the screen. Responses were registered by pressing the corresponding response pad button as quickly as possible. Each stimulus image remained on the screen until a response was made. After each response, participants were provided with feedback confirming whether the response was correct or incorrect. Although feedback is not considered to be important once task proficiency is reached, there is evidence that it may aid the development of automaticity at the initial stages of practicing a task (Ashby & Crossley, 2012).
In order to ensure that the task instructions were understood, participants were required to complete a practice trial. The practice trial consisted of six images (with between six and 11 dots on each image) presented in a random order. The images used in the practice trial were different to the images presented in the experimental trials. When a participant completed the practice phase, the experimental trial was initiated when any button was pressed on the response pad.
There were 30 experimental trial blocks. Participants were advised when the end of a block had been reached. Participants were also advised that the following block would commence when any button on the response pad was pressed. In each block of trials, the six
task stimuli were presented three times each. Thus each block consisted of 18 trials, presented in a random order. Each stimulus was presented to the participants 90 times. Overall,
participants were required to provide a response for 540 task images. Once the participant completed the task, they were instructed to complete a short questionnaire confirming which strategies were used during the task (Appendix G). Participants were also asked to report on their subjective task difficulty experiences during different phases of the task. Once the questionnaire was completed, participants were debriefed and given the opportunity to ask questions.
Results
Data Analysis
Reaction time. A mean RT was calculated for each numerosity in each block for each
participant. The RT for any incorrect responses was not included in this calculation. Response accuracy was checked to ensure that participants were not guessing. In Lisi et al. (2015), participants who obtained 75% or more correct responses were included in the analysis. In the current study, 80% or more correct responses was set as the criterion for inclusion. Participant accuracy ranged from 89.4% to 99.9% therefore no participant data was excluded from the analysis. The mean RT scores were then averaged over three phases (early, middle and late) for each numerosity to determine whether there were performance
differences at different stages of the task. Each phase consisted of 10 experimental blocks (blocks 1-10 in the early phase, 11-20 in the middle phase and 21-30 in the late phase). There were four instances where a mean RT score for a block was unavailable due to the participant providing an incorrect response on all three trials for a particular numerosity. The missing values were replaced with the participant’s mean for the particular numerosity over the affected block phase.
Each participant’s mean RT as a function of numerosity per task phase was assessed in order to identify whether task automaticity was reached. Based on previous research
(Lassaline & Logan, 1993; Logan, 1988), it was expected that RT would decline until RT was no longer a function of numerosity. The current study used the criteria proposed by Speelman and Muller Townsend (under review) to assess whether automaticity was reached. One such criterion used slope values of regression lines that described how RT related to numerosity. A participant was considered to be progressing towards automaticity when the slope values become smaller with each subsequent phase. That is, that the differences in RT for each numerosity decreased with each task phase. Additionally, the slope value in the late phase should be no more than 100 ms. The slope value in the last phase was based on the research conducted by Lassaline and Logan (1993), who found that solution generation was via memory retrieval at this stage of practice.
Eye tracking Data. Four fixation measures were used to analyse the eye tracking
information. The first was fixation count, which is the overall number of fixations. The fixation count can be used to identify eye activity within a specified area (Stickler & Shi, 2015). The second measure was the location of fixations within a specified area. Fixation location is considered to be an accurate reflection of the stimulus area that is being used to complete a task (Huber, Mann, Nuerk, & Moeller, 2014). Fixation locations were assessed by identifying the percentage of the total number of fixations within a specified area, for each task phase. Another measure used was the mean fixation duration, which is the average length of time that the eyes hold a gaze on one location before moving to another location (Godfroid & Uggen, 2013; Papageorgiou et al., 2014; Valle, Binder, Walsh, Nemier, & Bangs, 2013). Fixations were measured in seconds for specified areas of interest. The last measure used was the sum of fixation duration, which is the sum (in seconds) of all fixation durations in the early, middle and late phases.
In order to assess the eye movement data as a function of phase, each participants’ eye movement data had to be manually separated per block. In order to do this, the recording of each participant was viewed in slow motion. The beginning of the block was considered to be at the presentation of the first cue. The end of a block was considered to be at the presentation of the ‘end of block’ message. The recording running time was presented in minutes, seconds and milliseconds. The recording segmentation was to the nearest millisecond. The start and end times of the block were entered into Tobii Studio 3.2.2 (Tobii Technology AB) software. The studio software package generated the fixation count, mean fixation duration, and total fixation duration for each of the blocks.
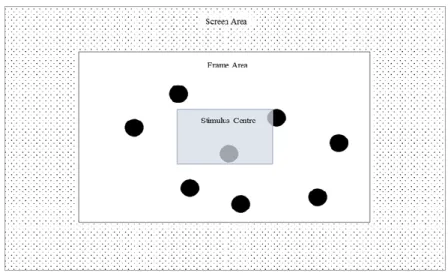
The screen area was divided into three separate “areas of interest” (see Figure 1) in order to determine whether the location of fixations changed across the defined phases. Areas of interest are specified areas for which fixation information can be collected (Jarodzka et al., 2010). The specified areas of interest did not overlap. Therefore, if an eye fixation was recorded in the frame area, it was not recorded in the screen area.
Figure 1. Defined areas of interest during stimulus presentation.
The screen area outline represented the visual display on the laptop used throughout the study. The frame area border mimicked the border of the stimulus display. The stimulus
centre was set to be the middle 10% of the frame area. The number of dots present in the frame and stimulus centre areas for each numerosity is presented in Table 1. A dot was considered to be in an area if more than 50% of the dot was located in the area.
Table 1
Number of Dots in the Analysis Regions of Each Stimulus
Due to technical error, one recording did not capture a participant’s eye movement data for blocks 28-30. Consequently, the fixation count, the mean fixation duration and the sum of fixation durations were unavailable for these blocks. Given that the missing data was from the late phase of the task, the means for the available blocks in the late phase were used to replace the missing values. That is, the means of blocks 21-27 for the fixation count, mean fixation duration and the sum of fixation duration were used to replace the corresponding missing values for blocks 28-30. Another technical glitch was experienced when the recording for one participant ceased midway through a block. The incomplete block was discarded and the participant continued the task until they completed the required 30 blocks.
ANOVA Analysis. Changes in RT, fixation count, the mean fixation duration and the
sum of fixation duration were assessed by conducting several repeated measures analyses of variance (ANOVA) with the Statistical Package for Social Sciences (SPSS) (version 22). Another repeated measures ANOVA was conducted to determine whether the proportion of eye fixations in each area of interest changed as a function of phase. An analysis was also
conducted to identify whether any differences existed between participants who attained automaticity and those who did not. This analysis involved comparing individual plots of mean RT as a function of numerosity, as well as the total fixation number, the proportion of fixations in each area of interest and the mean fixation duration as a function of phase. The plots were assessed in conjunction with the participant questionnaire.
Questionnaire. A short questionnaire was used to record details about the individual
strategies used in order to complete the task. Previous studies (Bourne et al., 2010; Green, Lemaire, & Dufau, 2007; Logan et al., 1999) have found that self-reported changes in strategy use were beneficial in explaining changes in RT. Another purpose of the
questionnaire was to identify whether participants perceived the task to change in difficulty with practice. The questionnaire consisted of multiple choice questions as well as open-ended questions.
Findings
Reaction time. A repeated measures ANOVA was conducted to compare participant
RTs across the three phases. The Shapiro-Wilk test statisticswere not significant in the early phase, W(16) = .951, p = .499, in the middle phase, W(16) = .979, p = .955, or in the late phase, W(16) = .961, p = .686, indicating that the assumption of normality was not violated. The Fmax score was 1.536. As Fmax was less than 10, homogeneity of variance can be assumed (Tabachnick & Fidell, 2007). Mauchly’s test of sphericity was violated, therefore the Huynh-Feldt epsilon adjusted test was used (Tabachnick & Fidell, 2007). The ANOVA results show that a significant difference in RT exists between the phases, F (1.26, 18.92) = 46.27, p < .001, partial ɳ²L = .305. Pairwise comparisons identified that the RT was
phase (M = 1884.52 ms, SD = 431.92) and the late phase (M = 1662.96 ms, SD = 420.71). The middle phase RT was also significantly slower than the late phase RT.
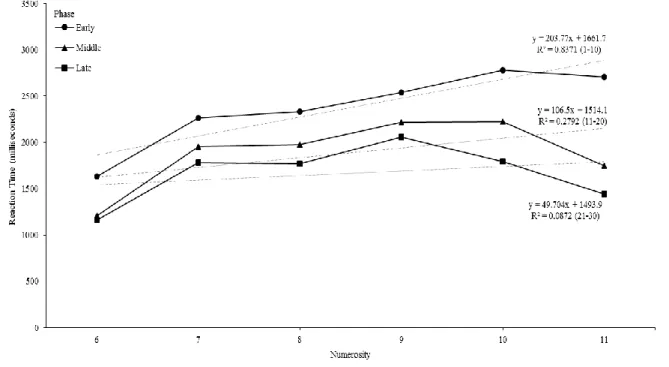
Automaticity. A linear regression of the mean RT as a function of numerosity in the
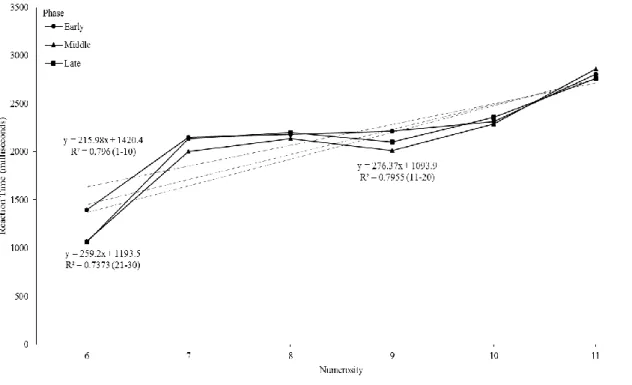
three phases was examined for each participant. The regression slope and the R² values of the mean RT were determined (see Table 2) to identify whether participants reached task
automaticity. The group mean RT as a function of numerosity for the early, middle and late task phases is presented in Figure 2. It was found that 13 of the 16 participants met the criteria for task automaticity. The results for seven of the 13 participants showed an overall reduction in slope across the phases and the slope value in the late phase was below 100 ms. Figure 3 is an example of a participant who reached automaticity and who showed a decrease in slope as a function of phase.
Table 2
Slope and R² Values for Participant Mean Reaction Times per Numerosity for Early, Middle and Late Phases of the Task
Note. Slope measure is in milliseconds. Automaticity criteria is a decrease in slope from
initial phase to the final phase, as well as a slope of 100 milliseconds or less in the final phase.
Participant R² Slope R² Slope R² Slope Automaticity
1 0.73 251.02 0.14 82.97 0.00 -8.72 Y 2 0.81 210.95 0.84 184.35 0.02 -37.37 Y 3 0.73 182.31 0.79 266.38 0.79 266.38 N 4 0.91 304.72 0.16 100.12 0.03 31.07 Y 5 0.80 215.98 0.80 276.37 0.74 259.20 N 6 0.66 355.46 0.07 83.89 0.01 -24.61 Y 7 0.95 319.78 0.50 154.31 0.03 29.17 Y 8 0.51 183.59 0.16 59.08 0.18 66.03 Y 9 0.05 -52.10 0.01 -24.32 0.02 26.37 Y 10 0.84 298.92 0.83 283.57 0.78 270.85 N 11 0.12 112.28 0.09 -69.34 0.11 -25.98 Y 12 0.94 289.16 0.00 -4.90 0.00 0.95 Y 13 0.01 12.51 0.03 -37.37 0.02 -26.67 Y 14 0.92 326.32 0.14 203.63 0.06 -125.34 Y 15 0.66 220.57 0.35 118.61 0.06 48.52 Y 16 0.00 0.40 0.00 -5.37 0.00 4.81 Y Late Block Segment Early Middle
Figure 2. Mean RT as a function of numerosity in the early, middle and late phases of the task.
Figure 3. Mean RT as a function of numerosity in the early, middle and late phases for
participant 1, who met the criteria for automaticity.
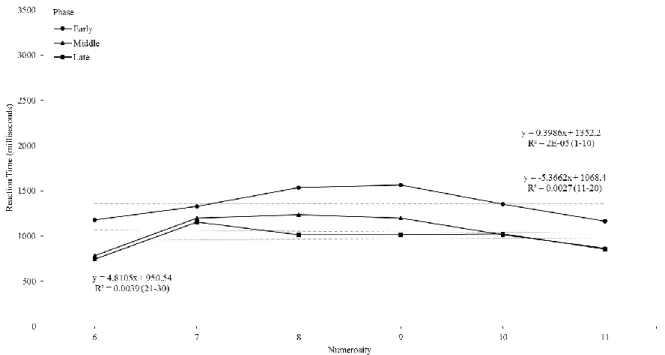
The remaining six of the 13 participants who met the criteria for task automaticity had a slope of less than 100 ms in the final task phase, but did not experience a decreasing trend
in slope across the task phases. However three participants had slope values under 100 ms for all three phases, so it was considered that the participants were completing the task
automatically throughout the entire task. As can be seen in the Figure 4 example, participant slope remained relatively stable throughout the task. Another three participants had an overall decrease in slope value across the task phases, but had the smallest slope value in the middle phase (and not the late phase). However the slope in both the middle and late phases was close to zero, therefore this result was considered a fluctuation in automatic task completion. The plot analysis of the three participants revealed an overall decreasing trend in RT as a function of task phase despite a small slope increase in the middle phase (see Figure 5).
Figure 4. Mean RT as a function of numerosity in the early, middle and late phases for
participant 16. The participant was considered to be completing the task automatically due to a stable slope that was under 100 ms in each phase of the task.
Figure 5. RT as a function of numerosity in the early, middle and late phases for participant 11, who met the criteria of task automaticity. The slope value was smallest in the middle phase, but was under 100 ms in both the middle and late phases of the task.
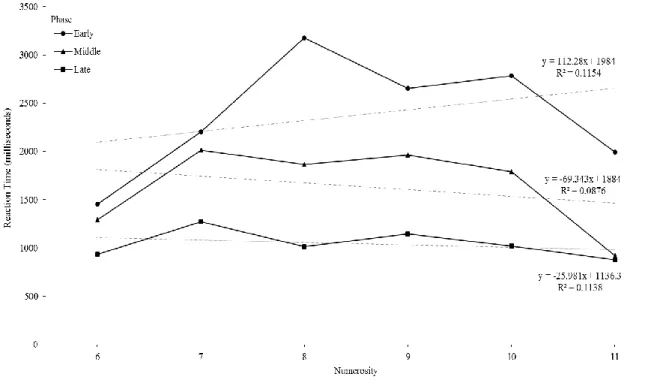
Overall, three of the 16 participants did not meet the criteria for task automaticity. Two participants did not have a declining slope as a function of phase and had a slope which was greater than 100 ms in the final phase. The remaining participant experienced a
decreasing slope as a function of task phase, but did not reach a slope of 100 ms or less in the final phase. All three participants showed little change in slope across the three task phases in the plot analysis (see Figure 6).
Figure 6. Mean RT as a function of numerosity in the early, middle and late phases for participant 5, who did not meet the criteria for automaticity.
Fixation. Repeated measures ANOVAs were used in order to investigate whether
fixation count, the mean fixation duration and the location of fixations was significantly different across the early, middle and late task phases.
Fixation count.The Shapiro-Wilk test statistics were not significant, therefore
normality was assumed for the early phase, W(16) = .965, p = .758, for the middle phase, W(16) = .926, p = .209, and for the late phase, W(16) = .969, p = .814. The Fmax score was 1.507, therefore homogeneity of variance was assumed. Mauchly’s test indicated that the sphericity assumption had been violated, therefore the Huynh-Feldt epsilon correction was used. The ANOVA results revealed a significant difference in fixation count across the three phases, F (1.24, 18.60) = 39.82, p < .001, partial ɳ²L = .323. The pairwise comparison results showed that the fixation count was significantly higher in the early phase (M = 165.38, SD = 26.75) than in the middle phase (M = 140.74, SD = 21.79) and in the late phase (M = 126.09, SD = 23.95). The number of fixations was also found to be significantly higher in the middle
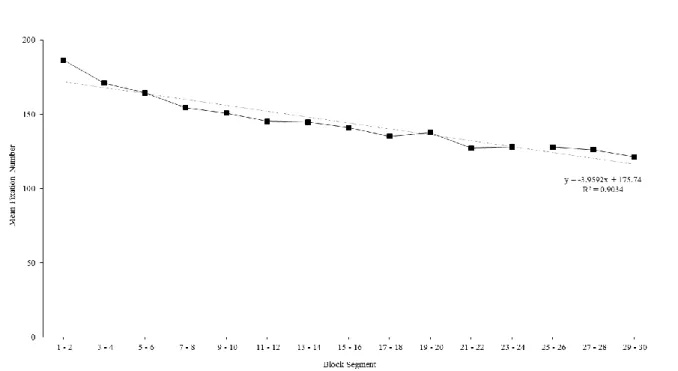
phase than in the late phase. The individual plot analysis indicated that regardless of
automaticity status, all participants experienced a reduction in fixation count as a function of task phase. The mean fixation count as a function of task phase across all participants is presented in Figure 7.
Figure 7. Mean fixation number (and linear regression) as a function of block segment
(where each block segment comprises two experimental blocks).
Fixation location.Three separate repeated measures ANOVAs were conducted to
assess whether the proportion of fixations within a specified area of interest experienced a significant change per phase. The Shapiro-Wilk test for the screen area was significant for all phases (early phase: W(16) = .869, p = .026; middle phase: W(16) = .814, p = .004; late phase: W(16) = .862, p = .020). It has however been documented that the ANOVA is considered to be robust against violations of normality, and the results are unlikely to be affected (Howell, 2010; Schmider, Ziegler, Danay, Beyer, & Bühner, 2010; Tabachnick & Fidell, 2007). Homogeneity of variance was assumed with an Fmax score of 2.968.
significant difference was found in the proportion of fixations in the screen area across the phases, F (2, 30) = .123, p = .885, partial ɳ²= .008.
The Shapiro-Wilk test for the frame area was not significant for all phases, W(16) = .959, p = .638 (early phase), W(16) = .966, p = .774 (middle phase) and W(16) = .970, p = .842 (late phase). As the Fmax was 2.699, homogeneity of variance was assumed. Mauchly’s test indicated the sphericity assumption had been violated, therefore the Huynh-Feldt
correction was used. There was a significant difference in the proportion of fixations located in the frame area across phases, F (1.20, 18.03) = 7.965, p = .008, partial ɳ²L = .099. The pairwise comparisons show that the proportion of fixations in the frame area was
significantly larger in the early phase (M = 71.36%, SD = 1.82) than in the middle phase (M = 67.00%, SD = 2.06) and the late phase (M = 64.04%, SD = 2.99). No significant difference was found between the middle and the late phases.
As the Shapiro-Wilk test was not significant across all task phases for the stimulus centre W(16) = .959, p = .644 (early phase), W(16) = .957, p = .614 (middle phase) and W(16) = .970, p = .847 (late phase), normality was assumed. An Fmax score of 2.732 indicated homogeneity of variance. As Mauchly’s test indicated the sphericity assumption had been violated, the Huynh-Feldt correction was used. It was found that a significant difference exists in the proportion of fixations in the stimuli centre area across phase, F (1.21, 18.18) = 8.130, p = .008, partial ɳ²L = .097. Pairwise comparisons showed that the proportion of fixations in the early phase (M = 28.28%, SD = 1.81) was significantly lower than the
proportion of fixations in the middle phase (M = 32.59%, SD = 2.12) and in the late phase (M = 35.57%, SD = 2.99). However there was no significant difference in fixation proportions between the middle and late phases.
The individual plot analysis showed that 10 participants who had reached
automaticity showed an increase in proportion of fixations in the centre of each stimulus as a function of phase. Two participants who attained automaticity had a decreased proportion of fixations in the stimuli centre and another one showed stability in fixation proportions across all areas of interest. Of the three participants who did not reach automaticity, one showed an increase in the proportion of fixations in the stimuli centre. One participant showed a
decrease and another remained stable across the task phases. A summary of the slope and regression results for the proportion of fixations in each area of interest as a function of block segment (where each block segment comprises of two experimental blocks) is presented in Table 3.
Mean fixation duration.The Shapiro-Wilk test statistic was not significant for the
middle phase, W(16) = .923, p = .189, but was significant for the early phase, W(16) = .862, p = .021, and the late phase W(16) = .875, p = .032. However the ANOVA is considered to be robust when normality is violated (Howell, 2010; Schmider et al., 2010; Tabachnick & Fidell, 2007). The Fmax score was 1.735, therefore it was assumed that the homogeneity of variance was not violated. Mauchly’s test was not significant, therefore sphericity was assumed. The ANOVA test results showed that mean fixation duration was not significantly different between the early phase (M = .328s, SD = .028), middle phase (M = .331s, SD = .030) and late phase (M = .333s, SD = .038), F (2, 30) = .864, p = .432, partial ɳ²= .054.
The individual plot analysis for the mean fixation durations did not reveal any patterns for those who reached automaticity compared to those who did not. The mean fixation duration stayed relatively consistent across all phases of the task for all participants. The R² values for the mean fixation duration as a function of block segment (where each block segment comprises of two experimental blocks) ranged from .02 to .62 for participants who did not meet the criteria for automaticity and from .00 to .80 for participants who did
meet the criteria. The slope was near zero across all participants. A summary of the slope and regression for the participant mean fixation duration is presented in Table 3.
Table 3
Participant Slope and R² Values for Fixation Proportions per Area of Interest and Mean Fixation Durations as a Function of Block Segment (Where Each Block Segment is Two Experimental Blocks)
Sum of fixation duration.Normality was assumed, as the Shapiro-Wilk test was not
significant for all phases,W(16) = .944, p = .397 (early phase), W(16) = .916, p = .148
(middle phase) and W(16) = .899, p = .078 (late phase). The Fmax score was 2.991, therefore homogeneity of variance was assumed. Mauchly’s test indicated that the sphericity
assumption had been violated, therefore the Huynh-Feldt epsilon correction was used. The ANOVA showed that there was a significant difference in the sum of fixation duration across phases, F (1.29, 19.30) = 37.92, p < .001, partial ɳ²L = .469. The pairwise comparison
analysis revealed that the sum of fixation duration was significantly higher in the early phase (M = 53.96s, SD = 1.87) than in the middle phase (M = 45.80s, SD = 1.08) and the late phase
Proportion of Fixations in Area of Interest
Mean Fixation Duration
Participant R² Slope R² Slope R² Slope R² Slope Automaticity
1 0.14 -0.04 0.56 -0.68 0.55 0.72 0.02 0.0004 Y 2 0.01 0.01 0.89 -1.37 0.88 1.36 0.11 0.0008 Y 3 0.16 -0.02 0.00 0.01 0.00 0.01 0.11 -0.0011 N 4 0.05 0.01 0.88 -2.11 0.88 2.10 0.01 -0.0004 Y 5 0.06 0.04 0.00 0.00 0.01 -0.04 0.62 0.0025 N 6 0.51 0.07 0.17 -0.29 0.11 0.22 0.70 -0.0023 Y 7 0.16 0.03 0.75 -1.25 0.74 1.22 0.02 -0.0002 Y 8 0.42 -0.10 0.15 0.83 0.12 -0.73 0.46 -0.0025 Y 9 0.03 -0.02 0.10 0.42 0.10 -0.40 0.36 0.0015 Y 10 0.10 0.02 0.28 -0.61 0.27 0.59 0.03 -0.0005 N 11 0.00 0.00 0.86 -2.99 0.87 2.98 0.80 0.0055 Y 12 0.12 -0.01 0.34 -0.66 0.36 0.67 0.00 -0.0001 Y 13 0.01 0.00 0.72 -0.75 0.73 0.75 0.73 0.0026 Y 14 0.06 0.02 0.00 -0.02 0.00 0.00 0.50 -0.0021 Y 15 0.17 0.04 0.43 -0.88 0.40 0.84 0.28 0.0014 Y 16 0.16 -0.02 0.65 -1.10 0.66 1.12 0.02 0.0003 Y
(M = 41.18s, SD = 1.29). The sum of fixation duration was also found to be significantly higher in the middle phase than in the late phase.
Questionnaire. The questionnaire results showed that nine of the 16 participants
found the task to be harder at the beginning of practice and easier at the end, whereas the remaining participants did not note a difference in difficulty. Fifteen participants indicated that they used memorisation at some stage during the task. Thirteen participants reported counting and five participants reporting guessing at some stage during the task. Fourteen participants reported that the easiest strategy to use was memorising. One participant, who did reach automaticity, reported guessing being the easiest strategy, whereas another participant who did not reach automaticity, reported that counting was the easiest strategy.
Discussion
The purpose of the current study was to identify whether eye movement tracking can be used as an indicator of automaticity. The aim of the study was to determine whether eye movement patterns would reflect the transition to automaticity normally exhibited in the dot counting task through changes in participant RT. The initial assessment was to assess
participant RT and whether task automaticity was reached. The results showed that there was a significant difference in participant RT from the early phase of the experiment to the late phase. This result is consistent with previously conducted studies that show that with practice, RT for task completion decreases and task completion becomes less deliberate and effortful (Godfroid & Uggen, 2013; Speelman & Parkinson, 2012). This pattern in task completion is expected when participants transition from the use of an algorithm for task completion, to the use of memory retrieval (Bourne et al., 2010).
Using the automaticity criteria proposed by Speelman and Muller Townsend (under review), it was found that only 13 of the 16 participants reached automaticity. This result is
consistent with the study conducted by (Bourne et al., 2010), who found that only some of the participants transitioned to relying on retrieval. Bourne et al. (2010) suggested that this result indicates that automaticity may not be a certain result of task practice. There may be factors that influence whether a participant will become automatic. For instance, if the quality of the participants’ practice is insufficient, it may be that the task algorithms remain as the leading providers of a solution (Wilkins & Rawson, 2011). Otherwise, if the features of the stimuli are complex and therefore difficult to memorise, an algorithm solution may remain as a viable option for longer (Bourne, Healy, Kole, & Graham, 2006).
The current study showed that the number of fixations decreased as a function of phase. This was a consistent finding for all participants, suggesting that task experience (and not necessarily task automaticity) can result in reduced fixations. This result is consistent with the assumption that in the initial stages of practice, a participant is likely to count each dot to generate a solution. As found in the study by Li et al. (2010), the number of fixations increased as a function of how many numbers the participant was required to count. However with practice, a participant becomes more proficient at the task and is therefore able to
provide a solution with less visual input (Foerster & Schneider, 2015). Consequently, attention can be targeted toward areas of the stimuli that are most likely to assist in the development of a memory retrieval strategy, resulting in a reduction in the overall time to complete the task (Piras et al., 2010). This finding is consistent with the results obtained by Orquin, Bagger, & Mueller Loose (2013) who found that increased practice leads to a reduced number of fixations. The result is also consistent with the findings of Piras et al. (2010) who found that experts in the field of sport have fewer fixations than novices.
The present findings indicate that as the overall number of fixations is reduced, the proportion of fixations in particular areas of interest change. It was found that few fixations were present in the screen area across all participants, and across all task phases. This
suggests that participants allocated their attention to the stimulus area (the frame and stimuli centre areas) for the majority of the task completion time. A significant difference was found to exist in the proportion of fixations in the frame and stimuli centre areas between the early and middle phases. As the proportion of fixations was reduced in the frame area, they increased in the stimuli centre area. However differences in the proportion of fixations was not found between the middle and late phases. This result is consistent with the practice effects expected during task automaticity. The largest changes in RT are experienced at the initial stages of practice (Logan, 1992). Once memory retrieval can be used to produce a solution, RT gets faster and becomes more stable (Touron et al., 2011).
The eye tracking findings also suggest that participants transitioned from the counting algorithm to a quicker method for obtaining a solution. As per Table 1, the stimuli centre area consisted of a small proportion of dots for each numerosity level. The increased proportion of fixations found in the stimuli centre area suggests that participants were no longer counting each dot to produce a solution. This finding is consistent with other studies that also found that participants would initially fixate on all stimulus features, but would later focus on fewer, more salient features to produce a solution (Foerster & Schneider, 2015; Orquin et al., 2013). It has been suggested that changes in fixation location is a result of participants knowing where they need to focus their attention in order to produce a solution via memory retrieval (Foerster & Schneider, 2015; Piras et al., 2010). In the current study, it is likely that participants may have been able to fixate on the stimulus centre to recognise the dot pattern and subsequently retrieve a solution.
The findings showed that there was a significant decrease in the overall fixation durations as a function of task phase. It has been proposed that fixation duration is an indicator of the attention a stimulus is given (Dogusoy-Taylan & Cagiltay, 2014; Moeller et al., 2011; Papageorgiou et al., 2014). For instance, in the eye tracking review conducted by
Rayner (2009), it was suggested that more difficult tasks or tasks that require a lot of
information to be processed caused increased fixation durations. Olk (2013) reported similar findings, as participants experienced longer fixation durations when more information was presented for cognitive processing.
A similar effect has been found when comparing novices and experts. It has been found that novices have longer fixation durations, which is presumably a result of having to exert more attention than someone who is experienced in a particular task (Gegenfurtner, Lehtinen, & Säljö, 2011; Jarodzka et al., 2010; Piras et al., 2010). In the current study, participants were expected to become more proficient at the dot counting task with more practice. It is suggested that greater task proficiency resulted in less attention being required for the generation of a response. The reduced requirement for attention has subsequently resulted in the observed reduction of the overall fixation duration.
There were no significant differences found in the mean fixation durations as a function of phase. The individual plot analysis revealed that the mean fixation duration remained constant across all phases of the task and regardless of whether a participant met the criteria for task automaticity. This result suggests the significant changes in overall fixation duration as a function of phase was due to fewer fixations, rather than changes in the length of the fixations. In a scene viewing study conducted by Henderson and Smith (2009), it was found that fixation durations were relatively constant. It was suggested that fixations may be restricted to a duration parameter which is based on the task being performed. In a visual search study conducted by Hooge and Erkelens (1998), it was found that fixation duration remained relatively constant regardless of how much the task was practiced.
Individual Analysis
It is important to assess group results as well as any individual differences in order to gain a full understanding of a phenomenon being examined (Bourne et al., 2010). Individual
differences in results may be an indicator of something that average group results would not otherwise reveal. In the current study, it was found that 13 of the 16 participants met the criteria for automaticity and three of the 16 participants did not. A closer analysis of the participant data may reveal factors about cognitive processing which are vital for the holistic understanding of skill acquisition and in particular, task automaticity. In the next section some of the individual differences found in the current study are considered as well as some possible explanations for those differences.
Transition to Automaticity? Automaticity has been described as a phenomenon that
can develop gradually and at a different pace for each individual (Dormal & Pesenti, 2013). It is also suggested that an individual’s transition to automaticity can fluctuate more than group results suggest (Bourne et al., 2006). A participant may try different strategies to see which is most effective (Bourne et al., 2010; Wilkins & Rawson, 2011). Another possibility is that different stimuli within a task become automatic at different times (Bourne et al., 2006). In the current study, three participants had an overall decline in slope, but the lowest slope value was in the middle task phase. Both the middle and late phase slope values were less than 100 ms, therefore it was considered that the participant had transitioned to automaticity. The fact that the slope did not decline as a function of task phase supports the notion that fluctuations in task performance can occur.
There may be salient features about certain stimuli or within a stimulus that makes it easier to recall. For instance, Lassaline and Logan (1993) suggested that there may be a number of patterns within a stimulus that can be subitized and therefore a solution can be obtained in less time. In the current study, three participants were considered to have met the criteria for automaticity although their RT slope did not decrease as a function of task phase. However all three participants had a slope value below 100 ms in all phases and were