Current Report:
Community Profile Report of Custom Region:
Rome Block Groups
Date:October 7, 2020
Proposed Area:
This area is located in Floyd County, in the state of Georgia
It is located within or touches the following 2010 census tract(s): 13115001600. Similarly, it is located within or touches the following zip code(s): 30161.
Data presented in this report summarize the geographies specified in the citation information in each section.
This Area is Served by (or touches):
School District(s): Floyd County School District, Rome City School District Congressional District(s): Georgia's 14th District
Senators: Kelly Loeffler (R-GA), David Perdue (R-GA) State Senate District(s): State Senate District 52 State House District(s): State House District 13
Population Trends:
As of the period 2014-2018, this area was home to an estimated 2,551 people.
Population 2000 2010 2014-2018 Change 2000 to 2014-2018 (%)
Area 2,769 2,703 2,551 -7.87%
Counties (Floyd) 90,565 96,317 96,824 6.91%
State (Georgia) 8,186,453 9,687,653 10,297,484 25.79%
Source: Census Data aggregated by:
2000 Data Contains: 2 Census Block Groups 2010 - 2014-2018 Data Contains: 2 Census Block Groups
Racial Characteristics:
Of the people living in this area in between 2014-2018, 43.04% are White, 53.67% are African American, 3.61% are Hispanic, 0% are Asian, 0% are either Native Hawaiian or Pacific Islander, 0% are American Indian or Alaskan Native, 2.2% are of "some other race" and 1.1% are of two or more races. In the table below, the percentage of the population that each segment represents in the report area is compared to the percent it represents in the state. Between 2000 and 2014-2018, the White population changed by 3.1%, the African American population by -11.45%, and Asian population by -100%. The number of Hispanics changed by 16.46%.
Race 2000 2010 2014-2018 Percent of Total Population in 2014-2018 Percent of State Population in 2014-2018 (Georgia)
White 1,065 932 1,098 43.04% 59.04% African American 1,546 1,616 1,369 53.67% 31.46% Asian 66 4 0 0% 3.91% Native Hawaiian or Pacific Islander 18 3 0 0% 0.06% American Indian or Alaskan Native 14 6 0 0% 0.33%
Some Other Race 34 99 56 2.2% 2.75%
Two or More Races 26 43 28 1.1% 2.45%
Ethnicity 2000 2010 2014-2018 Percent of Total Population in 2014-2018 Percent of State Population in 2014-2018 (Georgia)
Hispanic 79 151 92 3.61% 9.4%
Source: Census Data aggregated by:
2000 Data Contains: 2 Census Block Groups 2010 - 2014-2018 Data Contains: 2 Census Block Groups
Population Demographics:
Block Groups 1&3 of Census Tract 16
Population Demographics:
Block Groups 1&3 of Census Tract 16
43%
54%
0%
0%
0%
2%
1%
62%
27%
3%
0%
0%
6%
2%
0%
10%
20%
30%
40%
50%
60%
70%
White
African
American
Asian
Hawaiian or
Native
Pacific Islander
American
Indian or
Alaskan Native
Some Other
Race
Two or More
Races
Racial Demographics
Project Area Block Groups
City of Rome
3.6%
16.5%
0.0% 5.0% 10.0% 15.0% 20.0%Hispanic or Latino Population
Hispanic or Latino Demographics
Project Area Block Groups
City of Rome
Estimated Population of Project Area
Block Groups:
2,551 residents
Estimated Population of the City of Rome:
36,277 residents
Age Distribution:
In the report area in 2014-2018, 14.43% of the population is over the age of 65. 55.59% are of working age (18-64). 29.99% are under 18, and 6.9% are under 5 years old.
Age Number of People in Age Group Percent of People in Age Group Percent of People in Age Group (Georgia)
Under 5 176 6.9% 6.37%
Under 18 765 29.99% 24.29%
Working Age (18-64) 1,418 55.59% 62.58%
Aging (65+) 368 14.43% 13.13%
Source: Census Data aggregated by:
2014-2018 Data Contains: 2 Census Block Groups
Incomes:
The median household income for the study area ranged from $19,635 to $21,714, compared to the state of Georgia with a median of $55,679, as estimated for 2014-2018 by the Census' American Community Survey.
The number of households divided by income categories is shown in the Annual Income Category table. In the period of 2014-2018, 82.3% of households in the study area had an annual income of less than $50,000, compared to 45.24% of people in the state of Georgia.
2014-2018 Annual Income Category Number of Households Percent of Households
Rome Block Groups
Less than $25,000 581 57.13% $25,000 - $34,999 96 9.44% $35,000 - $49,999 160 15.73% $50,000 - $74,999 94 9.24% $75,000 - $99,999 26 2.56% $100,000 - $124,999 23 2.26% $125,000 - $149,999 0 0% $150,000 or more 37 3.64% County (Floyd) Less than $25,000 9,354 26.25% $25,000 - $34,999 4,623 12.97% $35,000 - $49,999 4,851 13.61% $50,000 - $74,999 6,386 17.92% $75,000 - $99,999 3,958 11.11% $100,000 - $124,999 2,755 7.73% $125,000 - $149,999 1,153 3.24% $150,000 or more 2,553 7.16% State (Georgia) Less than $25,000 815,427 21.98% $25,000 - $34,999 366,826 9.89% $35,000 - $49,999 496,060 13.37% $50,000 - $74,999 659,327 17.77% $75,000 - $99,999 453,876 12.24% $100,000 - $124,999 307,352 8.29% $125,000 - $149,999 193,627 5.22% $150,000 or more 416,993 11.24%
According to the Census' American Community Survey estimates, the median income for a family in the period of 2014-2018 ranged from $27,109 to
$36,544, compared to the state of Georgia with a median family income of $67,405.
Source: Census Data aggregated by:
2014-2018 Data Contains: 2 Census Block Groups
14
Population Demographics:
Census Tract 16
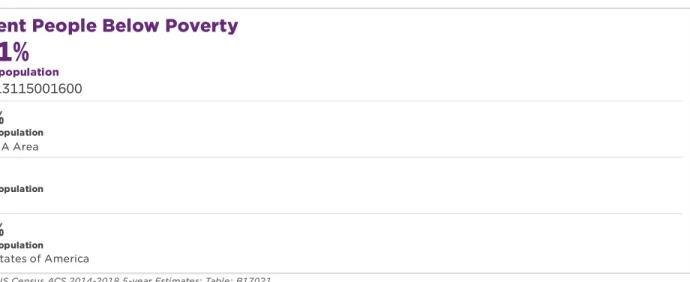
Percent of People in Poverty
This measure is an estimate of people living below the national poverty level. It is a measure of material hardship and deprivation, and is often used to determine eligibility in social safety programs. Census tracts with over 40% of residents
living below the poverty line are considered to be areas of concentrated poverty.
A high poverty rate has a negative effect on a census tract's overall Economic Security index score.
Percent People Below Poverty
Sources: US Census ACS 2014-2018 5-year Estimates; Table: B17021
38.1%
of total populationTract 13115001600
19.1%
of total population Rome, GA Area16%
of total population Georgia14.1%
of total population United States of AmericaSources: US Census 1990; Table P117, 2000; Table P087, 2010; Table B17; US Census ACS 2014-2018 5-year Estimates; Table: B17021. The number of census tracts represented here reflects the number chosen when creating this dashboard.Projections are calculated using a modified linear regression over the years: 1990, 2000, 2010, and the most recent 5-year ACS estimate and should be interpreted with caution.
Census Tract Comparison: People Below Poverty Level
Pe op le Tract 13115001600 1990 1995 2000 2005 2010 2015 2020 2025 800 1,000 1,200 1,400 1,600 1,800
Immigration:
Data from the U.S. Census Bureau for 2014-2018 indicate that N/A people or N/A of the population living in this area were "foreign born". Census defines foreign born as anyone who is not a U.S. citizen at birth. This area is located in Georgia, which, according to the Department of Homeland Security, was home to 26,242 people who were granted Legal Permanent Residence status in 2017. Those LPRs, or "green cards", represent 2.33% of green cards issued in the nation that year.
Source: Census, Department of Homeland Security Data aggregated by:
2014-2018 Data for Census Contains: 0 Boundaries Found 2017 Data for Department of Homeland Security Contains: 1 State
Families and Households:
The composition of the 587 families who reside in the study area is shown in the table below. Families are groups of related people who live together, whereas households refer to the person or group of people living in any one housing unit. Generally, households that do not contain a family are made up of unrelated people living together (eg, roommates) or people living alone. While it is possible for two families to share a household, the difference between the number of households and the number of families in an area shows, approximately, the number of non-family households in a place.
2014-2018 Family Composition Number of Families Percent of Families
Rome Block Groups
Families 587
--Married with Children 92 15.67%
Single with Children 186 31.69%
Single Female with Children 186 31.69%
Other Families 309 52.64%
County (Floyd)
Families 24,857
--Married with Children 6,149 24.74%
Single with Children 3,545 14.26%
Single Female with Children 2,546 10.24%
Other Families 15,163 61%
State (Georgia)
Families 2,501,768
--Married with Children 726,727 29.05%
Single with Children 384,479 15.37%
Single Female with Children 303,784 12.14%
Other Families 1,390,562 55.58%
Note: The category "Single with Children" includes all families that are "Single Female with Children", so all categories do not add up to 100 percent. Source: Census
Data aggregated by:
2014-2018 Data Contains: 2 Census Block Groups
2014-2018 Household Counts Number of Households
Rome Block Groups
Households 1,017 County (Floyd) Households 35,633 State (Georgia) Households 3,709,488 Source: Census Data aggregated by:
2014-2018 Data Contains: 2 Census Block Groups
Housing Type:
The type of housing available in this area is described in the table below. Single family homes include all one-unit structures, both attached and detached. Townhouses or duplexes include one-unit attached homes, as well as housing units with two units. Units in small apartment building are buildings with 3 to 49 units; large apartment buildings include buildings with 50 units or more. Other types of housing include vans, boats, recreational vehicles, or other units.
2014-2018 Housing Stock Number of Units Percent of Units
Rome Block Groups
Single family detached homes 747 59.38%
Single family attached homes 0 0%
2-unit homes and duplexes 155 12.32%
Units in small apartment buildings 307 24.4%
Units in large apartment buildings 19 1.51%
Mobile homes or manufactured housing 30 2.38%
Other types 0 0%
County (Floyd)
Single family detached homes 28,944 71.46%
Single family attached homes 634 1.57%
2-unit homes and duplexes 2,451 6.05%
Units in small apartment buildings 3,741 9.24%
Units in large apartment buildings 1,115 2.75%
Mobile homes or manufactured housing 3,588 8.86%
Other types 32 0.08%
State (Georgia)
Single family detached homes 2,816,301 66.41%
Single family attached homes 161,927 3.82%
2-unit homes and duplexes 92,367 2.18%
Units in small apartment buildings 637,211 15.03%
Units in large apartment buildings 146,382 3.45%
Mobile homes or manufactured housing 383,449 9.04%
Other types 3,366 0.08%
Source: Census Data aggregated by:
2014-2018 Data Contains: 2 Census Block Groups
Tenure:
Across the area, an estimated 31.76% or 323 households owned their home between 2014-2018. The average size of a household in this area ranged from
2.28 to 2.78 between 2014-2018, as compared to the average household size for the county and the state, 2.6 (Floyd) and 2.71 (Georgia) respectively.
Source: Census Data aggregated by:
2014-2018 Data Contains: 2 Census Block Groups
Vacancy:
There were an estimated 1,258 housing units in the study area in 2014-2018, according to the Census' American Community Survey. For 2014-2018, the Census showed an estimated 19.16% of housing units to be vacant, compared to 12.53% in the state of Georgia.
Source: Census Data aggregated by:
2014-2018 Data Contains: 2 Census Block Groups
Home Costs
Housing stability is only possible when homes are affordable to the people who live in them.
High median home values, while often a sign of wealth and affluence in a neighborhood, can also be exclusionary and indicate a need for more housing opportunities at different price points.
When rent or mortgage costs are high, relative to incomes, residents may be at risk for forms of instability like crowding, doubling up with other households, frequent moves, and ultimately homelessness. A common measure of affordability is the share of a household's income that is spent on gross monthly housing costs. Households that spend more than 30% of their income on housing are considered "cost-burdened," while those that spend more than half their income are considered "severely cost-burdened." This section i ncludes data on home and rent cost, how home values are changing over time, and cost-burden rates.
Median Home Value
Median Home Rent
Housing Cost-Burdened Owners
Housing Cost-Burdened Renters
Sources: US Census ACS 2014-2018 5-year Estimates; Table: B25077, Table: B25064, Table: B25091, Table: B25070
$81,800
USDTract 13115001600
$129,600
USD Rome, GA Area$675
USDTract 13115001600
$730
USD Rome, GA Area18.7%
of total homeownersTract 13115001600
19.1%
of total homeowners Rome, GA Area62.7%
of total rentersTract 13115001600
45.5%
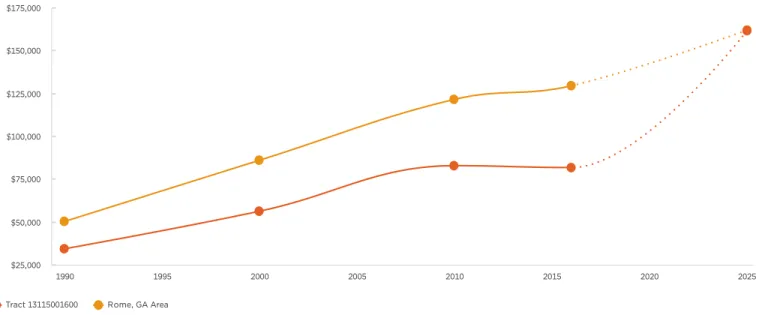
of total renters Rome, GA AreaHousing Statistics:
Census Tract 16
Sources: US Census 1990, 2000, 2010; US Census ACS 5-year
Projections are calculated using a modified linear regression over the years: 1990, 2000, 2010, and the most recent 5-year ACS estimate and should be interpreted with caution.
Median Home Value
U
S
D
Tract 13115001600 Rome, GA Area
1990 1995 2000 2005 2010 2015 2020 2025 $25,000 $50,000 $75,000 $100,000 $125,000 $150,000 $175,000
Sources: US Census ACS 2014-2018 5-year Estimates; Table: B25031
Median Rent by Number of Bedrooms
U
S
D
No Bedrooms One Bedroom Two Bedrooms Three Bedrooms Four Bedrooms Five Bedrooms $0 $250 $500 $750 $1,000 $1,250 $1,500
Tract 13115001600 Rome, GA Area
Sources: US Census ACS 2014-2018 5-year Estimates; Table: B25092, Table: B25071
Median Percentage of Income Spent on Housing
of median income 16.9% 16.9% 16.9% 42% 42% 42% 16.1% 16.1% 16.1% 29.9% 29.9% 29.9% Homeowners Renters 0% 2.5% 5% 7.5% 10% 12.5% 15% 17.5% 20% 22.5% 25% 27.5% 30% 32.5% 35% 37.5% 40% 42.5% 45%
Housing Statistics:
Census Tract 16
Percent of All Low-Income Households that are Severely Cost-Burdened
This measure is the estimated share of households that are low-income (at or below 80% of the area median income) and severely cost-burdened (paying more than half of their income on monthly housing costs, including utilities). When families pay so much for housing, they often have barely enough left over to afford other necessities, such as food, medicine, or child care.
A high rate of severely cost-burdened, low-income households has a negative effect on a census tract's overall Housing Stability Outcome index score.
Percent of Low Income Households Severely Cost Burdened
Sources: HUD CHAS 2012-2016
29.5%
PeopleTract 13115001600
13.17%
People Rome, GA Area13.83%
People Georgia13.86%
PeoplePostal vacancy shows short-term vacancy trends based on addresses where mail has not been collected for over 90 days. Data from Valassis Lists tracks vacancy on a quarterly basis. In the 2 quarter of 2020, the overall vacancy rate in this area was 10.59%.
Postal Address Vacancy 2019Q1 2019Q2 2019Q3 2019Q4 2020Q1 2020Q2
Rome Block Groups
Number Vacant - Residential 111 105 104 105 106 109
Percent Vacant - Residential 9.68% 9.15% 9.04% 9.08% 9.11% 9.36%
Number Vacant - Business 24 24 30 30 30 30
Percent Vacant - Business 17.02% 17.02% 20% 20% 20.27% 20.27%
Overall Vacancy Rate 10.48% 10.01% 10.31% 10.33% 10.37% 10.59%
County (Floyd)
Number Vacant - Residential 1,190 1,140 1,122 1,110 1,092 1,176
Percent Vacant - Residential 2.89% 2.76% 2.72% 2.69% 2.64% 2.84%
Number Vacant - Business 398 396 399 396 396 391
Percent Vacant - Business 12.12% 12.03% 12.08% 11.96% 11.96% 11.79%
Overall Vacancy Rate 3.57% 3.45% 3.41% 3.37% 3.33% 3.5%
State (Georgia)
Number Vacant - Residential 110,737 109,901 109,398 109,897 109,541 114,520
Percent Vacant - Residential 2.44% 2.41% 2.39% 2.39% 2.38% 2.48%
Number Vacant - Business 49,352 48,982 48,821 48,847 48,745 49,088
Percent Vacant - Business 12.91% 12.76% 12.7% 12.68% 12.68% 12.73%
Overall Vacancy Rate 3.25% 3.21% 3.19% 3.19% 3.17% 3.26%
Source: Valassis Lists Data aggregated by:
2019q1 - 2020q2 Data Contains: 2 Census Block Groups
Employment:
The following table shows the number of people who were employed, unemployed, in the labor force, and the unemployment rate for the market in which the report area is located, according to the Bureau of Labor Statistics.
Unemployment rate February 2020 March 2020 April 2020 May 2020 June 2020 July 2020
County (Floyd)
Employed 43,155 42,457 38,302 40,212 40,951 41,167
Unemployed 1,675 1,978 5,849 3,926 3,070 3,146
In Labor Force 44,830 44,435 44,151 44,138 44,021 44,313
Unemployment Rate 3.7 4.5 13.2 8.9 7 7.1
Metro Area (Rome, GA Metro Area)
Employed 43,155 42,457 38,302 40,212 40,951 41,167 Unemployed 1,675 1,978 5,849 3,926 3,070 3,146 In Labor Force 44,830 44,435 44,151 44,138 44,021 44,313 Unemployment Rate 3.7 4.5 13.2 8.9 7 7.1 State (Georgia) Employed 5,006,089 4,933,883 4,286,140 4,443,617 4,544,351 4,620,061 Unemployed 181,223 233,410 594,420 449,696 392,596 402,700 In Labor Force 5,187,312 5,167,293 4,880,560 4,893,313 4,936,947 5,022,761 Unemployment Rate 3.5 4.5 12.2 9.2 8 8 Source: BLS nd
21
Employment:
Census Tract (Bottom); Floyd County, Rome Metro Area,
State of Georgia (Top)
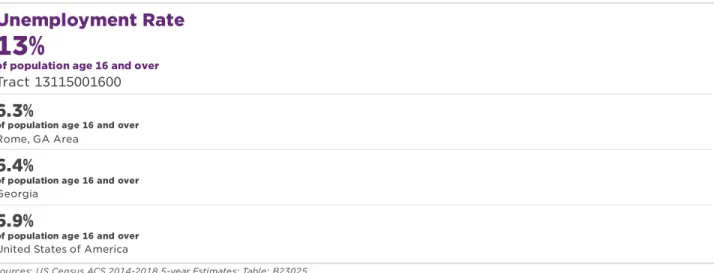
Unemployment Rate
The unemployment rate is the estimated percent of civilians (non-military) residents, above the age of 16, who are participating in the labor force but unemployed. It's an important measure of the population's engagement with the labor market and the availability of jobs that fit the skills and abilities of local residents.
A higher unemployment rate has a negative effect on a census tract's overall Economic Security Outcome index score.
Unemployment Rate
Sources: US Census ACS 2014-2018 5-year Estimates; Table: B23025
13%
of population age 16 and over
Tract 13115001600
6.3%
of population age 16 and over
Rome, GA Area
6.4%
of population age 16 and over
Georgia
5.9%
of population age 16 and over
United States of America
Sources: US Census 1990; Table: P07, 2000; Table: B043, 2010; Table: B23; US Census ACS 2014-2018 5-year Estimates; Table: B23025. The number of census tracts represented here reflects the number chosen when creating this dashboard.Projections are calculated using a modified linear regression over the years: 1990, 2000, 2010, and the most recent 5-year ACS estimate and should be interpreted with caution.
Census Tract Comparison: Unemployed Population
Pe op le a g e 16 a nd o ve r Tract 13115001600 1990 1995 2000 2005 2010 2015 2020 2025 100 150 200 250 300 350 400 450
In this area in 2014-2018, the Census estimates that people were employed in the following industries:
Employment by Industry People Employed Percent Employed in this Industry Percent Employed in this Industry in Georgia Accommodation and Food Services
Industry Employment 68 9.62% 7.83%
Administrative and Support and Waste Management Services
Industries Employment 28 3.96% 4.78%
Agriculture, Forestry, Fishing and Hunting
Industry Employment 0 0% 0.98%
Arts, Entertainment, and Recreation
Industries Employment 30 4.24% 1.59%
Educational Service Industry Employment 26 3.68% 9.28%
Finance, Insurance, Real Estate and Rental and Leasing
Industries Employment 42 5.94% 6.21%
Health Care and Social Assistance Industry Employment 131 18.53% 11.55%
Information Industry Employment 14 1.98% 2.39%
Manufacturing Industry Employment 155 21.92% 10.62%
Management of Companies and Enterprises
Industry Employment 0 0% 0.12%
Other Services Industry Employment 29 4.1% 4.88%
Professional, Scientific, and Technical Services
Industry Employment 6 0.85% 7.13%
Public Administration Employment 0 0% 5%
Retail Trade Industry Employment 90 12.73% 11.71%
Construction Industry Employment 45 6.36% 6.62%
Transportation and Warehousing, and Utilities Industries
Employment 43 6.08% 6.41%
Wholesale Trade Industry Employment 0 0% 2.79%
All Other Industries Employment 0 0% 0.12%
Source: Census Data aggregated by:
2014-2018 Data Contains: 2 Census Block Groups
Crime:
The crime rates per 100,000 persons in the Census Place and county in which the study area is located, as reported by the FBI's Uniform Crime Reports, are as follows. Data was reported by the FBI for selected Census Places and counties, so data may be unavailable for your study area.
Crime Rates per 100,000 persons 2013 2014 2015 2016 2017
County (Floyd)
Aggravated Assault 262.17 242.74 223.63 222.98 254.4
Burglary or Larceny 3,813.9 4,007.79 3,044.55 2,726.61 2,358.84
Motor Vehicle Thefts 189.34 218.78 209.07 194.98 148.91
Murder 4.16 4.17 11.44 5.19 5.17
Rape 27.05 21.88 38.49 28 16.55
Robbery 81.15 80.22 76.97 71.56 39.3
Source: FBI UCR & DOJ
22
Sources: Longitudinal Employer-Household Dynamics (LEHD) Origin-Destination Employment Statistics (LODES) Version 7.3
Jobs by Sector
of total jobs 3.5% 3.5% 3.5% 10.6% 10.6% 10.6% 0% 0% 0% 0% 0% 0% 1.4% 1.4% 1.4% 27.1% 27.1% 27.1% 2.3% 2.3% 2.3% 18.5% 18.5% 18.5% 0.2% 0.2% 0.2% 0% 0% 0% 10.3% 10.3% 10.3% 0% 0% 0% 17.1% 17.1% 17.1% 0.1% 0.1% 0.1% 0% 0% 0% 0.1% 0.1% 0.1% 5.4% 5.4% 5.4% 3% 3% 3% 0% 0% 0% 0.4% 0.4% 0.4% 10.3% 10.3% 10.3% 4.8% 4.8% 4.8% 0.3% 0.3% 0.3% 0.7% 0.7% 0.7% 2.3% 2.3% 2.3% 7.6% 7.6% 7.6% 1.8% 1.8% 1.8% 22.8% 22.8% 22.8% 2% 2% 2% 0.1% 0.1% 0.1% 16.9% 16.9% 16.9% 0% 0% 0% 2.3% 2.3% 2.3% 2.1% 2.1% 2.1% 5.1% 5.1% 5.1% 1.1% 1.1% 1.1% 13% 13% 13% 2.3% 2.3% 2.3% 0.6% 0.6% 0.6% 3.8% 3.8% 3.8% Accommodation and Food ServicesAdministrative Support and Waste Management Agriculture, Forestry, Fishing, Hunting Arts, Entertainment and Recreation Construction Educational Services Finance and Insurance Health Care and Social Assistance Information Management Manufacturing Mining, Oil and Gas Other Services Professional, Technology and Science Public Administration Real Estate Retail Trade Transportation and Warehousing Utilities Wholesale Trade
0% 2.5% 5% 7.5% 10% 12.5% 15% 17.5% 20% 22.5% 25% 27.5%
Tract 13115001600 Rome, GA Area
Sources: County Business Patterns (CBP) 2017. Establishment counts represent the number of locations with paid employees at any time during the year. (Source: https://www.census.gov/programs-surveys/cbp/about/glossary.html)
Size of Business Establishments
Es ta b lis hm en ts 1 to 4 Employees 5 to 9 Employees 10 to 19
Employees Employees20 to 49 Employees50 to 99 Employees100 to 249 Employees250 to 499 Employees500 to 999 1000 or moreEmployees 0 25,000 50,000 75,000 100,000 125,000
Floyd County, GA Rome, GA Area Georgia
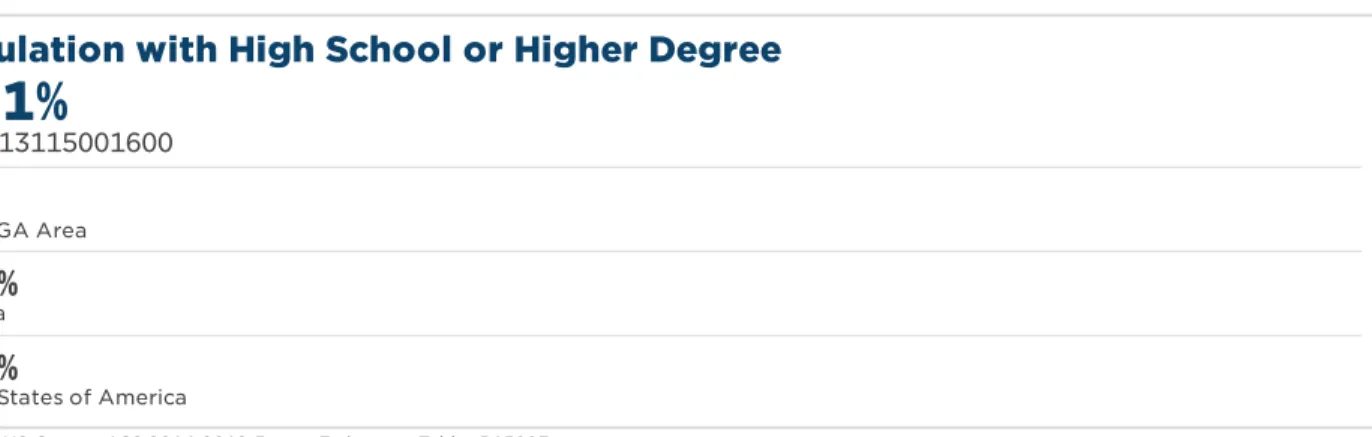
Adults with a High School Diploma or Higher
This measure assesses the share of adult residents who have earned a high school degree or equivalent. A high school degree opens up job opportunities and leads to better pay and potential for career advancement.
A high rate of adults with a high school diploma has a positive effect on a census tract's overall Education Outcome index score.
Population with High School or Higher Degree
Sources: US Census ACS 2014-2018 5-year Estimates; Table: B15003
64.1%
Tract 13115001600
81%
Rome, GA Area86.7%
Georgia87.7%
United States of America
Census Tract Comparison: Population with High School or Higher Degree
Tract 13115001600 64.1%
Rome, GA Area 81%
Sources: US Census ACS 2014-2018 5-year Estimates; Table: B15003
Sources: US Census 1990; Table P057, 2000; Table: P037, 2010; Table: B15; US Census ACS 2014-2018 5-year Estimates; Table: B15003. The number of census tracts represented here reflects the number chosen when creating this dashboard.Projections are calculated using a modified linear regression over the years: 1990, 2000, 2010, and the most recent 5-year ACS estimate and should be interpreted with caution.
Census Tract Comparison: Adults with Highest Highest Educational Attainment High School Diploma
Pe op le o ve r ag e 25 Tract 13115001600 1990 1995 2000 2005 2010 2015 2020 2025 600 625 650 675 700 725 750
Adults with Some College or Bachelor's Degree or Higher
This measure assesses the share of adult residents who have attended college and/or earned a degree. Increasingly a minimum requirement to access many jobs, such as those in the health care sector, a college degree can be one pathway toward economic mobility.
A high rate of adults with some college or bachelor's degree has a positive effect on a census tract's overall Education Outcome index score.
Some College or Educational Higher Attainment
Sources: US Census ACS 2014-2018 5-year Estimates; Table: B15003
30.9%
of population over age 25
Tract 13115001600
47.9%
of population over age 25 Rome, GA Area
58.8%
of population over age 25 Georgia
60.5%
of population over age 25 United States of America