AUTHORS
Moritz Paulus* Katharina GravePD Dr Dietmar Lindenberger
EWI Working Paper, No 10/2011
Institute of Energy Economics at the University of Cologne (EWI)
www.ewi.uni-koeln.de
The authors are solely responsible for the contents, which therefore do not necessarily represent the opinion of EWI.
* Corresponding author
A methodology to estimate security of supply in electricity generation:
results for Germany until 2030 given a high level of intermittent
1
A methodology to estimate security of supply in electricity
generation: results for Germany until 2030 given a high level of
intermittent electricity feed-in
1*Institute of Energy Economics at the University of Cologne (EWI), Vogelsanger Str. 321, 50827 Cologne, Germany
ABSTRACT
In this paper, we develop a methodology for deriving a consistent measure for supply adequacy in the power generation sector. We especially consider the secured generation capacity of intermittent renewable energy sources such as wind. Availability of conventional power plants is estimated through stochastic convolution of unscheduled non-usabilities. We employ our methodology to measure supply security in Germany until 2030. A detailed market analysis of power plants that are currently being built or planned provides support to our analysis for the short term. For the long term, we rely on a large-scale dispatch and investment model of the European power sector to account for the embedding of the German electricity sector in the European market. We analyze two scenarios: one with prolongation of nuclear power plants and one with a nuclear phase-out. Our results show that, even though intermittent renewables only provide very limited secured generation capacity, security of electricity supply in Germany can be assured until 2015. In the long term, the need for backup capacity for renewable energy sources increases as well as the need for electricity imports.
Keywords: Supply adequacy, integration of renewable energy sources, power
generation, German power sector, secured generation capacity
JEL classification: Q40, Q21, C61, L94
ISSN:1862–3808
1
The paper is based on a study of the Institute of Energy Economics at the University of Cologne, funded by the German Federal Ministry of Economics and Technology (BMWI) which assessed German electricity supply security in the short- and mid-term.
2
INTRODUCTION
The liberalization of electricity markets sparked an intense discussion about the future of security of supply. Intermittent electricity generation from renewable sources is increasing the challenge. Many have sought to determine whether electricity markets will be able to provide a reliable and secure supply of electricity, even in the case of a high share of intermittent feed-in. In this paper, we analyze the contribution of different electricity generation technologies to overall supply security. Based on these results, we assess the cost-efficient structure of generation capacity in future electricity markets.
Security of supply encompasses all links of the value chain of electricity supply, including provision of energy fuel resources, the generation of electric energy, distribution of electric energy, and trading and retail. Security of supply is given if “consumer demand for electric energy is covered today and in the future in an uninterrupted and sustainable manner” (EWI and Consentec, 2011). The concept can be divided into different dimensions: especially during peak hours, “the ability of the electric system to withstand sudden disturbances” characterizes the reliability of supply. A short- to medium-term issue is firmness, defined as “the ability of the already installed facilities to supply electricity. In this paper our methodology focuses on the “ability of the electric system to supply the aggregated electrical demand and energy requirements of costumers at all times, taking into account scheduled and reasonably expected unscheduled outages of system elements” which is referred to as capacity adequacy (Batlle and Rodilla, 2010).
Based on the given requirements for the security of supply, stated by the European network of transmission system operators for electricity (ENTSO-E, 2009), we develop a methodology to estimate the adequate capacity for a defined region. The methodology is applied to the German electricity system. The market is characterized by a comparatively high share of intermittent wind and solar power. The results of this analysis reveal the challenges to securing supply adequacy in the mid-term future and until 2030.
The first section provides an overview about different concepts related to “security of supply” in existing literature. In the following section the proposed methodology of assessing the adequacy of supply is explained. The method is then applied to the example of Germany. The last section concludes the analysis.
3
LITERATURE
Supply adequacy in electricity markets is defined by ensuring sufficient capacity investment in the medium to long-term. Roques (2008) separates it further into three dimensions as follows
• Ensuring an optimal level of overall generation capacity at the equilibrium consistent with socially optimal system reliability design criteria;
• Ensuring an optimal timing of investment minimizing fluctuations of installed generation capacity due to power plant investment cycles and the impact of transitory adjustment periods on security of supply;
• Ensuring an optimal mix of different generation technologies, both in terms of load profile (mix of base load and peaking units) and in terms of fuel mix. The higher the fluctuation in the market, the higher is the need for peaking plants and additional flexibility provided for example by storages or demand side management (Nicolosi, 2010; Paulus, 2011). Therefore, the main challenge in assessing capacity adequacy is determining the secured capacity of renewable energy sources. Their in-feed is driven by meteorology and varies over time. The growing number of wind farms especially challenges the concept of capacity adequacy. For long-term planning, the concept of capacity credits was developed. A capacity credit is the share of total installed capacity that is available for electricity generation at a certain level of confidence. Analyzing different studies about wind capacity credits, Giebel (2005) states that first of all, wind has a capacity credit, although there are times with no or very low in-feed. This credit changes with the penetration of wind power; it is around the mean wind power output for small penetrations of wind power in the grid and drops to a value near the minimum wind power generation for larger penetrations.
Another parameter is the geographical distribution of wind turbines; a large number of farms disseminated over a large geographical area would provide more reliable electricity supply (Boccard, 2008) if wind speeds in such regions are not positively correlated. In this case, wind generation levels in different regions can partly compensate for each other. Grothe and Schnieders (2011) analyze this effect of increasing wind supply reliability for Germany. They apply copula theory to determine
4
the value at risk of energy production for given allocation sets of wind farms and derive optimal allocation plans.
MacCormack et al. (2010) analyze the impact of large-scale integration of wind generation operating in a deregulated market on prices and on reliability of supply. This study showed that, during a transition period, increased penetration of wind generation can lead to lower electricity prices and increased reliability of supply. But average costs of conventional production increase as the capacity factor declines. In the example of Germany, Weigt (2009) analyses historical data from 2006 to 2008. For his calculation, the lower boundary of the capacity credit is only about 1%. Taking into account the actual generation of electricity during peak load times, the credit rises to 15%. Another recent analysis of the German market, Dena (2008), reveals a capacity credit of wind energy of between 5% and 10% of installed capacity during annual peak load, depending on the amount of installed on- and offshore wind capacity. With increasing targets for renewable energy sources on liberalized markets, capacity adequacy is highly relevant for legislation of electricity markets. In the European Union, the member states have to deliver a monitoring report on their security of supply in electricity markets every two years (2003/54/EC). In addition to grid issues, adequacy of generation capacity is also part of these reports. The main results and methodology developed in this paper are based on the analysis underlying the last monitoring report of the German Federal Ministry of Economics published in 2011 (BMWI, 2011).
This paper expands on the existing literature in three ways: Firstly, we describe a quantitative methodology to assess the amount of reliable conventional and renewable capacity in an integrated way. Secondly, we develop a procedure on how to evaluate short-term and long-term supply adequacy based on the aforementioned assessment of reliable capacity using a large-scale power system planning model. Thirdly, we empirically test our methodology to assess long-term supply adequacy in the German power sector with endogenous capacity additions under a least-cost regime.
METHODOLOGY
Security of supply in electricity generation can be measured by so-called generation capacity balances (ENTSO-E, 2009). A capacity balance allows for a general
5
overview of electricity peak demand and the contribution of each energy source to cover that demand. Capacity balances are time invariant instruments and are therefore static in their nature; a balance can be compiled for one single or several points in time during each year. To secure adequate supply in electricity generation, the total available generation capacity has to be at least as high as electricity demand for the investigated period of time.
To estimate the total available generation capacity at a single point of time, we develop the notion of secured capacity. Secured capacity results from a stochastic convolution of several probabilistic distributions on the availability of each type of generation capacity. The computation of secured capacity of a given power plant fleet is carried out in two steps: Firstly, the density function of secured capacity of the conventional power plant blocks is calculated by a convolution of the conditional (empirical) non-usabilities of all conventional power plant blocks2. Secondly, the density function of secured capacity of the conventional power plant is convoluted with the empirical wind feed-in density functions. This results in the inclusion of renewable energies in the density function of the complete generation fleet. The increase of the total secured capacity of the generation fleet by including RES-E can be approximated as secured capacity of renewable energies (which we will hereafter refer to as "capacity credit").
We model hourly demand deterministically by applying country-specific load profiles that respect seasonal, daily and hourly demand characteristics. (Annual) peak demand is then defined by the hour to which the load profile assigns the highest electricity demand in a year.
In the scope of our assessment of supply adequacy, we consider that power imports do not contribute to secured capacity. This means that supply adequacy on a national level is always provided through the domestic generation fleet only.3
Model description
For the thermal power plant fleet, we may assume that unscheduled, non-disposable events that induce non-usability of power plants are mutually independent. The
2
A similar concept of convoluting several independent density distributions has been used by Brückl (2006) to estimate balancing power requirements in Germany.
6
probability and the size of non-available thermal power plant capacity are determined by a stochastic convolution of non-availability probabilities of each single thermal power plant block. We therefore assume that we can sufficiently describe the state for each thermal block through maximum capacity feed-in, unscheduled power plant outage and power plants in revision. To each thermal power plant block that is not in revision we assign a probability p, with which the block generates electricity at maximum capacity, and a probability (1-p) of an unscheduled non-usability4. The cumulated joint probability distribution that results from the convolution of the non-availability distributions of each single thermal block defines the secured capacity of the thermal generation fleet, which is at least available during annual peak electricity demand given a certain confidence level.
In contrast to thermal capacities, non-availabilities of renewable energy sources show regional patterns. The most important renewable energy sources of intermittent feed-in are wfeed-ind and solar energy. Wfeed-ind energy can substitute significant amounts of conventional energy generation, but thermal power plant capacity may be further required to back up peak-load demand (Dena, 2008). Solar energy generation can also substitute conventional energy generation, but secured capacity is 0% during hours of darkness.5
In calculating the secured capacity of intermittent renewable source we concentrate on wind energy. Wind energy feed-in may be reduced during the time of annual peak demand. Secured capacity of wind energy is influenced less by unplanned technical non-availabilities but more by non-availabilities induced through wind yield. This implicates that non-availability probability distributions of individual wind power plants are correlated and not independent. However, portfolio effects, which arise from a regional distribution of wind power plant sites, have to be taken into account (Boccard, 2008). Availability of the aggregated wind generation fleet can be simulated on the basis of historical wind energy feed-in levels. To determine the secured capacity of the total power plant fleet, the joint probability distribution of the thermal fleet and the wind fleet is generated by stochastic convolution, thereby assuming that unplanned non-availabilities of thermal plants and of wind plants are independent.
4
For thermal power plant blocks, we abstract from partial outages. 5
7
Figure 1: Concept of secured capacity
The stochastic distribution shows how much generation capacity is statistically available, given a certain confidence or security level, at a certain point of time. For example, Figure 1 shows a confidence level of 99%. The reference hour for the capacity balances is the hour with the annual peak load. In all of the other 8,759 hours of the year, electricity demand is lower, and therefore the security level will be even higher.
This analysis focuses on the national electricity market and omits the interaction between regions. In reality, imports might enhance the security of supply significantly. Another additional securing factor is the market for ancillary services. Depending on the national grid code, a specific number of plants are contracted to be available for positive reserve power. In times of missing generation, these plants have to be ramped up at high speed and provide additional supply for up to one hour.
In order to measure security of supply, detailed information about the power plant fleet are essential, not only about the existent capacities, but also for the future. The temporal horizon of the outlined security of electricity generation analysis is 2030. Uncertainty regarding power plant commissioning and decommissioning increases the further as we move further away from the base year. Conversely, changes in the
100h 0 c d a b Probability in % g f e C a p a ci ty
a: installed thermal power plant capacity
b: planned available thermal power plant capacity
c: secured capacity of the thermal power plant fleet
d: secured capacity of the thermal power plant fleet and of the wind generation fleet
e: secured capacity of the wind generation fleet (capacity credit of wind)
f: reserve for unplanned non-availabilities of the thermal power plant fleet
g: thermal power plant fleet in planned revisions
h: security of supply level (h=99%) Probability function for secured capacity of the thermal
power plant fleet
Probability function for secured capacity for the thermal power plant fleet and the wind generation fleet
8
generation fleet in the next years can be fairly accurately estimated by investigating current power plant projects and the age structure of the existing power plant fleet. We therefore structure our analysis into two temporal disjunctive time periods: until 2015 and between 2015 and 2030.
Short-term analysis
Until 2015, all potential changes of the generation fleet can to a very large extent be estimated ex ante. The process from investment decision to start of production takes years. Depending on the technology, the legal permission to generate electricity requires proofs and documents; in addition, the citizens have to be informed about the projects. In order to provide a conservative approximation of short-term changes in the power plant fleet, the status of announced power plant built-ups and decommissions can be assessed. For this purpose, current power plant projects are weighted with implementation probabilities. These probabilities are based on a classification of the individual projects regarding their planning or completion stage. Power plants in construction are expected to start production within a five-year period, providing the announced generation capacity. Planned installations that passed the legal procedure are likely to be built, but changes in the political or economic framework can still stop the projects. Depending on the surrounding market, their announced capacity is multiplied with a probability factor. The process of admission itself is a costly and time-consuming procedure. Announced projects that are undergoing this process can also be included in the estimation of additional capacity, weighted with a lower factor. The probability for projects to enter one of these three stages depends on the country and can be approximated using historical data.
Estimations for the long-term
From the classification of announced projects, we are able to deduct an estimated power plant fleet change, which is then incorporated in the model-based analysis. In this way, we are able to assess if current power plant projects provide secure electricity generation for the next five years, or if additional measures are required to guarantee electricity generation security.
9
After 2015, new installations (that are not yet announced) are expected to enter the market. For the period of 2015 to 2030, we identify the required capacity commissioning by using an integrated model of the European electricity market. We take the perspective of a social planner following the concept of capacity adequacy as a public good (Finon and Pignon 2008).
The computer-based Dispatch and Investment Model for Electricity Markets in Europe (DIME) is used to provide long-term projections. Results of the linear optimization model serve as investment decision scenarios as well as optimized dispatch scenarios for spot and reserve markets. The model minimizes the total costs of the liberalized European power generation market. It considers all EU-27 countries. On the supply side, more than 100 power generation technologies are modeled endogenously, including fossil fuels, nuclear energy, and pumped storage hydroelectricity, representing some 85% of net power production. These technologies are subdivided into vintage groups to reflect technological progress in, for example, energy efficiency and durability. Future technology improvements are implemented in the form of learning curves.
Simulations can be made in five-year intervals up until 2070. Each year comprises four seasons, each of which is modeled with three days: Saturday, Sunday, and a working day. Beyond that, the days can be displayed in intervals of 24 hours, allowing for a total temporal resolution of 288 load points for each period.
The input parameters on the supply side of the model are based on detailed databases containing information on installed capacities of different power plant types in the different regions of the model as well as detailed technological and economic parameters. The outcomes of the first level of the analysis are implemented as exogenous capacity additions in the model.
On the demand side, input data includes the residual electricity load. The generation of run-off-river plants, solar energy and all other renewable energy sources are exogenously treated. The distribution of each technology’s yearly generation is represented by the typical hourly generation structure variations derived from historical data. For wind energy, a more detailed approach is chosen to reflect its intermittent character. Wind energy generation is processed based on average historic feed-ins and a random component, causing deviations from the expected level. Electricity generation of all exogenous generation technologies is deducted
10
from total gross electricity demand. This residual demand has to be covered by conventional power plants.
For every forecasting horizon the model delivers closure and extension of capacity of respective technologies, fuel consumption, carbon dioxide emissions and production costs. Marginal prices of the different technologies, power storage capacities and transmission costs determine the optimal dispatch. Price estimates for future electricity markets can be based on the shadow prices of demand. The model assumes peak-load pricing to recover investment costs. For a more detailed description see Bartels (2009).
The simulations for this time interval do not answer the questions of whether security of electricity generation is warranted but highlight possible answers regarding how annual peak load demand may be covered in a cost-minimal way in the future. This approach is reasonable, as there is still enough lead time available to have market-driven investments into generation capacity.
APPLICATION
The methodology is applied to the German electricity market. It is characterized by a growing share of intermittent electricity generation as well as high political uncertainty. The German government supports RES-E technologies; in particular, the share of electricity generation by wind and sun is growing exponentially and is expected to grow similarly in future.
0% 2% 4% 6% 8% 10% 12% 14% 16% 18% 0 10.000 20.000 30.000 40.000 50.000 60.000 70.000 80.000 90.000 100.000 1 9 9 0 1 9 9 1 1 9 9 2 1 9 9 3 1 9 9 4 1 9 9 5 1 9 9 6 1 9 9 7 1 9 9 8 1 9 9 9 2 0 0 0 2 0 0 1 2 0 0 2 2 0 0 3 2 0 0 4 2 0 0 5 2 0 0 6 2 0 0 7 2 0 0 8 2 0 0 9 S h a re o f R E S -E i n e le ctr ic ity c o n su m p ti o n R E S -E g e n e ra ti o n [ G W h ] Geothermal Photovoltaic Biomass Wind Water Share of electricity consumption
11
Figure 2: Development RES-E generation according to BMU/BMWI, 2010
The German law guarantees the priority feed-in of RES-E. The implementation of this law in the year 2000 triggered massive investment in green technologies. Figure 2 shows the rapid growth of RES-E generation since that year.
The electricity generated in wind turbines and solar panels has to be integrated into the electricity system before other sources of electricity may be used. The only exceptions are times of transportation shortages in the grid. Compared to conventional fossil fuel power stations, the generation of electricity by renewable energy sources is not easily predictable, especially long-term (Weigt, 2009).
In contrast to the volatile feed-in from renewable sources, the German power plant fleet is to a substantial extent based on rather inflexible technologies like lignite and nuclear power. In 2009, nearly 23% of the German electricity generation was provided by nuclear power plants; about 43% of the electricity is generated by coal and lignite plants.
Taking into account the probabilities for non-usabilities of the given technologies (VGB, 2006) and the capacity credit for RES-infeed, adequacy of supply was given on a confidence level of 99%. As also described in Dena (2008), this high level of security was derived from former studies and experiences.
The future development of generation capacity in the short and long term is subject to high political uncertainty, especially in the case of nuclear power plants. With the “Atomausstiegsgesetz” in 2002, the German government decided to close down the plants before the end of their technical lifetime. In 2010, this decision was changed, extending the nuclear electricity generation up to 2036. After the release of radioactivity in the nuclear power plants in Fukushima, Japan, the government reacted by reconsidering their decision about the extension of the plants’ lifetime. Therefore, two projections of possible developments of the German power plant fleet are compared in this paper: Firstly, a nuclear phase-out scenario, secondly, a prolongation scenario for nuclear power plants..
[Phase-out scenario:] German nuclear power plants phase out
according to the federal legislation as of 2009 [16]. The runtimes of existing nuclear power plants result from the currently remaining
12
nuclear energy accounts which are publicly available (BfS, 2011) and an assumption on future full load hours of nuclear power plants.
[Prolongation scenario:] In this scenario runtimes of nuclear power
plants are prolonged by 20 years, compared to the nuclear phase-out scenario. The prolongation of run times leads to additional costs for retro-fitting of 500 €/kW (Prognos and EWI, 2007).
The scenario setup therefore does not yet account for the final closure of the seven oldest nuclear plants in June 2011. However, these oldest plants would have been shut down under the phase-out scenario within the coming three years, as their nuclear energy accounts were almost depleted. Therefore, the phase-out scenario in 2015 also reflects the recent shut-down decision and may serve as an up-to-date estimate of supply adequacy.
Table 1: nuclear power generation capacity in the scenarios
Dimension 2008 2010 2015 2020 2025 2030 Prolongation
[MW] 20414 20414 20414 20414 20414 14228
Phase-out 20414 19247 13338 6692 1329 0
The analysis of the other thermal power plants is based on a detailed power plant database available at the Institute of Energy Economics at the University of Cologne. The database contains information on individual thermal power plant blocks, with more than 5 MW of installed capacity. For Germany, more than 900 blocks are registered, and for the whole of Europe, information on more than 3000 thermal blocks is available.
The database also provides estimation on conventional generation capacity, which will come online until 2015. The estimate is computed by weighting each power plant project with regard to its realization probability. The computed estimate is shown in Table 2 together with a reference figure from BDEW (2010).
13
Table 2: Assumptions on new conventional generating capacity until 2015
Assumptions on unplanned, non-disposable non-availabilities are differentiated by generation technology and are based on VGB (2006). They typically range from 1.8% to 4%. In addition to actual outages, non-availabilities caused by administrative decisions are also accounted for in the data. Table 3 in the appendix depicts non-availability probabilities for the main thermal generation technologies.
The probability distribution of seasonal wind energy feed-in is based on the data for every quarter of an hour, which are drawn from Dena (2008). They are based on an outlook of regional allocation (onshore and offshore) of wind generation plants, thus altering the projected future wind energy feed-in distribution, as offshore wind plants will generate more full load hours than onshore plants.
For the analysis of secured capacity in Germany in the long run, we assume a moderate increase of electricity demand in Germany until 2030 by 2.8%. Peak demand is assumed to increase by the same rate.6 Gross electricity demand increases in our analysis from 616.6 TWh in 2008 to 633.9 TWh in 2030. Although efforts to reduce energy intensity will increase and are publicly supported (BMWI and BMU 2010), there exists the possibility that because of continuing electrification (e.g., heat pumps, IT, automation, and E-mobility), energy savings will be negatively overcompensated. We consciously take this more conservative assumption in order to come to reach robust results regarding our security of supply analysis. Electricity demand assumptions for other European countries are taken from EURELECTRIC (2008).
6 In the period 2004 to 2009, evolution of peak demand is correlated with evolution of total demand by more
than 0.9 (ENTSO-E 2004-2009).
all figures in MW Lignite Hard coal Natural gas Misc Total
BDEW (2010) 3500 12081 9813 298 25692
own analysis 3600 13953 7966 365 25884
whereof:
-in construction (100%) 2940 7403 2376 250 12969
-authorized (66%) 0 0 0 85 85
-in authorization process (33%) 0 3800 2027 30 5857
-planned (0%) 660 2750 3563 0 6973
14
Scenario assumptions for installation of RES-E capacities and feed-in are based on Nitsch and Wentzel (2009) and depicted in the appendix in Table 4. Total RES-E feed-in will therefore increase from 92.9 TWh in 2008 to 270.5 TWh in 2030.
Fuel price assumptions for the investment analysis until 2030 assume a significant increase of natural gas and oil by approximately 60% until 2030. Prices for hard coal delivered to power plants increase more moderately by 25%. Table 5 in the appendix lists assumptions on fuel prices in greater detail.
Model results for the case of Germany
Peak demand in Germany is expected to take place between 6 and 7p.m. on an evening in winter (ENTSO-E, 2009). Given this time, the convolution of probabilities for unscheduled non-usabilities of power plants and the growing share of electricity generation from renewables shows the given security of supply in the German electricity market: Excess secured capacity amounts to more than 5 GW. The secured capacity even increases between 2010 and 2015, mainly because of the currently observable expansion of the thermal power plant fleet, with conservative estimates lying in a range of 15 GW of additional capacity until 2015. This also means that, even in the case of a phase-out of nuclear power plants, enough generation capacity will be available to statistically secure peak demand until 2015. The DIME-based development of the generation fleet in the long run takes into account that peak load has to be covered for all periods. The cost minimization leads to a melt-off of secured capacity that exceeds annual peak load until the end of the modeled horizon. It is clearly observable that, in the phase-out scenario, the amount of secured capacity clearly exceeds annual peak demand until 2015. In the
prolongation scenario, results regarding overall secured capacity almost match
figures of the phase-out scenario. Secured capacity clearly exceeds annual peak load. In this scenario, 6 GW of older thermal generation capacity, mostly gas-fired power plants, are decommissioned before reaching their actual technical lifetime. This happens due to the abundance of available cheaper or more efficient generation capacity (nuclear and new thermal plants), which also contributes to peak load coverage. Along a similar rationale, as in the phase-out scenario, excess secured capacity is adjusted exactly to peak annual demand in the long term, due to the cost efficiency.
15
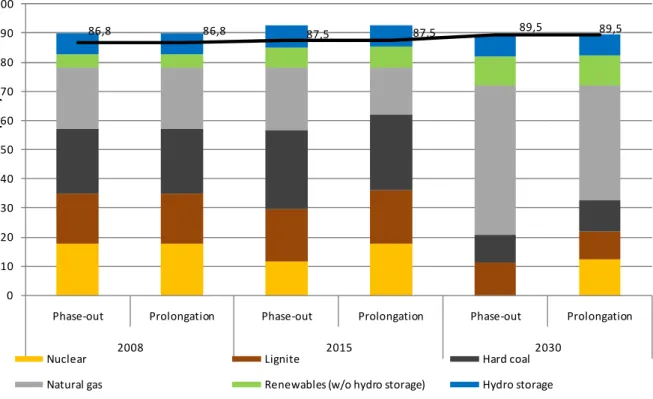
The contribution of peak load generation technologies (mostly OCGT) to overall secured capacity increases significantly until 2030. Contribution of gas-based capacity increases from 23% in 2008 to 44% in 2030. These power plants face very low utilization levels in 2030 and mostly even out the intermittent feed-in of renewable energy sources. Secured capacity based on renewables increases to 10.1 GW in 2030, therefore almost doubling their contribution to peak load coverage. Nevertheless, their relative contribution remains fairly low at 11.3%. The main reason for this relatively low contribution is the capacity credit of wind and solar energy. The capacity credit of wind according to our calculations lies between 5.2% and 6.2% of total installed wind generation capacity7 for the modeled time period during the hour of annual peak demand. The capacity credit for photovoltaics is 0%, as the annual peak demand in Germany typically takes place on a winter evening.
Figure 3: Development of the secured capacity until 2030
7
The capacity credit of wind increases from currently 5.2% to 6.2% at the end of the projection period. This is due to an increasing share of offshore wind in overall wind generation. Offshore windmills feature on average higher utilization and fewer hours with zero or close-to-zero wind feed-in compared to onshore windmills. 86,8 86,8 87,5 87,5 89,5 89,5 0 10 20 30 40 50 60 70 80 90 100
Phase-out Prolongation Phase-out Prolongation Phase-out Prolongation
2008 2015 2030 G W s e c u re d c a p a c it y
Nuclear Lignite Hard coal
Natural gas Renewables (w/o hydro storage) Hydro storage Annual peak load
16
The changes in the aggregated conventional generation capacity in Germany are similar in the phase-out and the prolongation scenario:
Capacity decreases from 99 GW in 2008 to approximately 92 GW in 2030 (cf Figure 3). Simultaneously, installed capacity for renewable energies, especially wind and solar energy, significantly increases according to Nitzsch and Wenzel (2009).
There is a strong increase of gas-fired power plants until 2030. As already mentioned, most of these additional plants mostly serve as cost-efficient option to deliver secured capacity to compensate for the growing importance of intermittent feed-in sources. Additional gas-fired capacity built-ups are slightly lower in the
prolongation scenario, as the nuclear power plants that are still available in this
scenario contribute to secured capacity demand.
In the prolongation scenario, 2 GW more of older hard coal-based generation capacity are decommissioned as compared to the phase-out scenario. The reason is that the longer runtimes of nuclear power plants have a dampening effect on electricity prices. This leads to the inability among older power plants to generate sufficient contribution margins to their fixed and maintenance costs and makes these plants cost inefficient.
Installed capacity of renewable energy sources increases strongly during the simulated time period and accounts for 53% of total installed capacity in 2030.
After accounting for decommissioning of older conventional power plants in the
prolongation scenario and avoidance of new commissions, total installed capacity is
17
Figure 4: Development of installed generating capacity until 2030
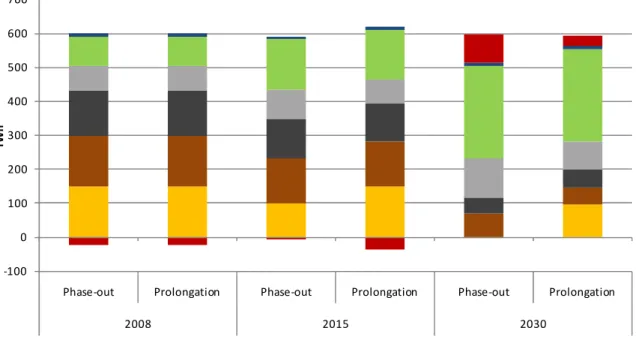
In both scenarios, the generation mix changes significantly until 2030. Based on our assumptions, renewable energy feed-in increases strongly; it increases from 90 TWh in 2008 to 270 TWh in 2030 (45% of net demand). The most important increases in RES-E feed-in occur for offshore wind (+84 TWh), onshore wind (+39 TWh) and photovoltaics (+21.7 TWh).
Fossil fuel generation decreases in both scenarios to 233 TWh and 186 TWh in the phase-out scenario and the prolongation scenario, respectively. The fuel mix also changes significantly: gas-based power generation increases from 12% in 2008 to 20% in the phase-out scenario in 2030. This increase of gas-based generation is mainly due to the need to replace lost nuclear power generation. As full load hours of conventional plants will decrease given a higher share of renewable feed-in, the logical solution in case new conventional generation capacity has to be built are gas power plants. Due to their lower capital costs, gas-fired power plants need less full load hours to recoup their investments. Also, the high flexibility of gas power plants regarding ramp-up and ramp-down parameters as compared to coal-based plants makes them especially suitable to cope with a high feed-in of certain energy sources. The advantage of costs and flexibility of gas-fired power plants along with GHG emission constraints leads to a reduction of hard-coal-based power generation from 23% in 2008 to 8% in the phase-out scenario in 2030.
0 20 40 60 80 100 120 140 160 180 200
Phase-out Prolongation Phase-out Prolongation Phase-out Prolongation
2008 2015 2030 G W i n st a ll e d c a p a c it y
18
In the prolongation scenario, the increase of gas-based generation is lower than in the phase-out scenario, since still more existing nuclear capacity is available to serve power demand. However, utilization of nuclear power plants is lower since increasing penetration of renewables reduces the requirement for base-load capacity.
Germany becomes a net importer in both scenarios beginning in 2020. The switch to a net importer is significantly more profound in the phase-out scenario. The most important reasons for this development is that neighboring countries (especially France but also countries in Eastern Europe) have the option of nuclear generation at their disposal, which results in an important increasing comparative cost advantage given increasing carbon emission constraints. However, these increased net imports do not endanger supply adequacy, as the model requires that always enough secured domestic capacity is available to cover peak demand (see p. 7). In both scenarios we assume a timely implementation of the TEN-E priority grid expansion projects in Europe. Under this assumption, net transfer capacities are high enough to cover the depicted net imports.
Figure 5: Development of power generation until 2030
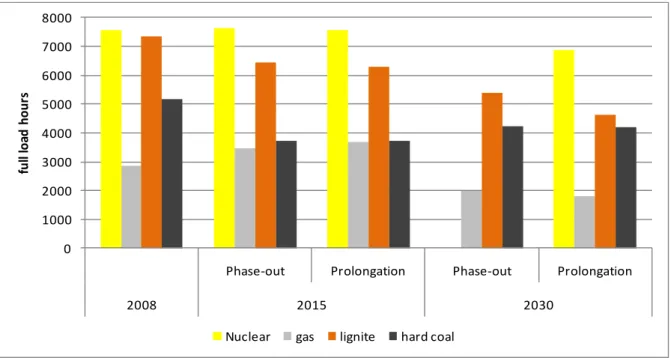
Utilization of conventional power plants is declining in both scenarios until 2030 (cf Figure 6). The main reason is the increasing intermittent feed-in of renewable energy sources, which leads to a steeper (and thus, for base-load generation, a more
-100 0 100 200 300 400 500 600 700
Phase-out Prolongation Phase-out Prolongation Phase-out Prolongation
2008 2015 2030
T
W
h
19
disadvantageous) load duration curve. The steeper load duration curve leads to lower demand for base-load generation, affecting especially lignite- and hard-coal-fired power plants. The decommissioning of old hard coal power plants, which previously mainly served as backup capacity leads to a slight increase of utilization in 2030.
Utilization of gas power plants in general is also declining slightly. However, the effects depend on the power plant technology: Open-cycle turbines mainly used to provide backup capacity for renewables during peak times see very low utilization in both scenarios - less than 1% in 2020 and 2030. Power plants in cogeneration mode decrease their full load hours from 4100 hours in 2020 to 3400 hours a year in 2030 in the prolongation scenario, while in the phase-out scenario the number decreases from 4300 to 3800 hours of utilization. In contrast, combined cycle turbines increase their utilization in the prolongation scenario from less than 1000 hours to about 2800 hours a year. In the phase-out scenario, the number increases from 2900 to more than 3400 hours a year.
Overall, these effects are more profound in the prolongation scenario, as fossil-based load generation has to compete with still available nuclear power generation.
Figure 6: Development of full load hours of thermal plants until 2030
0 1000 2000 3000 4000 5000 6000 7000 8000
Phase-out Prolongation Phase-out Prolongation
2008 2015 2030 fu ll lo a d h o u rs
20
CONCLUSION
Intermittent sources of renewable electricity feed-in gain more and more importance in the German electricity system. Thus, requirements related to flexibility of the conventional power plant fleet change. For policy makers, the question if security of supply can still be warranted in such a system becomes highly important. In the scope of this paper, we developed a methodology to measure security of supply in the electricity sector using the notion of secured capacity. In this way, we are able to consistently evaluate the contribution of renewable energy sources, especially wind and photovoltaic-based solar energy to system reliability. We structure our dynamic simulation in two time periods to account for power plants in construction or in planning as well as for the increased importance of the next five front years until 2015. In the second part of the analysis, we analyze how different energy sources may contribute to generation supply adequacy from 2015 to 2030 in a welfare-optimal way. For the analysis, we conduct scenario runs to respect uncertainty regarding the nuclear phase out of German power plants.
Two findings hold, regardless of runtime of German nuclear power plants: Firstly, adequacy of supply in German electricity generation is given at least until 2015. Power plants currently under construction or in the final planning stages will ensure that enough generation capacity is available to cover domestic demand with sufficient security level in every hour of the year. Excess secured capacity diminishes until 2030; however, lead times for this time horizon are long enough to ease possible bottlenecks by additional investments into generation capacity. Secondly, renewable capacities, especially when it comes to wind and photovoltaics, do not substitute conventional capacity in the same way as renewable energy feed-in substitutes conventional generation. To cover electricity demand until 2030 with sufficient confidence levels, a massive construction of gas-fired power plants, especially OCGTs, will be necessary. The actual utilization of these plants will be low. They mainly provide capacity for peak load. These findings yield implications for German energy policy makers: electricity market design will have to provide incentives to invest into generation capacity which will have low utilization in the future. The question of whether or not the current German market design is able to provide these incentives is subject to ongoing research and political discussion.
21
APPENDIX
Table 3: Non availabilities according to VGB (2006).
Table 4: Assumptions on renewable energy feed-in based on Nitzsch and Wenzel (2009). Power plants Unplanned, nondisponible non-availabilities Nuclear 3,0% Lignite 3,2% Hard Coal 3,8% CCGT 1,8% OCGT 3,0% Oil 1,8% Hydro storage 0,0% Pump storage 0,0% Dimension 2008 2010 2015 2020 2025 2030
Wind onshore installed capacity [GW] 23,9 26,8 30,5 32,9 35 37 Total feed-in [TWh] 40,4 47,7 57,9 66,1 73,7 79,5 Wind offshore installed capacity [GW] 0 0,2 2,5 9 15,8 22,7
Total feed-in [TWh] 0 0,4 7,5 30,2 56,1 83,9
Biomass installed capacity [GW] 4,5 5,3 6,8 7,9 8,2 8,7 Total feed-in [TWh] 27 32,1 42,7 50,7 47,1 49,4 Photovoltaics installed capacity [GW] 5,3 8,9 16,6 23,2 25,7 28,4
Total feed-in [TWh] 4,2 7 14,1 20,1 23 25,9
Run-of-river installed capacity [GW] 4,8 4,8 5 5,1 5,1 5,1 Total feed-in [TWh] 21,3 21,9 23,6 24,5 24,6 24,8 Geothermal installed capacity [GW] 0 0 0,1 0,3 0,6 1
22
Table 5: Fuel price assumptions (all Euro values are given as 2008 real values).
REFERENCES
Bartels, M., Cost efficient expansion of district heat networks in Germany, PhD
thesis, Faculty for Economics and Social Sciences, University of Cologne, 2009.
Batlle, C. and Rodilla, P., A critical assessment of the different approaches aimed to secure electricity generation supply, Energy Policy 38, pp. 7269-7179, 2010.
BDEW: Im Bau oder in Planung befindliche Kraftwerke, 2010.
BMWI, Monitoring-Bericht des Bundesministeriums für Wirtschaft und Technologie nach § 51 EnWG zur Versorgungssicherheit im Bereich der leitungsgebundenen Versorgung mit Elektrizität, BMWI (German Federal Ministry of Economics), Berlin, 2011.
Boccard, N., Economic properties of wind power: A European assessment, Energy
Policy 38, pp. 3232-3244, 2008.
Cost type Dimension 2008 2010 2015 2020 2025 2030
Nuclear Fuel and waste removal
[€2008/MW
ht h] 3,7 3,6 3,5 3,3 3,3 3,3
Hard coal fuel costs for power plants
[€2008/t] 66,3 69,1 73,3 77,5 80,2 83
Lignite
short run marginal costs
of plants [€2008/t] 11,1 11,1 11,1 11,1 11,1 11,1
Natural gas fuel costs for power plants
[€2008/MW
ht h] 18,7 20,1 22,2 24,2 26,8 29,4
Oil fuel costs for power plants
23
Brückl, O., Wahrscheinlichkeitstheoretische Bestimmung des Regel- und
Reserveleistungsbedarfs in der Elektrizitätswirtschaft, München, 2006.
Dena, Planning of the grid integration of wind energy in German onshore and offshore up to the year 2020 (Dena grid study), German Energy Agency (Dena), 2008.
ENTSO-E, System Adequacy Forecast 2009 – 2030, ENTSO-E, 2009. ENTSO-E, Statistical Yearbooks, ENTSO-E, 2004-2009.
EURELECTRIC, Statistics and prospects for the European electricity sector - 36th Edition EURPROG 2008. EURELECTRIC, 2008.
EWI and Consentec, Analyse und Bewertung der Versorgungssicherheit in der Elektrizitätsversorgung, report for the German Federal Ministry of Economics, 2011. Finon, D. and Pignon, V., Electricity and long-term capacity adequacy: The quest for regulatory mechanism compatible with electricity market, Utilities Policy 16, pp. 143-158, 2008.
Giebel, G., Wind power has a capacity credit a catalogue of 50+ supporting studies. Risø National Laboratory, Report, 2005.
Grothe, O. and Schnieders, J., Spatial dependence in wind and optimal wind power allocation: a copula based analysis. EWI Working Paper No. 11/05. 2011.
MacCormack, J., Hollis A., Zareipour, H. and Rosehart, W., The large-scale integration of wind generation: Impacts on price, reliability and dispatchable conventional suppliers, Energy Policy 38, pp. 3837-3846, 2010.
Nicolosi, M., Wind power integration and power system flexibility – An empirical analysis of extreme events in Germany under the new negative price regime, Energy Policy 38, pp. 7257-7268, 2010.
Nitsch, J., Wentzel, B., Langfristszenarien und Strategien für den Ausbau erneuerbarer Energien in Deutschland - Leitszenario 2009. German Federal Ministry for the Environment, Nature Conservation and Nuclear Safety (BMU), 2009. Paulus, M., Borggrefe, F., The potential of demand-side management in energy-intensive industries for electricity markets in Germany, Applied Energy 88, p. 432-441, 2011.
PROGNOS and EWI, Energy scenarios for the energy summit on behalf of the German Federal Ministry of Economics (BMWi), 2007.
24
Roques, F., Market design for generation adequacy: Healing causes rather than symptoms, Utilities Policy 16, pp. 171-183, 2008
VGB, Analyse der Nichtverfügbarkeit von Wärmekraftwerken 1996-2005. Tech. rep., VGB Powertech e.V., 2006.
Weigt, H., Germany’s wind energy: The potential for fossil capacity replacement and cost saving, Applied Energy 86, pp. 1857-1863, 2009.
ABOUT EWI
EWI is a so called An-Institute annexed to the University of Cologne. The character of such an institute is determined by a complete freedom of research and teaching and it is solely bound to scientific principles. The EWI is supported by the University of Cologne as well as by a benefactors society whose members are of more than forty organizations, federations and companies. The EWI receives financial means and material support on the part of various sides, among others from the German Federal State North Rhine-Westphalia, from the University of Cologne as well as – with less than half of the budget – from the energy companies E.ON and RWE. These funds are granted to the institute EWI for the period from 2009 to 2013 without any further stipulations. Additional funds are generated through research projects and expert reports. The support by E.ON, RWE and the state of North Rhine-Westphalia, which for a start has been fixed for the period of five years, amounts to twelve Million Euros and was arranged on 11th September, 2008 in a framework agreement with the University of Cologne and the benefactors society. In this agreement, the secured independence and the scientific autonomy of the institute plays a crucial part. The agreement guarantees the primacy of the public authorities and in particular of the scientists active at the EWI, regarding the disposition of funds. This special promotion serves the purpose of increasing scientific quality as well as enhancing internationalization of the institute. The funding by the state of North Rhine-Westphalia, E.ON and RWE is being conducted in an entirely transparent manner.