http://www.scirp.org/journal/cus ISSN Online: 2328-4919
ISSN Print: 2328-4900
A Method to Evaluate an Urban Area by Using the
Model That Calculates a Number of Facilities from
an Area and a Population
Noriaki Sakamoto
Faculty of Economics, Hosei University, Tokyo, Japan
Abstract
This paper presents 1) a new mathematical model improved from a conventional model that calculates a number of facility from an area and a population in a town and, 2) by using this model, a method to evaluate the enrichment (in other words, convenience or enough) of facilities in the town where many high-rise apartments have been built (the area is hereinafter referred to as the high-rise apartment town). The conventional model uses only a nighttime population, but this paper considers a daytime population in addition to the nighttime population. Also, there has not been the method to evaluate the enrichment of facilities in a town, but we can evaluate it using this model. We apply this method to 23 special wards in Tokyo and the high- rise apartment towns, the results prove the effectiveness of the proposed method.
Keywords
Facility Density, High-Rise Apartment, Urban Studies, Urban Environments, Mathematical Model
1. Introduction
Since around year 2000, many high-rise apartments have been built in the bay area in Tokyo, Japan. This paper describes this area as the high-rise apartment town afterward.
Mori (2015)finds that the town accepts many inhabitants, and Sakamoto(2016) reveals
that many offices (for example, Convenience store, Dry cleaning shop, Dentist’s office, Restaurant, Nursery, Kindergarten, etc.) are set up with the inhabitants moving in. Par-ticularly, we know that the increase in family increases the nurseries, and the increase in high-rise office building increases convenience stores and dentist’s offices. Figure 1
and Figure 2 show the result that Sakamoto (2016) investigated. The vertical axis of
How to cite this paper: Sakamoto, N. (2016). A Method to Evaluate an Urban Area by Using the Model that Calculates a Number of Facilities from an Area and a Population. Current Urban Studies, 4, 430- 439.
http://dx.doi.org/10.4236/cus.2016.44028
Received: October 6, 2016 Accepted: October 31, 2016 Published: November 3, 2016
Copyright © 2016 by author and Scientific Research Publishing Inc. This work is licensed under the Creative Commons Attribution International License (CC BY 4.0).
Figure 1 shows “the number of facility every type of business/population density”, and that of Figure 2 shows “the number of facility every type of business/population”. The horizontal axis of Figure 1 and Figure 2 is the division of Koto ward, Tokyo into four groups and three towns so that the number of inhabitants in each group or town be-comes nearly equal.
TOYOSU, SHINONOME and ARIAKE are the high-rise apartment towns. Figure 1
shows that there is more number of three kinds of facilities (convenience store, nursery and dentist’s office) in TOYOSU and ARIAKE than other towns, however, Figure 2
does not show this tendency. Figure 1 and Figure 2 prove the result that ARIAKE is higher in the ratio of facilities, however, it seems that TOYOSU and SHINONOME have more convenient public transportation, more shops, a larger population, etc., than ARIAKE sensuously.
This means that, in this way, we cannot evaluate the enrichment of facilities in the town, even if we look at the number of facilities by per population or a population den-sity. If we know the standard (or suitable) number of facility, we can compare the value of a town with that of other towns and understand the characteristic of the town quan-titatively. It becomes the knowledge of an urban policy or an urban study, and also helps the judgment whether a company opens a shop or an office.
We classify conventional studies in following 1) - 3).
1) About a facility location or its pattern: Balcik and Beamon (2008) consider facility location decisions for a humanitarian relief chain responding to quick-onset disasters.
Figure 1. The number of each facility (convenience store, nursery, dentist’s office) per popula-tion density.
Figure 2. The number of each facility (convenience store, nursery, dentist’s office) per population.
0 2 4 6
ra
tio
convenience store nursery dentist's office
0 1 2
ra
tio
Gastner (2011) studies about service establishments (e.g., post offices or gas stations) in the special cases where the population lives along a line (e.g., a road or a river). Andres
(2014)analyzes location patterns of retail and food establishments.
2) About the stations for Electric Vehicle or Fuel Cell Vehicle: Honma and Kurita
(2008) calculate the optimal number of hydrogen stations to the fuel cell vehicles.
Honma and Toriumi (2014), Wen, Laporte, Madsen, Norrelund, & Olsen (2014)
con-sider the problem of locating electronic replenishment stations for EVs (Electric Ve-hicles).
3) About a mechanical model which calculates a facility density from a population and an area: Stephan and Dorman (1985), Stephan (1998) present the mathematical model which calculates the total expenditure of facility (or office, shop, etc.) from the population of a data collection unit (e.g., a state) and its area. By minimizing this ex-penditure, the facility density (the number of facilities) providing a particular service to the population is obtained. Qian, Yang, Han and Ma (2012) calculate a facility density of post office, hospital, school and theatre using not the area data but only the tion data. A characteristic of this study is to consider an index coefficient of the popula-tion of the model according to the generapopula-tion and to consider GDP (Gross Domestic Product).
The studies 1) and 2) are different from our purpose. The study by Qian, Yang, Han
and Ma (2012) does not use an area, but we have already confirmed that there is a type
of business that cannot ignore an area. Therefore, this paper calculates the difference (Equation (1)) in every type of business by using a model of Stephan (1998)as a tool.
Difference = The number of the real facility
—The number of the facility which the mathematical model calculates (1) When the value of this difference is plus and big, there is more number of facilities than other towns. The negative value means (or indicates) less number of the facilities of the type of business in the town than other towns.
Here, when we use this model, it has the next problem. The population is greatly dif-ferent from nighttime to daytime. In other words, the nighttime population is the number of inhabitants, but the daytime population is the number of people who comes to work or study in the town. A customer varies according to a type of business. For example, if the type of business is B to B (business-to-business, between businesses, as opposed to between a consumer and a business), it applies to daytime population. If the type of business is B to C (business-to-consumer, the sale of goods or services directly to customers), it applies to nighttime population. There is also a business of both which is B to (B + C). As an example, a target of convenience stores (open 24 hours) is both the office worker and/or the student (daytime population) and the inhabitants (night-time population).
Summarizing the above, we consider the nighttime and/or daytime population in the model of Stephan (1998), and propose the method to evaluate a town by Equation (2). As an application example, we decide the parameter of the model in 22 special wards in Tokyo except Koto ward with the three high-rise apartment towns (TOYOSU, SHINONOME and ARIAKE). Tokyo has 23 special wards including Koto ward. Using the result, we prove the characteristic of the high-rise apartment towns in Koto ward.
2s
T hn p
v
β α
= + (2)
2. The Mathematical Model Calculates the Number of Facilities
from the Area and Population
2.1. G. Edward Stephan (1998)’s Model
T is the total expenditure of facility. The first term on the right side is the maintenance time (or equal to the cost), with h as the number of person-hours required per estab-lishment and N as the number of facilities. The second term is the interaction time, with S as the average distance separating the population P from service establishments and v as the average velocity with which this distance is traversed (the distance has been doubled to represent roundtrips). α and β are investigated parameters, and Stephan
(1998) shows that the value differs according to the facilities.
The average service area per establishment will be the total area A, divided N by. By dimensional analysis, the distance S must be proportional to the square root of the av-erage area. With ω as the constant of proportionality in Equation (3), leads to Equation (4) 2 A S N β β =ωβ
(3)
2 2
2
T hn A P N
v β β β α ω − = +
(4)
Equation (4) permits us to minimize T with respect to N. Differentiating Equation (4), we obtain Equation (5)
2
2 2
dt
h A P N
dN v
β β
β α
βω − +
= −
(5)
Equation (5), set equal to zero and solved for N, leads to
2
2 2
2 2 g
N A P kA P
vh β α β β δ β β βω + + + = =
(6)
where,
(
)
2
, g , 1
2
g
k g
vh
β
βω δ α
β
≡ ≡ ≡ −
+
2.2. The Model That We Propose
The population of Equation (6) is a town’s resident population, however, the set of population data of statistics is two types of data which is nighttime population and day-time population. There are some wards which have a big difference between a night-time population and a daynight-time population. For example, in Chiyoda ward in Tokyo, the daytime population is about 17 times larger than the nighttime population. Therefore, it is necessary to think about which population (either nighttime population or daytime population, or both) we should use for the model, because a target customer by a type of business is different. The target of B to B is a daytime population, B to C is a night-time population, and B to (B + C) is both. Thus, we introduce a weighting coefficient γ in the population P of Equation (6) to distinguish between a nighttime population Pn
and a daytime population Pd,
(
)
{
n 1 d}
p→ γP + −γ P (7)
Replacing Equation (6) by Equation (7) gives
(
)
{
1}
g
n d
N=kA γP + −γ P δ (8)
3. Measurement of the Parameters of Our Model
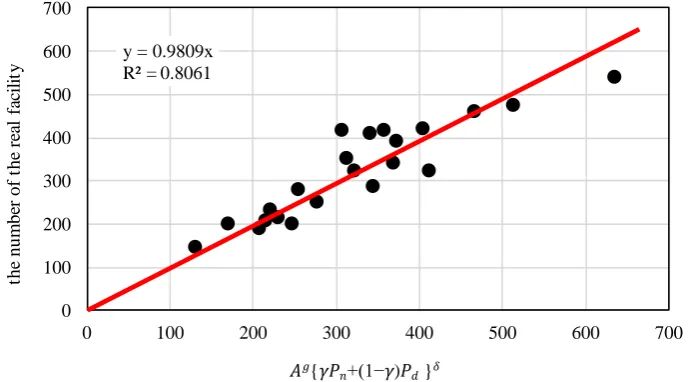
In this chapter, we decide the parameters (k, g, δ, γ) of Equation (8) in every type of business by using real data. As an example, we explain a method to decide these para-meters by use of Figure 3. The vertical axis expresses the number of facility N searched in a classified telephone directory (NTT Town-Page Corporation, Web telephone direc-tory service, www.ntt-tp.co.jp/english/). The horizontal axis expresses the value of
(
)
{
1}
g
n d
A γP + −γ P δ (without k) in Equation (8). By use of a simulation programing
we calculate the parameters by all combinations which has the following next conditions,
• 0 ≤ α ≤ 1, 0 ≤ β ≤ 1, 0 ≤ γ ≤ 1
• Each step size of three values (g, δ, γ) is 0.01 in the calculation program • Program loops are nested to three levels for all combinations (g, δ, γ)
The red straight line drawn in Figure 3 is the linear regression with no intercept cal-culated by the method of least squares. The values when the correlation coefficient is becomes maximum are the parameters (g, δ, γ), and the slope of the regression line be-comes k of Equation (8).
In the 23 special wards in Tokyo, we use the statistics data of 22 wards except Koto ward with the three high-rise apartment towns to examine in the following chapter. The data are based on Basic Resident Register as of January 1, 2016.
Table 1 shows the number (No.) used for Tables or Figures, about the 22 special
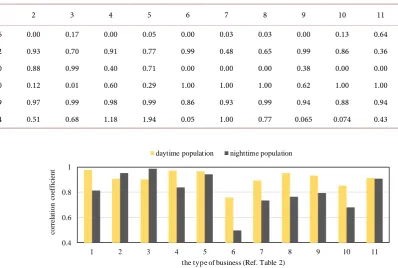
At first, Figure 4 shows the correlation coefficient by the conventional model Equa-tion (9).
1 2
3 3
N=kA P (9)
The parameters of Equation (9) are fixed values g=1 3, = 2 3δ (Stephan & Dorman,
1985, Qian, Yang, Han, & Ma, 2012) and the population P is a nighttime population. We
[image:6.595.202.548.268.459.2]make a calculation in each case where the population P is a daytime or nighttime popu-lation. This result (see Figure 4) shows that the most suitable population varies accord-ing to a type of business.
Table 3 is the calculation results of the method that we propose (Equation (8)). As the
minimum of the coefficient of correlation is 0.86, our model has an extremely high cor-relation about all types of business compared with Figure 4. Figure 5 shows the second
Figure 3. The real number of one facility vs. the term on the right side of Equation (8).
Table 1. No. used for tables or figures, about the 23 special wards in Tokyo and the high-rise apartment towns.
Number (No.) used for
Figures or Tables 1 2 3 4 5 6 7 8
Ward Chiyoda Chuo Minato Shinjuku Bunkyo Taito Sumida Shinagawa
Number (No.) used for
Figures or Tables 9 10 11 12 13 14 15 16
Ward Meguro Ota Setagaya Shibuya Nakano Suginami Toshima Kita
Number (No.) used for
Figures or Tables 17 18 19 20 21 22 23 24
Ward Arakawa Itabashi Nerima Adachi Katsushika Edogawa Koto*
TOYOSU, SHINONOME,
ARIAKE
Koto* Koto ward except No. 24 (TOYOSU, SHINONOME and ARIAKE).
y = 0.9809x R² = 0.8061
0 100 200 300 400 500 600 700
0 100 200 300 400 500 600 700
the
num
be
r of t
he
re
al
fa
ci
li
ty
Table 2. No. used for Tables or Figures, about the list of type of business and an assumption of target customers.
Number (No.) used for Figures or Tables 1 2 3 4 5 6
Type of business CVS laundry shop nursery dentist pharmacies or drugstores company leasing
Supposition Target B to B + C B to C B to C B to B + C B to C B to B
Number (No.) used for Figures or Tables 7 8 9 10 11
Type of business caterers takeout food store delivery to home restaurant sports club gas station
Supposition Target B to B B to B + C B to C B to B + C B to B + C
[image:7.595.152.551.268.536.2]CVS: Convenience Store nursery: We use a capacity of the nursery school not a number of facilities, because an acceptable capacity is greatly different by a scale of facility [× 1000].
Table 3. The calculation results of the method that we propose.
No. 1 2 3 4 5 6 7 8 9 10 11
g 0.16 0.00 0.17 0.00 0.05 0.00 0.03 0.03 0.00 0.13 0.64 δ 0.72 0.93 0.70 0.91 0.77 0.99 0.48 0.65 0.99 0.86 0.36 γ 0.00 0.88 0.99 0.40 0.71 0.00 0.00 0.00 0.38 0.00 0.00 1 − γ 1.00 0.12 0.01 0.60 0.29 1.00 1.00 1.00 0.62 1.00 1.00 correlation coefficient 0.99 0.97 0.99 0.98 0.99 0.86 0.93 0.99 0.94 0.88 0.94 k 1.34 0.51 0.68 1.18 1.94 0.05 1.00 0.77 0.065 0.074 0.43
Figure 4. The correlation coefficient by the conventional model Equation (9).
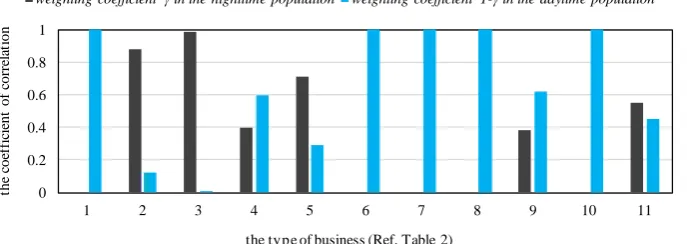
row (g) and the third row (δ) of Table 3. As pointed out in chapter 1, depending on a type of business, the number of facilities are influenced by an area (No. 1, 3, 10 and 11). Therefore, the model cannot ignore the area. Figure 6 shows the fourth row (γ) and the fifth row (1 − γ) of Table 3. We regarded No. 2, 3, 5 and 9 as a type of B to C that target the nighttime population. Figure 6 shows that No.2, 3 and 5 are in agreement with our assumption, however, No. 9 is greatly in influenced by the daytime population. No. 6 and 7 are a type of B to B for office workers, but it is revealed that No. 1, 8 and 10 also have high correlations with the daytime population. No. 4 and 11 B to (B + C) is same as what we thought.
0.4 0.6 0.8 1
1 2 3 4 5 6 7 8 9 10 11
corre
la
ti
on c
oe
ffi
ci
ent
[image:7.595.42.552.273.396.2]Figure 5.g and δ of Table 3, Value of the area’ exponents and the population’ exponents are most suitable for every type of business.
Figure 6.The weighting coefficient of the nighttime population and the daytime population when the coefficient of correlation becomes the maximum every type of business.
4. Evaluate Ability of the High-Rise Apartment Town
In this chapter, we calculate the value of the right side of Equation (8) by using the val-ue of Table 3. By the difference between the calculated value and the real𝑁𝑁, (Equation (1)), we evaluate the enrichment of facilities in the high-rise apartment town. Figure 7
shows the result in comparison with Figure 1 and Figure 2, indicating that the number of facilities of TOYOSU and SHINONOME are more substantial than ARIAKE. ARIAKE has many convenience stores for several reasons which are, other than being the high-rise apartment town, heavy traffic due to many larger-scale distribution com-panies and a number of people gathering in many event halls. Because TOYOSU has companies and inhabitants more than ARIAKE, there are many three kinds of facilities (convenience store, nursery and dentist’s office). This result accords with the actual feeling.
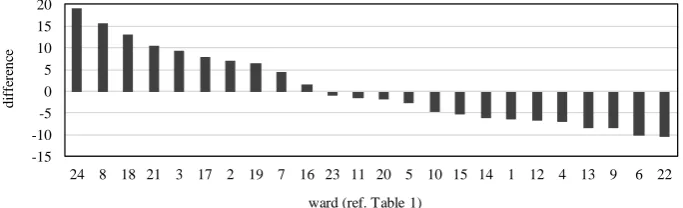
However, Figure 8 shows that there are few number of the convenience store and the dentist’s office because the area of the high-rise apartment town is larger than that of other wards. The town where houses crowd has more the convenience store and the dentist’s office. On the other hand, in the high-rise apartment town, the nursery is in-creased because the number of families suddenly inin-creased, and Figure 9 shows des-cending order of the capacity of nursery facilities. In the 23 wards in Tokyo, the high- rise apartment town has the largest capacity of the nursery.
0 0.2 0.4 0.6 0.8 1
1 2 3 4 5 6 7 8 9 10 11
the
c
oe
ffi
ci
ent
of c
orre
la
ti
on
the type of business (ref. Table 2) g Area's exponents δ Population's exponents
0 0.2 0.4 0.6 0.8 1
1 2 3 4 5 6 7 8 9 10 11
the
c
oe
ffi
ci
ent
of c
orre
la
ti
on
the type of business (Ref. Table 2)
[image:8.595.202.546.249.371.2]Figure 7. Differences between real N and the right side of Equation (8), Comparison in Koto ward, Characteristic of the high-rise apartment town.
Figure 8. Differences between real N and the right side of Equation (8), CVS and the dentist’s of-fice.
Figure 9. Differences (Equation (1)) between real N and the right side of Equation (8), the capac-ity of the nursery facilities.
5. Conclusion
This paper improved a conventional model, and clarified that the correlation of num-ber of the facility and either a nighttime population or a daytime population is high ac-cording to a type of business. Using our model, we proposed the method to evaluate the enrichment of facilities in a town, and developed the method to indicate the characte-ristic of the high-rise apartment town, which we were not able to clarify in our previous study.
-10 0 10 20 30 40
de
ffe
re
nc
e
convenience store nursery dentist's office
-150 -100 -50 0 50 100
1 2 3 4 5 6 7 8 9 10 11 12 13 14 15 16 17 18 19 20 21 22 23 24
di
ffe
re
nc
e
ward (Ref. Table 1) convenience store dentist's office
-15 -10 -5 0 5 10 15 20
24 8 18 21 3 17 2 19 7 16 23 11 20 5 10 15 14 1 12 4 13 9 6 22
di
ffe
re
nc
e
[image:9.595.201.545.263.387.2] [image:9.595.200.542.446.550.2]References
Andres, S. (2014). Location and Agglomeration: The Distribution of Retail and Food Businesses in Dense Urban Environments. Journal of Planning Education and Research, 34, 374-393.
http://dx.doi.org/10.1177/0739456X14550401
Balcik, B., & Beamon, B. M. (2008). Facility Location in Humanitarian Relief. International Jour-nal of Logistics: Research and Applications, 11, 101-121.
http://dx.doi.org/10.1080/13675560701561789
Gastner, M. T. (2011). Scaling and Entropy in p-Median Facility Location along a Line. Physical Review E, 84, Article ID: 036112. http://dx.doi.org/10.1103/PhysRevE.84.036112
Honma, Y., & Kurita, O. (2008). A Mathematical Model on the Optimal Number of Hydrogen Stations with Respect to the Diffusion of Fuel Cell Vehicles. Journal of the Operations Research Society of Japan, 51, 166-190. http://www.orsj.or.jp/~archive/pdf/e_mag/51-2-166-190.pdf Honma, Y., & Toriumi, S. (2014). Model Analysis of Electric Vehicle Charging Infrastructure
Development on Highways—An Approximation of the Required Scale of Electric Vehicle Charging Facilities. Forma, 29, 41-50. http://dx.doi.org/10.5047/forma.2014.007
Mori, H. (2016). Clustering of Migrant Sending Suburban 60 km Areas to Tokyo 23 Wards with Migration Preference Index. Keizai Shirin (Hosei University Economic Review), 83, 1-26. (In Japanese) http://repo.lib.hosei.ac.jp/handle/10114/12183
Qian, J.-H., Yang, C.-H., Han, D.-D., & Ma, Y.-G. (2012). Multi-Scaling Mix and Non-Universality between Population and Facility Density. Physica A: Statistical Mechanics and Its Applications, 391, 5146-5152. http://dx.doi.org/10.1016/j.physa.2012.05.038
Sakamoto, N. (2016). About the Facility Density of the Area with Many High-Rise Apartments in Koto Ward in Tokyo. Hosei University, Japan Statistics Research Institute, Occasional Paper No.63. (In Japanese) http://www.hosei.ac.jp/toukei/shuppan/oc63.html
Stephan, G. E. (1998). The Distribution of Service Establishments. Journal of Regional Science, 28, 29-40. http://dx.doi.org/10.1111/j.1467-9787.1988.tb01193.x
Stephan, G. E., & Dorman, D. (1985). Testing Size-Density Relationships without Ratio-Variables, Multicollinearity, Logarithmic Transformations, or Regression Analysis. Journal of Regional Science, 25, 427-435. http://dx.doi.org/10.1111/j.1467-9787.1985.tb00310.x
Submit or recommend next manuscript to SCIRP and we will provide best service for you:
Accepting pre-submission inquiries through Email, Facebook, LinkedIn, Twitter, etc. A wide selection of journals (inclusive of 9 subjects, more than 200 journals)
Providing 24-hour high-quality service User-friendly online submission system Fair and swift peer-review system
Efficient typesetting and proofreading procedure
Display of the result of downloads and visits, as well as the number of cited articles Maximum dissemination of your research work
Submit your manuscript at: http://papersubmission.scirp.org/