Creative Credits
a randomized Controlled
industrial poliCy
experiment
Hasan Bakhshi, John Edwards, Stephen Roper, Judy Scully, Duncan
Shaw, Lorraine Morley and Nicola Rathbone
About Nesta
nesta is the uK’s innovation foundation. an independent charity, we
help people and organisations bring great ideas to life. We do this by
providing investments and grants and mobilising research, networks and
skills.
nesta operating Company is a registered charity in england and Wales with company number 7706036 and charity number 1144091. registered as a charity in scotland number sC042833. registered office: 1 plough place, london, eC4a 1de
CONTENTS
Foreword 5
Executive summary
6
Section 1: Creative experimentation
10
Section 2: Creativity, open innovation and growth
11
2.1 introduction 11
2.2 open innovation and business performance 12
2.3 Creativity and innovation 14
2.4 Creativity and open innovation in smes 14
Section 3: Creative Credits: an RCT+ experiment
16
3.1 introduction 17
3.2 Creative Credits, how it works and its logic model 17
3.3 the Creative Credits experiment – rationale 19
3.4 the Creative Credits experiment – implementation 21
Section 4: The Creative Credits experiment: results
25
4.1 introduction 26
4.2 network additionality of Creative Credits 27
4.3 output additionality of Creative Credits – innovation and sales impacts 28
4.4 Behavioural additionality 32
Section 5 – Implications for policy design and evaluation
35
5.1 introduction 37
5.2 implementing the rCt+ evaluation approach 37
randomization 37
longitudinal data collection 39
mixed methods 39
5.3 implications for innovation voucher schemes 41
Annex 1: Implementation and Evaluation
43
a1.1 implementation 43
a1.2 evaluation 44
Annex 2: Profiling Creative Credits Applicants
52
a2.1 introduction 52
a2.2 non–applicants survey 52
a2.3 Characteristics of Creative Credits applicants 52
Annex 3: Profiling Creative Credits Projects
54
Annex 4: Econometric Tables
56
Annex 5: Estimating the benefit–cost ratio for Creative Credits
66
Annex 6: Case Studies
68
Acknowledgements 72
FOREwORd
When it started nesta’s Creative Credits project looked like a brave but isolated experiment. there had been remarkably little use of rigorous experiment design in
industrial policy, innovation policy and the arts. at worst some governments evaluated their policies by surveying grant recipients to ask whether they had found the grants useful. now things look rather different. since the project was carried out there has been a resurgence of interest in the rigorous use of evidence and in the use of properly constituted control groups. at nesta we have launched the alliance for useful evidence which has both benefited from, and contributed to, renewed enthusiasm for measurement and rigour in public policy. the uK government has started to raise its game, building on the success of niCe in healthcare with a batch of new ‘What Works’ centres (though so far these have been mainly focused on social policy rather than business). there’s also growing interest in international organisations, and the european Commission.
vast amounts of public money are spent supporting businesses around the world. much of this may do good – helping firms to adopt new technologies or to sharpen up their strategies or marketing. But the truth is that nobody knows whether it’s having any real impact. officials don’t know. ministers don’t know. and the businesses themselves don’t know.
they don’t know because, in stark contrast with fields like medicine, new approaches are introduced without testing.
the Creative Credits project should be seen as a pioneer. We will be following it up with new initiatives to support intelligent experimentation and measurement in innovation policy.
my hope is that before long it will be obvious that any new programme should be tested before it’s taken to scale. that way we’ll get smarter, more effective policies. But we may also save a great deal of money too...
Geoff mulgan
ExECuTIvE SummARy
very little policy supporting business is subjected to rigorous evaluation. As a result we have no reliable way of knowing if large sums of public money are being wasted. Creative Credits – the focus of this report – is an important innovation in itself: it helps smaller firms become more competitive by connecting them with creative businesses.
But the evaluation method used may be even more important, since it not only uses randomization to establish the scheme’s additional impact, but also links that to longitudinal data collection which is vital in helping to assess the longer term
effectiveness of different policy tools. This is an approach that should be applied much more widely. At a time when public resources are scarce it’s more important than ever that we find out what works and what doesn’t – and that principle should apply as much to business support as it does to programmes in healthcare or schools, where the uK Government has so far shown much greater interest.
this report uses a randomized controlled trial methodology to evaluate a business support scheme called Creative Credits. Creative Credits is a business–to–business voucher
mechanism designed to encourage small and medium–sized enterprises (smes) to innovate in partnership with creative service providers. in the pilot in the manchester City region in the north West of england in 2009 and 2010, smes received Creative Credits worth £4,000, which they could use to purchase a variety of creative services from local creative businesses. the smes were required to contribute at least a further £1,000 of their own towards their projects. this report evaluates the impact of the pilot.
previous research has suggested that creative businesses, as a source of new ideas and knowledge, exert positive influences on innovation in other firms they are transacting with. For a wide range of innovation measures, firms with stronger links to the creative industries appear to have a superior innovation performance. a uK study combining survey measures of innovation with the input–output tables that quantify supply chain links between
sectors finds that firms that spend double the average amount on creative inputs – 6 per cent compared with three per cent of their gross output – are 25 per cent more likely to introduce product innovations.
such findings are indicative at best, as they cannot rule out that the causality runs in the opposite direction. that is, that more innovative businesses have a tendency to make greater use of creative services. in the Creative Credits pilot, the random assignment of smes to the treatment and control groups meant that we were able to explore the causal relationship between the use of creative services and innovation with a much greater degree of statistical robustness than would otherwise have been possible.
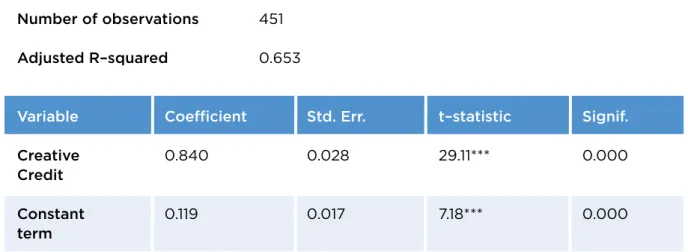
We found that Creative Credits created genuinely new relationships between smes and creative businesses, with the award of a Creative Credit increasing the likelihood that firms would undertake an innovation project with a creative business they had not previously worked with by at least 84 per cent (table a, where the dependent variable takes the value of one for firms that proceeded with their project and zero otherwise, and the ‘Creative Credit’ variable takes the value of one for firms that received a Creative Credit and zero if they did not).
dependent variable: whether or not firms undertook their project
Number of observations 451
Adjusted R–squared 0.653
variable Coefficient Std. Err. t–statistic Signif.
Creative 0.840 0.028 29.11*** 0.000
Credit
Constant 0.119 0.017 7.18*** 0.000
term
Table A: likelihood of firms undertaking their innovation project
Notes: analysis is based on respondents to the initial baseline survey undertaken immediately after the allocation of Creative Credits. *** denotes significance at the 1 per cent level.
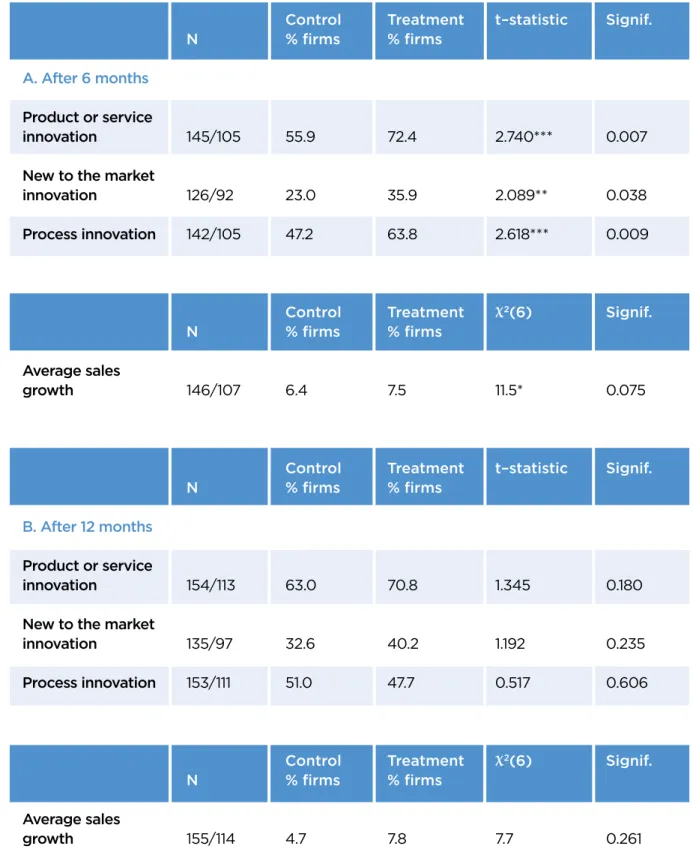
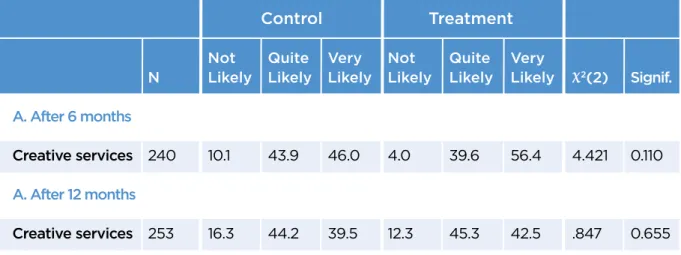
the evidence also supports the view that working with creative businesses can lead firms to be more innovative: in the six months following completion of their creative projects, smes were significantly more likely than those that were not assigned Creative Credits to have introduced product and process innovations (table B, part a). the use of creative services also had a statistically significant positive effect on the sales growth of smes over the same period. these findings provide striking evidence that working with creative businesses can generate commercial benefits for smes.
twelve months after the completion of the Creative Credits project, however, there was no longer a statistically significant difference between the treatment and control groups in the proportion of firms innovating, nor in their sales growth, in the previous six months. (table B, part B). though only a minority of smes at this point reported having received the full benefits from their projects.
Control Treatment t–statistic Signif.
N % firms % firms
A. After 6 months Product or service
innovation 145/105 55.9 72.4 2.740*** 0.007
New to the market
innovation 126/92 23.0 35.9 2.089** 0.038
Process innovation 142/105 47.2 63.8 2.618*** 0.009
Control Treatment χ2(6) Signif.
N % firms % firms
Average sales
growth 146/107 6.4 7.5 11.5* 0.075
Control Treatment t–statistic Signif.
N % firms % firms
B. After 12 months Product or service
innovation 154/113 63.0 70.8 1.345 0.180
New to the market
innovation 135/97 32.6 40.2 1.192 0.235
Process innovation 153/111 51.0 47.7 0.517 0.606
Control Treatment χ2(6) Signif.
N % firms % firms
Average sales
growth 155/114 4.7 7.8 7.7 0.261
Table B: output additionality in terms of the probability of innovation: 6 months and 12 months after the completion of the Creative Credits projects
Notes: table is based on the longitudinal sample. see annex 1 for details. after six months, firms were asked to select a band within which their sales had grown/fallen in the previous six months and whether they had introduced any innovations in the previous six months. after twelve months, firms were again asked to choose a band within which their sales had grown/fallen in the previous six months and whether they had introduced any innovations in the previous six months. differences in response numbers between questions and between 6 and 12 months reflect those respondents not answering particular questions and those selecting the (‘don’t know’) response. * denotes significance at the 10 per cent level; ** at 5 per cent and *** at the 1 per cent level. the χ2(6)
test statistic is based on the difference in distribution of sales growth rates, not the average sales growth rates. the number of degrees of freedom in this test is determined by the banding of the sales growth data.
there was no evidence either that Creative Credits had had a permanent effect on the behaviour of smes: for example, those receiving Creative Credits appeared no more likely to work with creative service businesses in the longer term.
the qualitative research suggests that for many smes where the short-term benefits were not sustained, the creative projects had been too ‘transactional’ in nature, and for others there had been communication difficulties with their creative partners. this suggests that future versions of the scheme which seek to sustain longer term benefits should explore opportunities for targeted brokerage to support the relationship between smes and their creative suppliers. any such modifications should be similarly rigorously evaluated.
the evaluation approach that we adopted in this project combined three elements – randomized allocation of Creative Credits, longitudinal data collection, and the use of mixed methods. this has proven to be a powerful methodology, and we argue that it should be used much more widely by the Government and other agencies in developing new innovation support policies.
We note that a number of cities across europe are now adopting their own Creative
Credits–style schemes e.g. strasbourg, salzburg, sligo and the Basque Country, inspired by the successes of the manchester pilot. the uK Government is more generally showing an appetite for innovation voucher schemes. Concurring with a study of innovation support schemes for manufacturing smes published last year by the european Commission, we advise strongly that these (and other innovation support) schemes should adhere wherever possible to a randomized allocation as they are rolled out, in order to establish a cumulative evidence base for the effectiveness of their programme design features.
Section 1:
CREATIvE ExPERImENTATION
this report brings together two very recent developments in policymakers’ understanding of innovation. First, the recognition that the creative industries are an innovative sector that can stimulate innovation in other sectors too, through their supply chain linkages. second, the argument that innovation policymakers should make use of controlled experimentation methods to trial and test new policy interventions.
there is a growing body of evidence that creative businesses in sectors like software, architecture and advertising tend to introduce product and process innovations at a higher frequency than other sectors of the economy.1 Furthermore, as a source of new ideas and knowledge, they may exert positive influences on innovation in other firms they are transacting with. previous nesta research suggests that for a wide range of innovation measures, firms with stronger links to the creative industries have a superior innovation performance. For example, firms that spend double the average amount on creative products – 6 per cent compared with 3 per cent of their gross output – are 25 per cent more likely to introduce product innovations. to put this into context, these effects are in quantitative terms equivalent to the impacts that national innovation support policies are estimated to have had on innovation.
a separate literature emphasises that uncertainty about future opportunities and
constraints can be a great barrier to business innovation.2 innovation policy, it is argued, should aim to reduce this uncertainty, by enabling experimental learning. that is, the goals of innovation policy need to be led by research and learning priorities. Control groups of businesses should be tracked, in order to identify the impact of support measures on business change as well as the mechanisms by which this change is affected. policymakers should stand ready to scale up or down the experimental inquiry, perhaps significantly, depending on emerging findings.3 this argument lends itself to a more ‘project–based’ conception of industrial policy.
in 2009, researchers at nesta devised an ‘industrial policy experiment’ to explore these arguments further. this report, and the research on which it is based, makes three original contributions. For the first time, it provides robust quantitative evidence at the firm level on the causal – as opposed to merely correlative – relationship between business use of creative services and innovation (and, as such, contributes to the so–called creative industries ‘spillovers’ agenda4). second, it employs a randomized controlled trial (rCt) experimental methodology to evaluate the scheme’s additional short and longer term impacts on business innovation – a rare example of the use of the rCt method in industrial policy. lastly, it embeds the rCt in a wider ranging mixed–method evaluation which makes use of qualitative methods to probe the results from the quantitative analysis. as such, it points to a new way that the impact of policies to support business innovation can be rigorously evaluated, one we term ‘rCt+’.
Section 2:
CREATIvITy, OPEN INNOvATION
ANd GROwTh
Key points:
previous studies suggest that partnering with other organizations – through an ‘open’ innovation strategy – can make firms more innovative, and that innovation in turn contributes to enhanced business performance.
other studies suggest that creativity and design also stimulate business innovation, but that a range of difficulties around communication, goal orientation and aspiration gaps between creative staff and others involved in the innovation process can
present barriers.
levels of openness and innovation in small– and medium–sized enterprises (smes) may further be hindered by behavioural failures in their managers, linked to inertia, risk aversion and myopia. these behavioural failures are likely to lead to levels of openness and innovation which are below what is socially desirable, a factor which has motivated a range of innovation voucher schemes which have attempted to ‘nudge’ smes into being more innovative by connecting them with universities. the Creative Credits scheme intends to overcome behavioural failures and build new partnerships between smes and creative service providers and so stimulate innovation and organizational learning.
2.1 Introduction
previous research has established positive relationships between innovation and growth, and, separately, creativity and innovation. in this section, we briefly review this evidence, which provides the broader context for the Creative Credits scheme. We emphasise the challenges that smes in particular face in undertaking open innovation, and discuss some of the policy responses which have been adopted.
section 2.2 reviews the evidence on the relationship between open innovation and business performance. open innovation involves working with partners, whether customers,
suppliers or other organizations, to generate new products or services. recent evidence suggests that open innovation is becoming more widespread amongst smes.5
However, as other research has made clear, open innovation poses particular challenges for smes because of their lack of capacity to both seek and absorb external knowledge when compared with larger firms.6
section 2.3 considers some recent evidence on the relationship between creativity and innovation, with a particular focus on the value to firms’ innovation processes of accessing external creative services through suppliers. again, we might anticipate that smes
face particular issues in working with external creative service providers due to limited absorptive capacity and/or internal resources, though the existing evidence base for this is much weaker. these issues are discussed in section 2.4 along with some possible policy responses.
2.2 Open innovation and business performance
a growing body of evidence suggests that collaborating with external partners on innovation (or ‘openness’) may influence the performance of firms in a number of ways, through stimulating creativity, enhancing product quality and providing reputational benefits which signal the quality of firms’ innovation activities.7 external linkages may also provide access to networks which create commercial opportunities, and allow firms to search their technological environment in a more systematic fashion, resulting in improved access to technology developed elsewhere.8 Because the success of any innovation process is uncertain, firms may have an incentive to pursue several such external linkages at the same time: having more linkages or different types of linkage spreads the risks of innovation on the one hand, and increases the probability of obtaining useful knowledge from outside of the firm on the other.9 Furthermore, there is empirical evidence that knowledge gained from different sources tends to be complementary, and also
complementary with respect to internal r&d in shaping innovation performance.10 using external knowledge linkages, however, also has potential disadvantages, both for large and small firms. Firms may, for example, face difficulties in defending their intellectual property rights in relationships with partners, which may limit the commercial benefits from collaborating. Furthermore, sourcing information from, or collaborating with, a larger number or variety of partners raises search, management and monitoring costs.
absorbing knowledge simultaneously from a large number of sources can be challenging too.11 there may, for example, be limits to how much attention managers can give to, and cognitively process, competing sources of information. the returns to adding linkages are therefore likely to be diminishing, and may even turn negative beyond some ‘saturation’ point.
as a consequence of these trade–offs, some studies detect an ‘inverted u–shaped’ relationship between the breadth of external knowledge linkages (that is, the number of different types of knowledge linkage) and innovation performance.12
a robust research finding is that innovative firms are more profitable.13 this may be because innovators are able – at least for a time – to enjoy monopoly profits while their intellectual property is protected, or alternatively it may be because innovating firms have a tendency to introduce successive innovations over time, and are therefore able to sustain high profits, even if the profits from any one innovation are transitory.
studies also provide clear evidence of the positive relationship between innovation and firm productivity,14 and innovation and business growth in a range of sectors.15 a recent study from the uK, for example, provides evidence of the positive impact of innovation on growth in a sample of business services firms (as well as the impact of openness on innovation itself16).
the evidence on the effect of openness on innovation and business performance is important for the Creative Credits experiment, in that it points to the potential impacts we might observe. if Creative Credits succeeds in stimulating firms to develop the extent of their collaborative relationships with innovative businesses (pointing to the notion of ‘network additionality’ in which a policy intervention helps or encourages a firm to extend its innovation networks17) we might expect to see increased innovation and improved business performance (‘output additionality’).
However, network and output additionality are not the only beneficial effects which might be anticipated from Creative Credits.18 undertaking innovation projects can also have other capability or learning benefits for firms, which are best described under the heading of ‘behavioural additionality’. this captures the extent to which the behaviour of a firm’s managers changes as a result of an innovation project.19 Behavioural additionality might relate broadly to technological activities (firms may explore new technological or market opportunities after contact with a new technology or market area, for example), processes (firms may develop new coordinating systems for r&d and innovation, either in–house or for managing or developing external links), and people (firms may develop new competencies, ranging from project management skills, through to various acquired technological and market capabilities).20
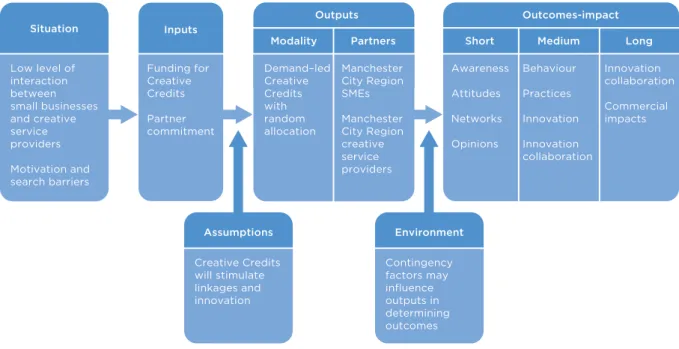
these three notions of additionality – network, output and behavioural – provide the structure for our analysis in this report of the impacts of the Creative Credits experiment (Figure 1.1).
Figure 1.1: additionality and the Creative Credits scheme
Network
Behavioural Output
2.3 Creativity and innovation
the ‘design intensity’ of an increasingly wide range of products suggests that design plays an important role in innovation success.21 designers enhance the functional, emotional and symbolic value of products in the eyes of consumers and businesses.22 design–driven, or design–led, innovation processes which adopt novel perspectives on particular innovation problems may also contribute to the development of more radical innovations with the potential to disrupt markets and create large new profit streams.23 there are now a large number of studies providing empirical evidence for these claims.24
a more recent development is evidence that the benefits of a design–oriented approach are reflective of the wider business value of engaging with creative services which include, but are not restricted to, design.25
managing creativity and design in the innovation process is not always easy, however. Case studies of the involvement of designers in innovation highlight issues relating to: cultural barriers associated with language and designers’ self–image; and work process barriers related to the different working practices of designers and others involved in innovation. so, for example, “the goal of good industrial design [is] perceived by designers to be the creation of an ‘iconic’ product – one that [will] become famous and instantly recognizable. By contrast, managers [perceive] design as a means to build brand and achieve the right price.”26
similar tensions have also been observed between designers and marketing staff involved in innovation: “This frequently [leads] to design–marketing conflict. Designers [are]
compelled to express performance parameters in marketing terms, of which they [have] no experience and [are] unable to understand”.27 Goal incongruity between marketing staff and others involved in innovation is, in turn, held by some to lead to conflicts in firms attempting to integrate design into their innovation activities.28
the evidence on creativity, design and innovation has at least two implications for the Creative Credits experiment. First, the Creative Credits, insofar as they help smes access creative services, should have additional output effects on innovation. second, we might expect that issues around communications between design and creative staff and others involved in the innovation process will give rise to potential conflicts between firms, raising potentially important barriers to the positive effects on innovation.
2.4 Creativity and open innovation in SmEs
recent evidence suggests that smes are no different from the general population of firms in innovation being a driver of business performance.29 there are, however, good reasons for thinking that smes differ from larger firms in terms of the ability to realise the benefits of open innovation and creative partnerships. open innovation poses particular challenges for resource–constrained smes, associated with the need to: (i) develop mechanisms for identifying useful external knowledge; (ii) build organizational structures to support collaborations, and (iii) absorb externally developed ideas and technologies and make them fit for the purpose of their own businesses. these same challenges can make smes less attractive as potential collaborators, presenting further barriers to establishing
partnerships.30 partly as a consequence, it is not surprising that smaller firms are generally found to be less ‘open’ – that is, they have fewer external innovation partnerships on average – than larger firms.31
this does not mean, however, that the benefits of openness for smes are necessarily smaller than for large firms. indeed, smes’ more limited internal resources may mean it is actually more worthwhile for smes to engage in open innovation strategies than larger firms. one recent study finds that small firms benefit greatly at the margin from external linkages, but that they reach their cognitive limit to benefitting from openness earlier than larger firms, at around 3–4 different external linkages.32
arguably, these cognitive limits are perpetuated by behavioural failures on the part of managers running smes – such as inertia (the tendency to accept the status quo, no matter how strong the case for change might be), excessive risk aversion (cognitive biases push owners of smes to make choices that anticipate more certain outcomes, particularly at the boundaries of their knowledge or experience), and myopia (the tendency to opt for short– term gain at the expense of longer term, strategic decisions).33
these behavioural failures likely contribute to a reluctance on the part of smes to
undertake open innovation, which requires novelty, risk tolerance and a willingness to make strategic investments. policymakers have responded with instruments such as innovation vouchers to overcome some of these behavioural failures and encourage smes to engage in open innovation with universities.34 innovation brokers have also been used in some situations to help smes identify firms with complementary capabilities and develop new innovation partnerships. measures to support collaborative innovation have also been a consistent feature of innovation policy in some eu countries leading to the development of strong traditions of open innovation. this type of measure has been less common in the uK and Germany than in some other eu countries, however, most notably Finland.35
Section 3:
CREATIvE CREdITS:
AN RCT+ ExPERImENT
Key points:
in the scheme’s pilot in the manchester City region between october 2009 and november 2010, 150 Creative Credits – vouchers with a face value of £4,000 – were awarded to eligible smes to develop collaborative innovation projects with a creative business. the smes were required to contribute a further £1,000 of their own towards their project.
We profile the anticipated impact of the Creative Credits scheme in a ‘logic model’. this hypothesises that in smes, behavioural failures linked to inertia, excessive risk aversion and myopia lead to lower levels of collaboration than is socially desirable. Creative Credits may help firms to overcome these behavioural failures and lead to increased levels of connectivity between firms and therefore innovation. in the longer term, the Creative Credits logic model suggests that this should lead to behavioural changes and stronger business performance.
We tested the Creative Credits scheme’s logic model with a controlled experiment, using what we call an ‘rCt+’ evaluation methodology. this has three key features: (i) a randomized allocation of Creative Credits to firms (the ‘treatment’ group), enabling the scheme’s additional impacts to be rigorously evaluated by comparing innovation and business performance in the ‘treatment’ group with a ‘control’ group of firms made up of non–recipients; (ii) a longitudinal data strategy, allowing the longer term as well as short–term impacts to be assessed, and (iii) a mixed–methods empirical approach, combining qualitative interviews with quantitative survey
techniques.
We note the rarity of randomized controlled trials in industrial policymaking. We argue, however, that their use is important in situations where selection biases are severe – that is, when the businesses that self–select to, or that are selected to, participate in support programmes are already more innovative than the ‘average’ business the policymaker is targeting. a recent evaluation of sme innovation support schemes in the manufacturing sector, funded by the european Commission, suggests that this is not the exception, but the rule.
there are arguments for randomization that are related to cost effectiveness too: it is a cheaper, simpler and, arguably, fairer method of allocating constrained business support resources amongst firms than alternative methods based on subjective assessments of worthiness by programme managers.
3.1 Introduction
the empirical evidence reviewed in section 2 provides the broad context for exploring interventions to encourage smes to work with creative partners as part of their innovation activity. in this section, we focus on the different elements of the Creative Credits
experiment: its underlying logic model; the justification for the use of formal experimental methods; the implementation of the Creative Credits pilot in the manchester City region; and, the deployment of our evaluation methodology.
section 3.2 focuses on the logic model for Creative Credits. this sets out the rationale for intervention, suggests how Creative Credits should work, and forms hypotheses about its short–term outputs and longer term outcomes. testing the causal process envisaged in the logic model is the main focus of the evaluation. the traditional approach to evaluating business support programmes is to conduct an ex post evaluation, asking participating businesses to reflect on their experience of the scheme. We adopt an alternative experimental approach which combines three main elements: randomized allocation of Creative Credits, longitudinal data collection, and the use of mixed methods.
section 3.3 outlines the background to the Creative Credits experiment, discussing both the methodological and economic arguments for taking the rCt+ approach. sections 3.4 and 3.5 briefly describe the implementation of the Creative Credits scheme and its evaluation.
3.2 Creative Credits, how it works and its logic model
Whether or not they recognise it in these terms, all firms have innovation processes, some well developed, others not. the quality and the extent to which a firm’s innovation process is embedded in its business practices determine its long–term competitive position.
there is a great deal of evidence for market (or system) failures in smes’ innovation processes. most obviously, smes face difficulties in accessing external funding sources, owing to information asymmetries between lenders and smes about their commercial prospects.36
such failures may be compounded by behavioural failures on the part of the managers of smes: inertia, excessive risk aversion and myopia may form significant barriers to changing attitudes and routines which, it is argued, leads firms to make insufficient investments in innovation.37 together, these market, system and behavioural failures can act as overwhelming constraints for smes when it comes to introducing novelty.
interventions such as Creative Credits aim to overcome these failures, by encouraging collaboration with businesses in the creative industries. the aim is to test whether a one– off injection of creativity can ‘nudge’ smes into being more innovative. the idea of nudging innovation this way is prompted by theoretical arguments that creative businesses are less prone to the behavioural failures discussed earlier, and empirical research which suggests that firms which make greater use of services from the creative industries have superior innovation performance.38
the ‘logic model’ for the Creative Credits scheme is shown in Figure 3.1. this links the justification for public intervention in the relationship between smes and creative businesses, the scheme’s objectives, the process by which the scheme operates, its
immediate outputs and intended longer term outcomes.39 it also points to the Key performance indicators which provide an indication of the effectiveness of the Creative Credits scheme.
Figure 3.1: logic model for Creative Credits
Situation Low level of interaction between small businesses and creative service providers Motivation and search barriers Funding for Creative Credits Partner commitment Inputs Demand–led Creative Credits with random allocation Manchester City Region SMEs Manchester City Region creative service providers Outputs Modality Partners Outcomes-impact Awareness Attitudes Networks Opinions Innovation collaboration Commercial impacts Behaviour Practices Innovation Innovation collaboration
Short Medium Long
Assumptions Creative Credits will stimulate linkages and innovation Environment Contingency factors may influence outputs in determining outcomes
the logic model describes how the award of a Creative Credit should help smes overcome the barriers to innovation associated with financial barriers and behavioural failures: smes develop new collaborations with a business partner in the creative industries, which lead to innovations and improvements in firms’ longer term competitive positions. For the creative partner, the Creative Credit represents a potentially valuable new business opportunity (the scheme requires that creative businesses and smes have not previously worked with each other) certainly in the short– and potentially the longer term too.
the final elements of the logic model relate to the specification of the scheme’s outputs and their relationship to longer term outcomes, identifying possible contingent factors. in the short term, the outputs from Creative Credits are measured primarily in terms of increased levels of interactions between smes and creative businesses relative to what would have prevailed absent the intervention – or in other words, network additionality. in the longer term, we anticipate that this might generate three types of outcome: output additionality, as innovations result from the Creative Credits projects which impact on sales and growth; behavioural additionality, as organizational learning takes place and smes learn to work with, and value more highly, creative inputs to innovation; and, perhaps, further network additionality, as smes absorb the value of partnering for innovation. the logic model highlights that such outcomes are contingent on other factors influencing firms’ innovation processes, however, and that these need to be controlled for, along with market and other contextual factors, if the scheme is to be convincingly evaluated.
3.3 The Creative Credits experiment – rationale
as the evidence reviewed in section 2 suggests, there are arguments for public intervention to promote connectivity between smes and creative service providers to stimulate innovation. public intervention in this arena is a recent development, however, and goes beyond current experience with innovation vouchers which have largely focussed on linking firms to technical knowledge providers such as universities.40 this raises the question of how the effectiveness of the Creative Credits scheme should be assessed. a standard approach might be to commission a small–scale pilot exercise and undertake monitoring and an ex post evaluation. this would typically involve the allocation of support using some type of peer review or assessment mechanism to explore the appetite for any larger scheme which might follow. evaluation would then seek to assess the impact of the scheme, potentially allowing for any selection bias, using econometric methods, which might have occurred in the allocation of the business support. this type of evaluation – allowing for potential selection biases – has been emphasised by the oeCd as best practice in ex post evaluation and has been widely applied in recent years.41
the ‘fundamental problem of causal inference’ is that the treated outcomes and non– treated outcomes for any single firm are never jointly observed.42 the analytical problem this raises is how to estimate the difference between the actual realised outcomes and the potential outcomes if no treatment had been administered. ideally, the substitute for the unobserved (un–treated) outcome needs to meet two criteria: (i) it should be observable to the researcher and (ii) it should be an internally ‘valid’ substitute for the set of un–treated outcomes.43 validity in this sense requires that “the only difference between the member
of the control group and the member of the treated group corresponds to the fact that the latter is treated and the first one is not” (reiner, 2011, p. 18).
the standard approach to piloting business support schemes breaches this requirement. the pilot might, for example, be targeted on firms which are ‘better’ than others in some sense, suggesting that the difference between the treated and control group would reflect both the effects of this selection and the treatment itself. one recent study, for example, illustrates how funding allocations in the norwegian research Council are based on ex ante
project rankings generating a potential selection bias when evaluating the research Council’s funding decisions.44 related biases may also arise in cases where firms self– select to apply for a scheme. in the case of an innovation support measure, for example, only firms which are at the point of application interested in innovating in the current period are likely to apply. in its assessment of innovation support schemes for smes in the manufacturing sector in seven european regions, the european Commission’s Gprix project finds that businesses that are selected to participate in standard programmes do not actually benefit from them, whereas support allocated to firms on a random basis has positive impacts.45
the prevalence of these selection issues in policy evaluation has led to the development and widespread application of econometric approaches which can ‘control’ for potential selection biases. typically, such approaches involve a two–step process, modelling first the probability that a firm will be in the treatment rather than the control group, and second the impact of the treatment ‘controlling’ for any selection biases. implementing this type of approach, however, involves making restrictive structural assumptions about the underlying causal processes and often poses significant statistical issues in terms of identification, requiring for example the use of a variable or group of variables which influence the
probability of being in the treatment group but which have no influence on subsequent outcomes. these procedures – called instrumental variables techniques – are difficult to validate as tests which attempt to do so have notoriously low statistical power; that is, they have a high tendency to conclude that the identification schemes are valid when in fact they are not.
the very great difficulties in controlling for selection bias point to the alternative experimental approach with random allocation of firms into the treatment and control groups. “Random assignment [also] removes any systematic correlation between treatment status and both observed and unobserved participant characteristics. Estimated treatment effects are therefore free from the selection bias that potentially taints all estimates based on non–experimental sources of information.”46 in other words, with random allocation of firms between the treatment and control groups, it is possible to directly infer the impact of the scheme as the difference between outcomes for the two groups.
a number of potential issues arise, however, even with this type of rCt approach:47 • it is not clear if the results of any single experiment can be generalised to the target
population and to what extent they can be generalised to other populations – that is, whether the results are ‘externally’ valid.
• it is possible that substitution biases occur if a firm in the control group, through either applying to Creative Credits or participating in the scheme’s evaluation, accesses other types of public support for their proposed project, leading to an under–estimation of the additional impact of the scheme.
• adverse selection biases may occur if firms that are not representative of the wider business population apply to Creative Credits e.g. firms that apply may have more of a history of applying to public support schemes or perhaps be more ‘innovation– engaged’ (and annex 2 of this paper confirms this is indeed what we found in the pilot). • a further source of possible bias is if there are patterns in the types of business that
drop out from the scheme after the random assignment. depending on the scale of any drop–out, additionality estimates compiled on the basis of the original randomized treatment group may not reflect those of the group actually treated. in the manchester pilot, we attempted to minimise the possibility of such a bias by randomly selecting eligible firms to be on a reserve list to take the place of any businesses that did not take up their Creative Credits after they had been assigned.
While these issues are potentially important and have implications for the statistical robustness of what we can infer from an rCt, we concur with the european Commission’s Gprix project48 in believing that the statistical case for using an rCt methodology to evaluate a scheme like Creative Credits, where selection biases would otherwise potentially be severe, is overwhelming. our case is compounded by economic arguments for random assignment: unlike alternative approaches based on expert opinion on which firms are worthier of support than others, the selection process is cheap to administer, a not insignificant consideration when policymakers are facing a tight financial environment. We characterise the evaluation approach we developed in the Creative Credits experiment as ‘rCt+’, in that it combines an rCt–based quantitative assessment with longitudinal data collection and qualitative follow–up to help test the logic model in Figure 3.1. the
evaluation focuses on the ‘causative’ elements of the programme theory underlying the scheme. in other words, the evaluation objective is not just to assess the additionality of programme outcomes but also to consider whether these outcomes are being achieved through the mechanisms envisaged in the underlying programme theory.49 this requires a theoretically grounded analysis of process and causal mechanisms alongside the evaluation of outcomes.50 in empirical terms, this underlines the value of our methodological
approach: that of a mixed–methods evaluation combining a qualitatively structured
examination of underlying processes and decisions with a more quantitative assessment of causal process and outcomes.51
3.4 The Creative Credits experiment – implementation52
Creative Credits was piloted in the manchester City region in the north–West of england between september 2009 and october 2010.53 150 Creative Credits were distributed in two waves roughly six months apart. each Creative Credit had a face value of £4,000 with recipient firms also required to contribute a minimum of £1,000 towards the cost of the project with their creative partner. in fact, the average budget for the Creative Credits projects across the two waves was £5,400, with smes contributing in practice an average of £1,400 over and above the value of the Creative Credit.
the first wave of Creative Credits opened for applications in september 2009 and the second in February 2010. applications from smes were received and each of these were checked by nesta staff for eligibility. the Creative Credits scheme was open to smes (excluding sole traders) in almost any sector of the economy with the exceptions of primary industries and the creative industries. Creative Credits was marketed through various channels in the manchester City region. the regional partners played a crucial role in promoting the opportunity to relevant smes and creative businesses through Business link advisors, north West development agency networks, manchester City Council networks, and other business and financial advisors to smes. promotional efforts also included a regional media campaign, a launch event, email and telemarketing, as well as an online presence developed through Facebook and linkedin. more than 2,000 firms made an enquiry about the scheme through its two waves of operation. in the event, a total of 672 smes made eligible applications for the Creative Credits scheme: 312 in the first wave and 501 in the second, 141 applying in both waves.
amongst applicants, the sector with greatest representation was services, and in particular: Consultancy, professional services, General Business services and retail. no applications were received from the aerospace or medical sectors. applications were received from all boroughs included in the pilot. Figure 3.2 illustrates the geographical breakdown of the group of smes which received a Creative Credit compared with that for all applicants. the turnover of the group of firms applying for the scheme also varied relatively widely (Figure 3.3), although over one–half of all applicants had an annual turnover of less than £500,000. and within this group, a fifth of all applicants reported that their turnover was less than £100,000 per year.
Figure 3.2: percentages of applicants and recipients by borough
Figure 3.2: percentages of applicants and recipients by business size (turnover)
Percentage of applicants and recipients 0% 10% 5% 30% 25% 20% 15%
Recipients percentage Applicants percentage
Borough Bolt on Bury City of Manches ter City of Salf ord Conglet on
Macclesfield OldhamRochdaleStockportTameside T raff ord Vale R oyal Warringt on Wigan Percentage of applicants and recipients 0% 20% 10% 60% 50% 40% 30%
Recipients percentage Applicants percentage
Turnover £0 ‐ £499K £500K ‐ £999K £1M ‐ £1.4 9M £1.5M t o £1.99M £2M t o £2.4 9M £2.5M ‐ £2.99M £3M ‐ £3.4 9M £3.5M ‐ £3.99M £4M ‐ £4.4 9M £4.5M ‐ £4.99M £5M+ No ans wer
Comparing the group of Creative Credits applicants to the eligible population of companies in the mCr provides an indication of the penetration of the scheme. data from Companies House suggests that there were perhaps around 4,200 eligible firms in the mCr of which 672, or around 1:6, applied for the Creative Credits scheme.
applications were not, however, evenly spread across the size distribution of firms, with micro businesses (those with less than ten employees) and firms with more than fifty employees under–represented in the group of Creative Credits applicants, and firms with between ten and fifty employees significantly over–represented. Compared with the overall application proportion of 1:6, this meant that for the individual size bands the scheme penetration was: 1:8 for micro firms with less than 10 employees; 1:2 for firms with 10–50 employees and 1:16 for smes with more than 50 employees.
once applications had been received, a lottery of the eligible applications was held in each of the two waves to allocate Creative Credits, with 75 firms in each group being notified that they had been ‘awarded’ a Creative Credit. in addition, a small number of ‘reserve’ firms were also selected by lottery to replace those where the awarded Creative Credit was declined by the sme.54 in total, 22 per cent of the eligible businesses that applied were awarded a Creative Credit. For firms in the first wave these awards were made in october 2009, and in the second wave in march 2010.
subsequent to the award of their Creative Credits, smes were encouraged to identify a creative partner and develop a collaborative project proposal. to help with this process, a web–based marketplace – a ‘Creatives Gallery’ – of creative firms55 was designed and made available by nesta to all eligible smes in both the treatment and control groups. the majority of creative businesses on the Gallery classified themselves as offering ‘design or Web design’ (79 per cent), with 63 per cent of businesses listing this as their primary offering. over 50 per cent of businesses offered ‘advertising or pr’ as a service (20 per cent of businesses listed this as their primary service). twenty–four per cent of businesses offered ‘Film and video’ services; 9 per cent listed this as their primary service. very few businesses listed any other service as their primary offering. ‘software’ was not listed by any businesses as their primary service but it was offered as a secondary service by 13 per cent of creative businesses. ‘publishing’ and ‘tv and radio’ were also significant secondary services offered.
the aim of creating the online Gallery was to explore the potential for a minimal brokerage model and reduce the burden of administrative costs of the pilot – for the programme managers and the smes alike. smes awarded a Creative Credit were encouraged to navigate the Gallery on their own to select their preferred provider, and creative firms on the Creatives Gallery were also able to contact prospective sme partners, as per normal business practice.
in the event, the 150 Creative Credits were ‘spent’ with 79 creative service providers, with one service provider working with 13 Creative Credit recipients. once a partnership was formed, all Creative Credits projects were required to be completed within five months, i.e. by end–march 2010 for those in the first wave and mid–september 2010 for those in the second wave.
as discussed earlier, random allocation was used to avoid any systematic bias in the characteristics of treated firms and to help provide a more robust indication of the extent of additionality of Creative Credits.56 Care was taken wherever possible to minimise selection biases in the experiment: so, for example, in the promotion of the scheme,
randomized business lists were used in the marketing calls and care was taken to minimise locational or sectoral biases. details of the implementation of the randomization, and the rCt+ methodology within which it was embedded, are provided in annex 1.
the evaluation of the Creative Credits experiment began in september 2009 and aimed to consider both the scheme’s short–term additionality and its potential longer term outcomes. Qualitative and quantitative data collection comprised of two quantitative surveys at the start and finish of the Creative Credits project and two further surveys conducted six months and twelve months after its completion. Qualitative data collection was similarly conducted in four stages, in each case after the quantitative survey to avoid influencing the survey responses.
the initial quantitative baseline survey (survey 1) was conducted immediately after the lottery to award the Creative Credits. 451 responses were received – 150 from the treatment group (those awarded a Creative Credit), 301 from the control group (those who applied and were unsuccessful). over the next three surveys attrition was, as expected, evident in each survey (table a1.1 and Figure a1.1), and cash incentives were used to maximise response rates (though, as we discuss later, this does not appear to have induced any biases in our results57). By survey 4, a year after the Creative Credits projects finished, respondent numbers had fallen to 157 among the control group (52.2 per cent of those firms initially responding to survey 1) and 117 among the treatment group (78.0 per cent of survey 1 respondents). Comparison between the characteristics of respondents to all of the four surveys – the longitudinal sample – and those firms which dropped out confirm, however, that there are no systematic differences between firms who responded to all four surveys and those who dropped out during the study (table a1.2).
stages 1, 2 and 4 of the qualitative data collection consisted of semi–structured interviews (106 in total), while stage 3 comprised two workshops using the Journey making58
technique from operational research. smes in the treatment group and creative businesses working with them were both included in the process. as with the quantitative surveys, attrition was evident, especially amongst the creative businesses: the stage 1 interviews covered 24 pairings (smes and their creative partners), while by stage 4 this had fallen to 11 pairings, plus the ‘surviving’ partner of 9 further pairings in cases where the other business had closed or had withdrawn from the interview process. Further details of the samples and the qualitative research methodology are given in annex 1.
Section 4:
ThE CREATIvE CREdITS
ExPERImENT: RESulTS
Key points:
Creative Credits generated significant short–term network additionality, with the award of a Creative Credit increasing the likelihood that firms would undertake their innovation project (with a creative business they had not previously worked with) by at least 84 per cent.
the evidence also suggests there was statistically significant output additionality in the form of product and process innovations: in the six months immediately following the Creative Credits projects, firms were significantly more likely to have introduced product and process innovations than those that were not assigned Creative Credits. Creative Credits also had a (weakly) significantly positive effect on the sales growth of the treatment group after 6 months.
twelve months after the completion of the Creative Credits projects, however, there was no longer a statistically significant difference between the treatment and control groups in the proportion of smes innovating, nor in their sales growth, in the previous six months. though we note that only a minority of firms in the treatment group at the twelve–month stage reported having received the whole benefit from their Creative Credits projects. We go some way to validate the robustness of this particular finding by establishing a significant positive correlation between firms who said shortly after completing their projects (in survey 2) that they were expecting peak benefits in a year’s time and those who said that they had in fact done so after twelve months (in survey 4).
there was no evidence of network additionality after twelve months, or of
behavioural additionality: smes receiving Creative Credits were no more likely to have worked with creative service providers or other innovation partners than other firms. the qualitative research suggests two main reasons for this. First, in some cases smes felt that their Creative Credits project had been ‘transactional’ in nature – self– contained projects which could in principle have been undertaken with any number of innovation partners, and, second, in other cases there were clear incompatibilities between the smes and their creative partners, something which – according to some smes – nesta might have addressed if it had offered opportunities for brokerage in the scheme.
4.1 Introduction
in this section we focus on the results from implementing the rCt+ evaluation of Creative Credits. We test the different elements of the logic model outlined in section 3.2 and the longer term contribution of Creative Credits to strengthening smes’ open innovation partnerships. We begin in section 4.2 by assessing the short–term network additionality of the scheme, and in particular whether the award of a Creative Credit actually increased the probability that an sme went ahead with its project (with a creative partner with which they had not previously done business).
section 4.3 explores the scheme’s output additionality insofar as it impacted on levels of innovation activity and sales growth. data from surveys 3 and 4 provide an indication of levels of business innovation and sales growth in the period six months and twelve months respectively after the completion of the Creative Credits project. section 4.3 also provides an indication of the scheme’s longer term output additionality, as we also have information on the longer term (three–year) intentions of Creative Credits recipients. We use the information gleaned from the qualitative interviews to highlight some of the mechanisms shaping the outcomes and firms’ longer term intentions.
most of the quantitative results presented in this section are based on what we label the ‘longitudinal sample’, i.e. the group of firms in the treatment and control groups which responded to each of the four surveys covering the Creative Credits project period and the subsequent 12 months. this longitudinal sample comprises 274 firms (117 in the treatment group and 157 in the control group) or 60.8 per cent of all firms which responded to our initial baseline survey. attrition during the study period – drop out from the sample – occurred for a number of reasons, including firm closure and staff changes within smes; in addition, a number of firms were simply unwilling to complete all the surveys. annex 1 profiles the longitudinal sample in some detail and discusses the problem of attrition and how we have managed it. there were few systematic patterns among firms dropping out of the sample – in other words, firms completing all four surveys appeared to be representative of the wider group of smes participating in the scheme.
section 4.4 focuses on the behavioural and network additionality of Creative Credits relating to innovation cooperation – and particularly the likelihood of partnering with creative service providers – in the twelve months following completion of the projects. the findings of the qualitative research again provide deeper insights into the causal mechanisms shaping behavioural and network additionality.
Where results from the qualitative data are reported in the form of quotations or conclusions from interviews, each business has been allocated a letter and number to signify smes in the treatment group (s), their creative partners (C) and their participation in wave 1 or wave 2 of the experiment. so, for example, W1s1 relates to wave 1, sme 1. any unattributed quotes come from the ‘free format comments’ boxes in the quantitative surveys and therefore cannot be attributed under the non–disclosure terms of those surveys. annex 6 presents one–page case studies of three Creative Credits projects.
4.2 Network additionality of Creative Credits
in this section we exploit the randomized control trial structure of the Creative Credits experiment to consider its network additionality, i.e. by how much did the award of a Creative Credit increase the probability that an sme entered into a new relationship with a creative business?
all smes were able to access creative partners from the online Gallery and complete their innovation projects, whether or not they had been allocated a Creative Credit. of the 301 firms in the control group which responded to our baseline survey (survey 1), 36 firms (11.9 per cent) went ahead anyway with their projects within the scheme’s four to five–month project timeline. among the group of 150 firms which were assigned Creative Credits, 144 (96.0 per cent) actually commissioned projects. this group of 451 firms, of which 150 were Creative Credit recipients and 301 non–recipients, forms the basis for our estimate of network additionality.
the dependent variable in our analysis then takes a value of 1 if a firm commissioned the project within the four– to five–month Creative Credits timescale, and zero otherwise. table 4.1 reports the results from estimating this simple model using ordinary least
squares (ols). the coefficients have the following interpretation: without a Creative Credit a firm has a probability of 11.9 per cent of commissioning the innovation project (from a creative business with which it has not previously worked). this is (at least)59 84 per cent more likely when a firm receives a Creative Credit.60 this suggests strong network additionality of the receipt of a Creative Credit, with the 90 per cent confidence interval of the additionality lying between 78.2 and 89.8 per cent. this interval includes the estimated additionality of 79.0 per cent from the analysis undertaken for the pilot for the dutch national innovation vouchers scheme.61
the short–term network additionality of the Creative Credits scheme was strongly supported by the interviews conducted with smes immediately following the four to five month window within which the Creative Credits projects were completed, with 15 smes reporting that the Creative Credit had brought their innovation forward because of the cost saving (W1s3, W1s6, W1s8, W1s10, W1s12, W1s13, W2s1, W2s2, W2s4, W2s6, W2s7, W2s8, W2s10, W2s11, W2s12).
“I’d have waited. I’d have waited until we’d accumulated more money. And then probably programmed it in for sort of the back end of this year. And then launched in probably February next year.”
(w1S10)
“Maybe it’s allowed us to accelerate things and it’s perhaps made me focus on it rather than put things off. So it’s got things moving quicker than if I’d been left to my own devices.”
(w1S8)
“It’s something which I guess if we didn’t have the Credit it wouldn’t be the first thing on the top of my head. I wouldn’t say, ‘Oh I’m gonna make a video before doing say conferences’, and actually even now I couldn’t honestly say that, because I think in terms of importance I think probably getting out to conferences is more important at this stage. But, interestingly enough, if we ever get to the point where we were more comfortable and we did have a bit of spare cash, then actually I would think about another video because I do like the media and I think it’s quite powerful”.
Number of observations 451
Adjusted R–squared 0.653
variable Coefficient Std. Err. t–statistic Signif.
Creative 0.840 0.028 29.11*** 0.000
Credit
Constant 0.119 0.017 7.18*** 0.000
term
Table 4.1: simple ols treatment model regression
Notes: analysis is based on respondents to the initial baseline survey undertaken immediately after the allocation of Creative Credits. *** denotes significance at the 1 per cent level.
the ols estimates of additionality in table 4.1 implicitly assume that there are no
systematic differences between Creative Credits recipients and the control group of firms, other than in their receipt of a Creative Credit. this would of course follow by design of the rCt, but in small samples it is always possible such differences may arise, and there is some evidence that this is indeed the case for the pilot (see table a1.3). although the differences are very small, they may conceivably have introduced biases in the estimated coefficient on the treatment term, and it is important to investigate this.
to do this, we followed standard econometric procedures in estimating two–stage multivariate probit models to test the robustness of the ols results: in stage one, we modelled the probability of a firm receiving a Creative Credit as a function of firm
characteristics (table a4.1); and in stage 2 we estimated the impact of the Creative Credit on the probability of a firm undertaking its creative project (table a4.2). this analysis suggested that there was no selection bias in the estimates and therefore supports the validity of the simple ols results reported in table 4.1.62
4.3 Output additionality of Creative Credits – Innovation and sales impacts
table 4.2 explores whether firms that received Creative Credits were any more likely to have innovated in the period following the end of the Creative Credits projects than those firms that had not received Creative Credits.
in the six months following completion of the Creative Credits projects, we saw a marked difference between the treatment and control groups, with firms in the former significantly more likely to have introduced new products or services, more likely to have introduced new to the market products or services and more likely to have introduced new process innovations (table 4.2, part a).
a further six months on, however, the differences were no longer statistically significant (and were slightly negative in the case of process innovations) (table 4.2, part B).
Credits scheme, but that this additionality was short–lived. similar results are found in the multivariate analysis (tables a4.4 and a4.5), though there is weak evidence that firms receiving Creative Credits were more likely to have introduced new to market innovations even twelve months out.
Control Treatment t–statistic Signif.
N % firms % firms
A. After 6 months Product or service
innovation 145/105 55.9 72.4 2.740*** 0.007
New to the market
innovation 126/92 23.0 35.9 2.089** 0.038
Process innovation 142/105 47.2 63.8 2.618*** 0.009
Control Treatment t–statistic Signif.
N % firms % firms
B. After 12 months Product or service
innovation 154/113 63.0 70.8 1.345 0.180
New to the market
innovation 135/97 32.6 40.2 1.192 0.235
Process innovation 153/111 51.0 47.7 –0.517 0.606
Table 4.2: output additionality in terms of the probability of innovation: 6 months and 12 months after the completion of the Creative Credits projects
Notes: table is based on the longitudinal sample. see annex 1 for details, after six months, firms were asked whether they had produced more or fewer production innovations in the previous six months. after twelve months, firms were again asked about their innovation performance in the previous six months. differences in response numbers between questions and between 6 and 12 months reflect those respondents not answering particular questions and those selecting the (‘don’t know’) response. * denotes significance at the 10 per cent level; ** at 5 per cent and *** at the 1 per cent level.
We might have expected this pattern of significant, but not sustained, impacts from Creative Credits on innovation to have been echoed in the sales performance of firms, and this is indeed what we found. table 4.3 summarizes the distribution of sales growth of smes in the longitudinal sample receiving Creative Credits and those not, six and twelve months after the completion of the Creative Credits projects. although this period coincided with a period of deep economic recession, and therefore challenging times for all the smes in our study, the comparison of performance between treatment and control group firms is still statistically valid.
Impacts after 6 months* Impacts after 12 months
Control Treatment All Control Treatment All
N=146 N=107 N=253 N=155 N=114 N=269
Sales have fallen
20% or more 6.8 5.6 6.3 7.1 7.0 7.1
Sales have fallen
by 10–19% 6.8 4.7 5.9 9.0 6.1 7.8
Sales have fallen
by 1–9% 9.6 2.8 6.7 10.3 7.9 9.3
Sales have
remained similar 28.1 36.4 31.6 29.0 23.7 26.8
Sales have risen
by 1–9% 13.0 23.4 17.4 13.5 16.7 14.9
Sales have risen
by 10–19% 17.8 13.1 15.8 11.0 21.9 15.6
Sales have risen
20% or more 17.8 14.0 16.2 20.0 16.7 18.6
Average growth rates 6.445 7.53 6.9 4.71 7.81 6.02
Table 4.3: output additionality in terms of sales growth: 6 and 12 months after completion of Creative Credits projects
Notes: table is based on the longitudinal sample and responses. see annex 1 for details. after six months, firms were asked to select a band within which their sales had grown/fallen in the previous six months. after twelve months, firms were again asked to choose a band within which their sales had grown/fallen in the previous six months. For impact after six months, difference in distribution of growth rates between control and treatment groups χ2(6)=11.464, p=0.075; after 12 months χ2(6)=7.701, p=0.261. average growth rates derived using group means. differences in response numbers between different questions and between 6 and 12 months reflect those respondents not answering particular questions in the survey and those selecting the (‘don’t know’) response. * denotes significance at the 10 per cent level; ** at 5 per cent and *** at the 1 per cent level.
after six months (survey 3) we see a (weakly) significant difference between the distribution of growth rates of the control and treatment groups, with the award of the Creative Credit lowering the proportion of firms with declining sales (the p value of 0.075 means that there is only a 7.5 per cent probability of incorrectly rejecting the hypothesis that the growth rates of the two groups of firms were identical). after twelve months, although the difference in average growth rates was even bigger – at 3.1 per cent compared with 1.1 per cent after six months – it was no longer statistically significant. these results are confirmed by the multivariate analysis, where although sales growth of those smes receiving Creative Credits was higher on average than those in the control group, the differences were not statistically significant (table a4.6).