Commonwealth of Massachusetts
Board of Library Commissioners
648 Beacon Street Boston, Massachusetts 02215-2070
(800) 952-7403 in state (617) 267-9400 (617) 421-9833 fax
SUMMARY OF FINDINGS
:
SURVEY OF INTERNET ACCESS
IN MASSACHUSETTS PUBLIC LIBRARIES
Edward L. Bertorelli, Chairman Joseph S. Hopkins, Vice Chairman John E. Henderson, Secretary John E. Arnold
Deborah Hill Bornheimer Walter L. Cameron, Jr. Robert D. Hall, Jr. Elia D. Marnik Robert F. Mooney
Keith Michael Fiels, Director
Massachusetts Board of Library Commissioners
Dianne Carty, Head, State Aid & Data Coordination Joyce Cureton, Administrative Assistant
Deshala Dixon, State Aid Specialist Ann Downey, Systems Analyst
Mary Litterst, Planning and Research Specialist Massachusetts Board of Library Commissioners 648 Beacon Street
Boston, MA 02215
1-800-952-7403 or 267-9400, FAX 617-421-9833
Summary of Findings: Survey of Internet Access in Massachusetts Public Libraries
August 2000
Prepared with LSTA funds
Preparation of this report was supported in part by the U.S. Institute of Museum and Library Services. However, the opinions expressed herein do not necessarily reflect the position or policy of that agency, and no official endorsement by that agency should be inferred.
INTRODUCTION
In June 2000, a survey, (see Appendix A), was mailed to all of the 371 public libraries in
Massachusetts to gather information about public Internet access.
The survey instrument was developed with input from the Board of Library Commissioners and
agency staff, the Massachusetts Regional Library System Administrators and staff, and library
directors.
A total of 284, (76%), surveys were completed and returned.
Throughout this report, the results from the Massachusetts’ survey will be compared with the
results of a national study conducted by The Library Research Center of the Graduate School
of Library and Information Science at the University of Illinois for the American Library
Association, (Survey of Internet Access Management in Public Libraries. The Library Research
Center, Graduate School of Library and Information Science, University of Illinois: June, 2000).
SUMMARY
The survey revealed the following:
99% of reporting libraries have public access to the Internet.
Of those libraries with public Internet access:
86% have acceptable use policies.
38.7% have staff monitor public use of the Internet.
66% have sent staff for Internet training.
25% require parental permission for children to use a library computer to access the
Internet.
16% use filters on their public access computers.
Of those libraries using filters:
62% use filters on computers only in the children’s area.
49% have experienced technical difficulties with filtering software.
TABLE OF CONTENTS
INTRODUCTION and SUMMARY
i
SURVEY FINDINGS:
General
4
Acceptable Use Policies
4
Parental Permission
6
Monitoring Use of the Internet
7
Filtering
8
Internet Access Training
9
APPENDICES:
A.
Survey: Internet Access in Public Libraries
10
B.
Total Surveys Returned by Population
Group and Regional Library System
12
ii
Page
-4-SURVEY FINDINGS
GENERAL
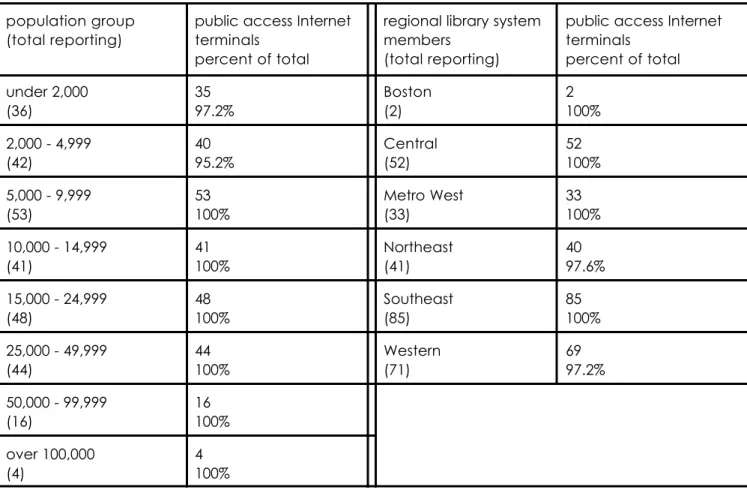
Of the 284 public libraries returning the questionnaire, 281, (98.9%), reported having computer
terminals with public access to the Internet.
table 1: public access Internet terminals
population group(total reporting) public access Internetterminals percent of total
regional library system members
(total reporting)
public access Internet terminals percent of total under 2,000 (36) 35 97.2% Boston (2) 2 100% 2,000 - 4,999 (42) 4095.2% Central(52) 52100% 5,000 - 9,999 (53) 53100% Metro West(33) 33100% 10,000 - 14,999 (41) 41100% Northeast(41) 4097.6% 15,000 - 24,999 (48) 48 100% Southeast (85) 85 100% 25,000 - 49,999 (44) 44100% Western(71) 6997.2% 50,000 - 99,999 (16) 16100% over 100,000 (4) 4100%
ACCEPTABLE USE POLICIES
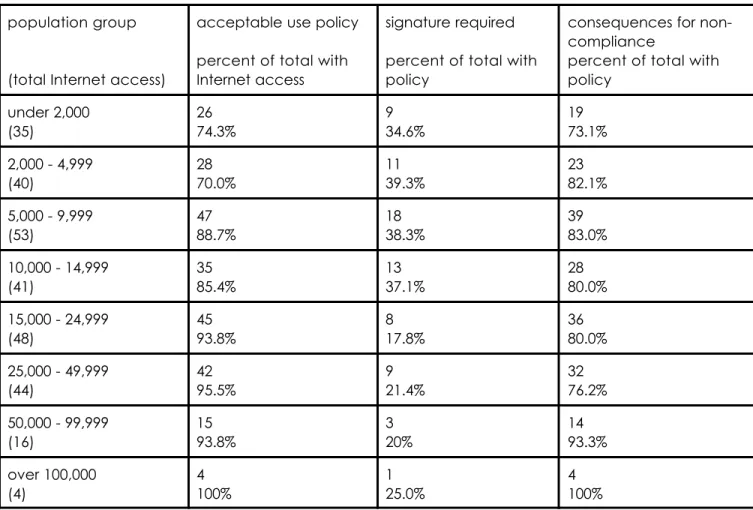
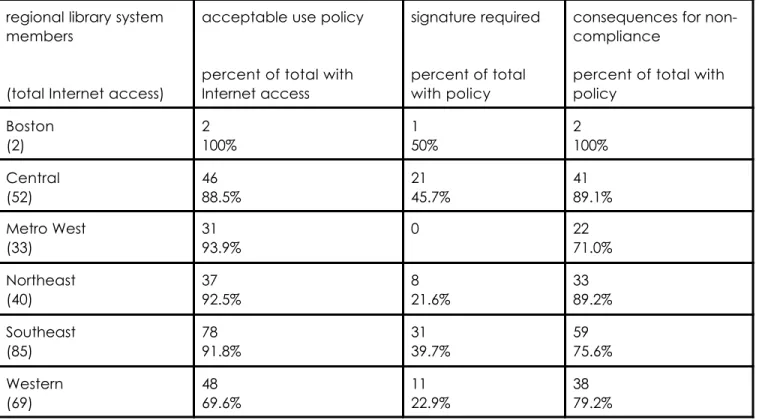
In Massachusetts, of the libraries with public Internet access, 242, (86%), report having an
acceptable use policy. In the ALA sponsored national study 94.7% of the libraries with public
Internet access had a “formal (written) policy or guidelines.” In only 82 , (34%), of
Massachusetts public libraries with acceptable use policies is there a distinction between adults
Page
-5-and minors.
All but ten libraries make the acceptable use policy available to the public in one or more of
the following ways: at a public service desk, posted near computers, posted in the library, or
on request.
More libraries, (195), impose consequences for noncompliance with the acceptable use policy
than require a user to sign the policy, (72). Nearly fifteen times, (163 versus 11), as many libraries
invoke loss of Internet privileges rather than loss of library privileges when a user has violated
the acceptable use policy. Some libraries also have other consequences for non compliance
such as speaking directly to the patron or asking the patron to leave for the day. Twenty
libraries use a combination of consequences to deal with violators.
table 2a: acceptable use policies by population group
population group(total Internet access)
acceptable use policy percent of total with Internet access
signature required percent of total with policy
consequences for non-compliance
percent of total with policy under 2,000 (35) 2674.3% 934.6% 1973.1% 2,000 - 4,999 (40) 2870.0% 1139.3% 2382.1% 5,000 - 9,999 (53) 4788.7% 1838.3% 3983.0% 10,000 - 14,999 (41) 3585.4% 1337.1% 2880.0% 15,000 - 24,999 (48) 4593.8% 817.8% 3680.0% 25,000 - 49,999 (44) 4295.5% 921.4% 3276.2% 50,000 - 99,999 (16) 1593.8% 320% 1493.3% over 100,000 (4) 4100% 125.0% 4100%
Page -6-regional library system
members
(total Internet access)
acceptable use policy percent of total with Internet access
signature required percent of total with policy
consequences for non-compliance
percent of total with policy Boston (2) 2100% 150% 2100% Central (52) 46 88.5% 21 45.7% 41 89.1% Metro West (33) 3193.9% 0 2271.0% Northeast (40) 3792.5% 821.6% 3389.2% Southeast (85) 7891.8% 3139.7% 5975.6% Western (69) 4869.6% 1122.9% 3879.2%
PARENTAL PERMISSION
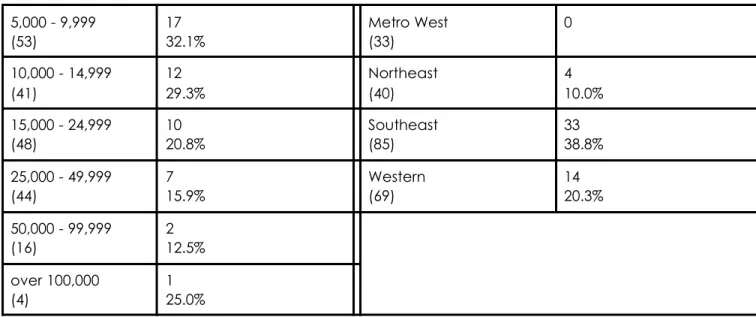
Directors of seventy-two public libraries, 25% of those with Internet access, reported that
parental permission is required for minors to access the Internet in their libraries. This is less than
the two-thirds reported in the national study conducted for ALA.
The national study found that the parental permission requirement correlated inversely to the
population served. This is true also in Massachusetts, except for either end of the population
spectrum, the under 2,000 and the over 100,000 groups.
table 3: parental permission
population group(total Internet access)
parental permission required
percent with access
regional library system members
(total Internet access)
parental permission required
percent with access under 2,000 (35) 9 25.7% Boston (2) 1 50.0% 2,000 - 4,999 (40) 1435.0% Central(52) 2038.5%
Page -7-5,000 - 9,999 (53) 1732.1% Metro West(33) 0 10,000 - 14,999 (41) 12 29.3% Northeast (40) 4 10.0% 15,000 - 24,999 (48) 1020.8% Southeast(85) 3338.8% 25,000 - 49,999 (44) 715.9% Western(69) 1420.3% 50,000 - 99,999 (16) 2 12.5% over 100,000 (4) 125.0%
MONITORING USE OF THE INTERNET
Staff in 109, (38.7%), public libraries monitor use of the Internet. Most of these staff members,
84%, monitor all people using library computers to access the Internet. The rest of the libraries
have staff who monitor only children’s usage of the Internet. It is noteworthy that staff
monitoring of Internet use increases as the population size of the community increases.
Several directors said that because the computers are located in close proximity to the
reference desk, the staff can see the computer screens. Others said that they monitor on an
informal or infrequent basis.
table 4: monitoring use of the Internet
population grouping(total Internet access)
monitoring of use percent of total with access
regional library system members
(total Internet access)
monitoring of use percent of total with access under 2,000 (35) 11 31.4% Boston (2) 0 2,000 - 4,999 (40) 14 35.0% Central (52) 20 38.5% 5,000 - 9,999 (53) 1935.8% Metro West(33) 1236.4% 10,000 - 14,999 (41) 1843.9% Northeast(40) 2050.0%
Page -8-15,000 - 24,999 (48) 1939.6% Southeast(85) 3338.8% 25,000 - 49,999 (44) 18 40.9% Western (69) 24 34.8% 50,000 - 99,999 (16) 850.0% over 100,000 (4) 250.0%
FILTERING
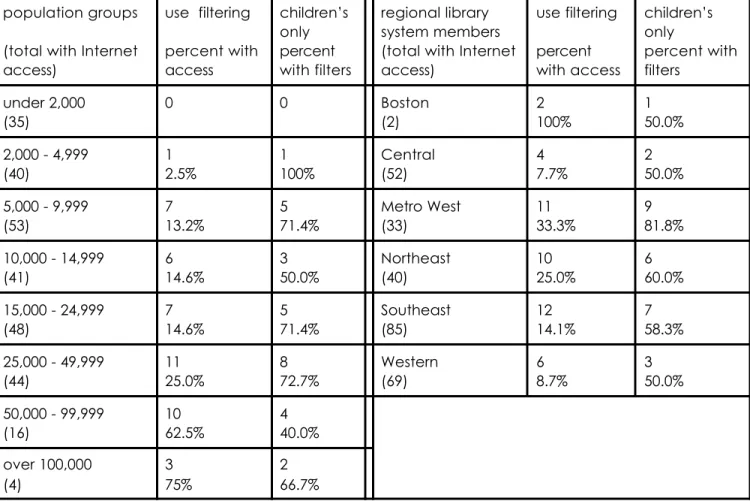
Only 45 library directors reported using filtering techniques on computers in their libraries. That
is only 16% of those libraries with public access to the Internet. The national study reported very
similar results. In that study 16.8% of libraries reported use of filtering. As in the national study,
Massachusetts libraries in larger communities are more likely to use filters. In the group of 50,000
to 99,999, 62% of the libraries use filters while in the under 2,000 group no libraries report using
filters. In 28 of the 45 libraries, (62%), filtering software is used only on computers in the children’s
area.
Visitors to the library are informed of the use of filters to Internet access in several ways. Library
directors reported posting the information at a public service desk, near the computers and
in a general spot in the library. Additionally the library's web site, the scroll bar on the computer
and inclusion in the acceptable use policy were mentioned.
All but two of the 45 libraries use filtering software. The other two use an existing search engine
to provide a filtering screen for them. The most popular software, Cyber Patrol, is used by 31
libraries. The remaining libraries use on of the following: SurfWatch, Sonic Wall, Net Nanny and
CYBERsitter. Site blocking and key word blocking features are used by all libraries except three.
These libraries reported blocking chat rooms and site families, and using proxy-based filtering.
Over half, (24), of the libraries using filters reported that staff override the software to meet the
reference needs of children. Although most directors, (22), indicated that it was required only
rarely.
Only six of the 45 libraries allow users to self select the filtering software. Most of the libraries
that use filters on the children's computers, (33 out of 41), have non-filtered computers
Page
-9-available elsewhere.
The survey asked directors if they had experienced any technical problems with the filtering
software. Almost half, (49%), of the libraries that use filtering software reported encountering
technical problems. Half of those libraries had computers freeze when using the software and
several mentioned memory problems. The rest had other problems such as conflicts with other
software and email, frequent updates to manage, slow computer response time and random
and inappropriate blocking of web sites.
table 5: filtering
population groups (total with Internet access) use filtering percent with access children’s only percent with filters regional library system members (total with Internet access) use filtering percent with access children’s only percent with filters under 2,000 (35) 0 0 Boston(2) 2100% 150.0% 2,000 - 4,999 (40) 12.5% 1100% Central(52) 47.7% 250.0% 5,000 - 9,999 (53) 713.2% 571.4% Metro West(33) 1133.3% 981.8% 10,000 - 14,999 (41) 614.6% 350.0% Northeast(40) 1025.0% 660.0% 15,000 - 24,999 (48) 714.6% 571.4% Southeast(85) 1214.1% 758.3% 25,000 - 49,999 (44) 1125.0% 872.7% Western(69) 68.7% 350.0% 50,000 - 99,999 (16) 1062.5% 440.0% over 100,000 (4) 3 75% 2 66.7%TRAINING
At least some staff at 66% of libraries responding to the survey question asking about training,
(177 out of 268), have attended Internet access workshops offered by the regional library
systems. Fourteen libraries have sent all of their staff for training.
Page
-10-survey found that 46.2% of libraries providing public access to the Internet offered classes or
workshops for users of the library.
SAMPLE
Page
-11-APPENDIX A:
Survey: Internet Access in Public Libraries
Commonwealth of Massachusetts
Board of Library Commissioners
648 Beacon Street • Boston, Massachusetts 02215-2070 (800) 952-7403 in state • (617) 267-9400 • (617) 421-9833 faxInternet Access in Public Libraries
Return to: Joyce Cureton by June 30, 2000.
Questions? Contact Dianne L. Carty at any of the above numbers or
[email protected].
1. Does your library have computer terminals with public access to the Internet?
yes __ no __
If no, please sign on the reverse side and return this form. If yes, please continue with the rest of this survey.
2. Does the library have an “acceptable use” or other policy controlling public Internet access?
yes __ no __
If yes,
a. does the policy differentiate between adults and minors?
yes __ no __
b. how is policy made available to the public?
__ at public service desk __ posted near computers __ posted in library __ available on request
c. are there consequences for non-compliance with the use policy?
yes __ no __
If yes, what are the consequences?
__ loss of library privileges __ loss of Internet privileges
__ other:_________________________________________________________________ 3. Are users required to sign an acceptable use form?
yes __ no __
4. Is parental permission required for minors to access the Internet?
yes __ no __
5. Does library staff monitor the Internet usage by patrons?
yes __ no __
If yes, all patrons __ minors only __
6. Does the library use technological measures (e.g., filtering software) to block the public from accessing certain Internet web sites ?
yes __ no __
if yes,
SAMPLE
Page -12-__ filtering software, please list:-12-__-12-__-12-__-12-__-12-__-12-__-12-__-12-__-12-__-12-__-12-__-12-__-12-__-12-__-12-__-12-__-12-__-12-__-12-__-12-__-12-__-12-__-12-__
__ third party (outsourced on-line)
__ existing search engine blocks (e.g., Yahoo)
b. on which public access computers are these measures used? __computers in children’s area only
__computers outside of the children’s area only
__computers both inside and outside of the children’s area, but not all __all of the computers in library
c. can the user self-select these filtering measures on some or all computers?
yes __ no __
d. if terminals in the children’s area use filtering measures, can children use non-filtered terminals elsewhere?
yes __ no __
e. how is public informed that filtering measures are used?
__ at public service desk __ posted in library __ posted near computers __ other (please specify:__________________________________________________) 7, If filtering software is used,
a. what types of filters are used?
__site blocking __keyword blocking
__other (please specify)_________________________________________________ b. does staff override filtering software to satisfy the information needs of minors?
yes __ no __
If yes, how often?
__more than once per week __once per week
__once per month __rarely
c. have you had technical problems with the filtering software?
yes __ no __
If yes, (check all that apply)
__memory problems/conflicts__causes computers to freeze
__other (please specify)_______________________________________________
8. Have library staff attended Internet access workshops offered by the regional library systems ? (topics covered include: filtering, access and use policies, etc.)
yes, all staff __ yes, some staff __ no __
9. Has the library offered Internet access workshops for their patrons ? (topics covered include: filtering, access and use policies, etc.)
yes __ no __
person to contact for more information:
name_______________________________________________title______________________________________ telephone___________________________________________email___________________________________ date______________________________
Page
-13-APPENDIX B
:
Total Number of Surveys Returned by Population Group and Regional
Library System
population
group populationgroup total in group population group total reporting regional library system regional library system members total in system regional library system members total reporting under 2,000 59 36 61.0% Boston 3 266.7% 2,000 - 4,999 54 42 77.8% Central 72 5272.2% 5,000 - 9,999 70 53 75.7% Metro West 38 3386.8% 10,000 - 14,999 55 41 74.5% Northeast 54 4175.9% 15,000 - 24,999 53 48 90.6% Southeast 101 85 84.2% 25,000 - 49,999 58 44 75.9% Western 103 7168.9% 50,000 - 99,999 18 16 88.9% total municipalities = 351 total libraries = 371
(towns with no library = Hawley, New Ashford, Washington)
over 100,000 4 4