Florida International University
FIU Digital Commons
FIU Electronic Theses and Dissertations University Graduate School
6-30-2017
Describing and Mapping the Interactions between
Student Affective Factors Related to Persistence in
Science, Physics, and Engineering
Jacqueline Doyle
Florida International University, [email protected]
DOI:10.25148/etd.FIDC001978
Follow this and additional works at:https://digitalcommons.fiu.edu/etd
Part of theEngineering Education Commons, and theOther Physics Commons Recommended Citation
Doyle, Jacqueline, "Describing and Mapping the Interactions between Student Affective Factors Related to Persistence in Science, Physics, and Engineering" (2017).FIU Electronic Theses and Dissertations. 3353.
FLORIDA INTERNATIONAL UNIVERSITY Miami, Florida
DESCRIBING AND MAPPING THE INTERACTIONS BETWEEN STUDENT AFFECTIVE FACTORS RELATED TO PERSISTENCE IN SCIENCE, PHYSICS,
AND ENGINEERING
A dissertation submitted in partial fulfillment of the requirements for the degree of
DOCTOR OF PHILOSOPHY in PHYSICS by Jacqueline Doyle 2017
To: Dean Michael R. Heithaus
College of Arts, Sciences and Education
This dissertation, written by Jacqueline Doyle, and entitled Describing and Mapping the Interactions Between Student Affective Factors Related to Persistence in Science, Physics, and Engineering, having been approved in respect to style and intellectual content, is referred to you for judgment.
We have read this dissertation and recommend that it be approved.
_____________________________________ Zahra Hazari _____________________________________ Joerg Reinhold _____________________________________ Laird Kramer _____________________________________ Geoff Potvin, Major Professor
Date of Defense: June 30, 2017
The dissertation of Jacqueline Doyle is approved.
_____________________________________ Dean Michael R. Heithaus College of Arts, Sciences and Education
_____________________________________ Andrés G. Gil Vice President for Research and Economic Development and Dean of the University Graduate School
© Copyright 2017 by Jacqueline Doyle All rights reserved.
ABSTRACT OF THE DISSERTATION
DESCRIBING AND MAPPING THE INTERACTIONS BETWEEN STUDENT AFFECTIVE FACTORS RELATED TO PERSISTENCE IN SCIENCE, PHYSICS,
AND ENGINEERING by
Jacqueline Doyle
Florida International University, 2017 Miami, Florida
Professor Geoff Potvin, Major Professor
This dissertation explores how students’ beliefs and attitudes interact with their identities as physics people, motivated by calls to increase participation in science, technology, engineering, and mathematics (STEM) careers. This work combines several theoretical frameworks, including Identity theory, Future Time Perspective theory, and other personality traits to investigate associations between these factors. An enriched understanding of how these attitudinal factors are associated with each other extends prior models of identity and link theoretical frameworks used in psychological and educational research. The research uses a series of quantitative and qualitative methodologies, including linear and logistic regression analysis, thematic interview analysis, and an innovative analytic technique adapted for use with student educational data for the first time: topological data analysis via the Mapper algorithm.
Engineering students were surveyed in their introductory engineering courses. Several factors are found to be associated with physics identity, including student interest
in particular engineering majors. The distributions of student scores on these affective constructs are simultaneously represented in a map of beliefs, from which the existence of a large “normative group” of students (according to their beliefs) is identified, defined by the data as a large concentration of similarly minded students. Significant differences exist in the demographic representation of this normative group compared to other students, which has implications for recruitment efforts that seek to increase diversity in STEM fields. Select students from both the normative group and outside the normative group were selected for subsequent interviews investigating their associations between physics and engineering, and how their physics identities evolve during their engineering careers.
Further analyses suggest a more complex model of physics and engineering identity which is not necessarily uniform for all engineering students, including discipline-specific differences that should be further investigated. Further, the use of physics identity as a model to describe engineering student choices may be limited in applicability to early college. Interview analysis shows that physics recognition beliefs become contextualized in engineering as students begin to view physics as an
TABLE OF CONTENTS
CHAPTER PAGE
Chapter I: Introduction ... 1
Research Questions ... 5
Background and Literature Review ... 5
Intersectionality... 7
Identity framework... 9
A note about social cognitive career theory ... 10
Other salient theoretical constructs ... 11
Relationship Between Theoretical Frameworks ... 18
Chapter II: Survey Development and Deployment ... 20
Survey Development ... 20
Survey Deployment ... 24
Chapter III: Attitudes associated with Physics Identity ... 26
Introduction ... 26
Motivating the search for discipline-specific effects ... 26
Research Questions ... 27
Methodology ... 27
Results of the Primary Model ... 31
Discussion and Interpretation of the Primary Model ... 40
Results and Discussion of the Secondary Models ... 47
Differences with the Primary Model... 49
Implications and Directions for Future Work ... 50
Limitations of this Study ... 52
Chapter IV: Topological Mapping of Student Affective Factors ... 54
Challenges of Intersectionality in Quantitative Research ... 55
Another Approach to Understanding Student Diversity: Cluster Analysis ... 56
Topological Data Analysis as a Means of Clustering ... 57
Topological Data Analysis in InIce ... 57
Methodology ... 58
Description of InIce Survey ... 58
Attitudinal Factors ... 59
Survey Demographics and Self-Identification ... 64
Requirements to perform TDA using Mapper ... 65
The Mapper Clustering Algorithm... 69
Chosen Filter Function for InIce Data ... 71
Advantages of TDA over other Cluster Analyses... 72
Challenges of using TDA and Mapper with Quantitative Student Data ... 77
Results ... 80
Group Attitudinal Differences ... 82
Differences in Major Interest between the Groups ... 87
Demographic Differences Between Groups ... 88
Conclusions and Implications ... 95
Variability in the Normative and Near-normative Groups ... 95
Attitudinal and Demographic Diversity ... 96
Limitations of this Study ... 99
Directions for Future Work ... 100
Chapter V: Time-Dependent Characterization of Physics Identity ... 102
Introduction ... 102
Methodology ... 104
Choice of Participants ... 105
About the Participants ... 108
Choice of Questions in Interview Protocol ... 111
Results and Analysis ... 112
Salience of Physics Identity to Students’ Engineering Experience ... 113
Discussion ... 124
Engineering as applied physics, increasingly distinct from physics ... 124
Physics identification anchored by performance, shifting to engineering ... 125
Conclusions and Implications ... 128
Limitations of this Study and Directions of Future Work ... 129
Chapter VI: Conclusions ... 131
Introduction and Summary of Findings ... 131
Summary of Answers to Research Questions ... 132
Conclusions and Implications ... 134
Implications for Education Researchers ... 134
Implications for Educators and Administrators ... 136
Future Directions ... 137
LIST OF REFERENCES ... 139
APPENDICES ... 147
LIST OF TABLES
TABLE PAGE
Table 1 - Abbreviations used for majors... 29
Table 2 - Factor Loadings for Physics Identity sub-constructs... 31
Table 3 - Factor loadings for Belongingness ... 32
Table 4 - Factor loadings for constructs from Grit ... 32
Table 5 - Factor loadings constructs from Achievement Goal Theory ... 33
Table 6 - Factor loadings for constructs from Expectancy-Value Theory and FTP ... 34
Table 7 - Factor loadings for constructs from Agency Beliefs ... 35
Table 8 - Factor loadings for constructs from the "Big 5" Psychological Traits ... 36
Table 9 - Factor loadings for constructs related to Math Identity ... 37
Table 10 - Factor loadings for constructs related to Engineering Identity ... 38
Table 11 - Linear model of physics identity by attitudinal factors. ... 39
Table 12 - Linear regression predicting Belongingness with Physics Identity ... 41
Table 13 - Summarized expanded models ... 47
Table 14 - Decision matrix to select a subset of factors ... 62
Table 15 - Attitudinal differences between groups ... 84
Table 16 - Differences in major interest between NG and DG ... 87
Table 17 - Odds ratio of membership in NG predicted by gender... 90
Table 18 - Odds ratio of membership in NG predicted by race/ethnicity ... 90
Table 19 - Odds ratio of membership in NG predicted by gender and race/ethnicity ... 91
Table 20 - Odds ratio of membership in NGG predicted by combined factor ... 91
Table 21 - Reference level probabilities ... 92 Table 22 - Pairwise distances between interview participants and the normative group 109
Table 23 - Summary of selected student demographic information ... 111 Table 24 – Interview participant physics identity sub-construct scores ... 111 Table 25 - Interview protocol blocks asked to each participant ... 112
LIST OF FIGURES
FIGURE PAGE
Figure 1 – Polyserial correlation between having a declared major and interest score. ... 29
Figure 2 - Density estimates for responses to Q14 ... 30
Figure 3 – Correlation plot between factors ... 61
Figure 4 – Histogram of filter values. ... 72
Figure 5 - Example barcode diagram ... 75
Figure 6 - Mapper algorithm being applied to example data. ... 76
Chapter I: Introduction
The President’s Council of Advisors on Science and Technology has argued for increasing the number of STEM graduates by approximately one million over the next decade when the report was issued in 2012, in order to maintain economic
competitiveness, growth, and quality of life in the United States (National Academies, 2007, 2010; President’s Council of Advisors on Science and Technology, 2012). The shortage of STEM professionals is particularly pertinent to the fields of physics and engineering where fewer women, African Americans, and Hispanics graduate than what is commensurate with their population sizes (NRC, 2013). The President’s Council’s primary suggestion to achieve this goal was to increase undergraduate retention of STEM majors; 48 percent of students who entered STEM fields at the start of the 2003-2004 academic year seeking their bachelor’s and 69 percent of those seeking their associate’s degree had left by spring 2009 (Chen & Soldner, 2013). While these rates are comparable with other fields like humanities, health sciences, and business, they nevertheless reveal a massive loss of majors which, if it could be reduced by as little as 10%, would result in hundreds of thousands of additional students graduating in STEM fields. Therefore, an understanding of which factors are related to or lead to increased persistence (and thus reduced attrition) is key to achieving this goal of more graduates. Further, because “identification with a group or community of STEM professionals may overshadow many other factors in determining persistence” (President’s Council of Advisors on Science and Technology, 2012), the current work maintains a focus on identity in particular among several theoretical frameworks.
Introductory-level university physics courses (both algebra-based and calculus-based) are taken by students in a wide range of STEM majors, only a small fraction of which are physics majors. Instead, these courses serve the undergraduate STEM population as a whole and provide some physics instruction for students with a wide variety of career intentions. One large sub-population of students taking introductory college physics is engineering majors, many of whom will use physics-related ideas throughout their studies and will pursue careers in the physical sciences/engineering.
A wide variety of theoretical frameworks either directly address student persistence, engagement, and retention, or have been linked to them in prior research. Student identification with physics, as described in the identity framework of Hazari et al. (Hazari, Sonnert, Sadler, & Shanahan, 2010), Carlone (Carlone & Johnson, 2007), etc. has been found to be a strong predictor of student persistence in physics, and intentions related to a career in physical science (Godwin, Potvin, Hazari, & Lock, 2016). Other affective factors have been separately studied in the context of student science-related performances. For example, a students’ sense of belongingness has been linked to persistence in their college program and their performance (Freeman, Anderman, & Jensen, 2007; Pittman & Richmond, 2008). Also, the personality traits of grit and
conscientiousness have been consistently associated with academic success and
persistence (Duckworth, Peterson, Matthews, & Kelly, 2007; Trapmann, Hell, Hirn, & Schuler, 2007). The Big Five personality traits (McCrae & John, 1992) have also been linked to academic motivation (Clark & Schroth, 2010; Komarraju, Karau, & Schmeck, 2009). And foremost, student identity as a science, physics, or engineering person has been linked with performance, retention, and eventual career choice in a STEM field
(Carlone & Johnson, 2007; Godwin et al., 2016; Hazari et al., 2010; Plett, Hawkinson, Vanantwerp, Wilson, & Bruxvoort, 2011). However, many of these studies have focused, for theoretical or practical reasons, on a single affective factor in any one study, rather than exploring the relative role of several at one time, though there are some exceptions which examine a handful of related factors at one time (e.g., Grit and the Big Five (Duckworth et al., 2007)).
In this dissertation, I examine the attitudes of engineering students, with a focus on their physics identities and related attitudinal constructs. Physics identity has been previously found to be a critical predictor of engineering-related career choices at the precollege-to-college transition (Godwin et al., 2016). Specifically, in a nationally-representative study of college freshmen, three factors were found to be predictive of engineering choice in college: students' precollege physics and math identities, and their
agency beliefs: beliefs in the power of science and engineering to impact one's life and the world around oneself. Unlike other domains, students who pursue engineering majors in college often have few direct engineering experiences or course-taking (Katehi, 2009), so the importance of identities in other related domains—physics and math—is increased. Once students gain a number of direct engineering experiences—say, by taking college engineering courses—then the importance of a physics or math identity to their
engineering pursuits may diminish over time. At the start of college, these other domain identities remain quite relevant, which is why the current study focuses on early college experiences.
chapter. I describe the theoretical frameworks informing the current work and the affective constructs from each that were measured and analyzed in the subsequent chapters. The chapter finishes with a description of the survey used to collect the initial student data.
Chapter 2 addresses the first two research questions through multiple linear regression analysis. I present two regression analyses: the first looks at which affective constructs are significantly related to students’ physics identities, while the second analysis includes interactions with students’ interest in particular engineering majors to examine whether the pattern of significance is different for various groups.
Chapter 3 answers the third and fourth questions by introducing topological data analysis, a new method in education research used to construct a representation of the space of affective beliefs. I combine it with traditional statistical analyses (proportion tests, logistic regression, and various tests of difference in means) to understand the representation and look for significant effects in both attitudes and the representation of traditionally-underrepresented demographics.
Chapter 4 builds on the results of the previous chapter by qualitatively analyzing interviews from individuals selected using the results from Chapter 3 to answer the final two questions. Interviews were coded by thematic phenomenological analysis, and the results are presented and discussed.
Chapter 5 finishes the dissertation by reflecting on the findings of each chapter in toto and in combination and discussing implications and directions for future work.
Research Questions
This dissertation seeks to answer the following questions throughout its chapters: Chapter 2:
1. For the introductory engineering students at the four collaborating institutions, how are various attitudinal factors associated with students’ physics identity beliefs? 2. How are the associations identified in Research Question 1 mediated by students’
interests in various engineering disciplines? Chapter 3:
3. How are students distributed in the space of affective beliefs?
4. What demographic differences exist between students holding normative beliefs and those with non-normative beliefs?
Chapter 4
5. How do students’ perceived connections between engineering and physics change as they become more experienced in engineering?
6. How does the nature of students’ physics recognition beliefs change over time? Background and Literature Review
Increasing the diversity in engineering education has been a priority of educators and education researchers for at least the past 30 years. Despite years of research and reform, the enrollment of demographically diverse individuals in undergraduate engineering degree programs has not substantially improved. In much work that has studied diverse student experiences, an approach is often taken to divide students on the
female; etc.). These categorizations often serve to bin students and generalize findings for women or underrepresented minority students in a way that seeks to highlight the issues faced by underrepresented groups and/or identify ways to support such students
effectively. However, one limitation of this general approach is that it often ignores the multitude of identities and holistic experiences of individuals that combine uniquely for every person. That is, such a traditional approach to understanding diversity does not take into account the rich and nuanced differences in individuals’ experiences. Further, this approach of binning students into predefined demographic categories may not faithfully account for the true spectrum of motivations, attitudes, and goals of individual students since people with a variety of affects may be “binned” together as a
presumed-homogenous group, thus missing out on a more nuanced and faithful understanding of students, as demographic diversity does not necessarily have a one-to-one relationship with affective diversity.
Examining the multi-faceted aspects of student identities can provide a more holistic understanding of students’ attitudes and beliefs than examining just one particular dimension of students’ identities. Individuals have multiple overlapping identities that comprise their affiliations, experiences, attachments, and social engagement.
Foregrounding just one of these identities in an analysis potentially limits the richness of understanding a person as a whole and how their multiple identities impact how they are positioned and position themselves in the world.
Intersectionality
An approach to understanding multiple overlapping identities has its roots in intersectionality theory. Originating from critical legal studies (Crenshaw, 1989, 1991), the theory examines how multiple intersecting identities form interacting layers of oppression in society. Kimberlé Crenshaw (1989) first put forward this understanding of how identities intersect from her experience studying case law. In one case, Emma DeGraffenreid et al. v. General Motors Assembly Division (1977), a woman of color, Emma DeGraffenreid, was fired from General Motors. She and four other Black women brought legal suit against the company citing discriminatory labor practices. In the company, white women did one set of jobs (mostly secretarial) and white men did another set of jobs (management). Additionally, Black individuals were hired in the hands-on labor jobs while white individuals did the clerical or office jobs. The issues for Black women were compounded. Jobs for Black individuals were “men’s jobs”, and the jobs for women were “white jobs”. Black women faced double challenges when applying for positions within the company. When the case came to court, the judge dismissed the case citing that the company had representative numbers of both Black employees and female employees. The court would not allow the claimants to combine racism and sexism into one suit. Because Emma could not demonstrate that the discrimination she faced was along purely racial or gender lines, she could not prove her claim. This injustice allowed the intersections of both race and gender to be ignored and prompted Crenshaw to develop the theory of Intersectionality.
identified different variations in experience for Black women. Sometimes they had similar experiences to Black men or to white women. Other times, they faced additive or multiplicative effects (“double discrimination”), whereas in other cases, they had
particular experiences specific to their status as Black women. It is important to note that some members of disadvantaged groups also hold, in part, privileged identities (e.g., middle-class Blacks, White women in STEM). These variations of experiences reveal that although much of the literature on intersectionality has been theorized from the standpoint of those who experience multiple dimensions of disadvantage, this framework can also inform how privileged groups are understood (Cole, 2009).
The present study utilizes intersectionality theory in a new way to better
understand the underlying attitudes and beliefs of students. Rather than pursuing a critical analysis of power and positionality, I instead use it as a guiding principle in examining multiple intersections of students’ attitudes, beliefs, and identities to more faithfully understand the students who are pursuing college engineering and what underlying attitudes might be privileged within engineering culture. Approaching research with a mind towards intersectionality provides a different, but complementary, way to understand the nuanced differences and similarities among engineering students. I acknowledge that my focus is on the intersections of student identities and not on a critique of power and positionality within the existing social structures of engineering programs. This approach enables an understanding of underlying attitudes and beliefs, influenced by college engineering students’ incoming attitudes, that shape students’ experiences within engineering, reify engineering culture, and promote or deter an individual’s persistence in engineering.
Identity framework
Identity is a framework of analysis (Chachra, Kilgore, Loshbaugh, Mccain, & Chen, 2008; Gee, 2000) used to study student engagement, belonging, and persistence in STEM, including physics, mathematics, and engineering (Cass, Hazari, Cribbs, Sadler, & Sonnert, 2011). Very broadly, one’s identity describes how they see themselves and interact with the world. One can hold many different identities, corresponding to different spheres of life, activating each identity when it is relevant.
In the context of my study, physics identity can be thought of as the extent to which someone sees themselves as a “physics person” (Lock, Castillo, Hazari, & Potvin, 2015); likewise, someone with a strong math identity sees themselves as a “math person”, and someone with a strong engineering identity sees themselves as an engineer. In the framework developed by Hazari et al, it is conceptualized as a quasi-trait—something which is relatively stable but which can change over time as a result of experiences (Cribbs, Sadler, Hazari, Conatser, & Sonnert, 2013; Hazari et al., 2010; Potvin & Hazari, 2013). A student’s identity is constructed of three sub-constructs (Carlone & Johnson, 2007; Godwin, Potvin, & Hazari, 2013; Hazari et al., 2010). Performance/Competence beliefs, originally constructed as two separate factors (Hazari et al., 2010) which were experimentally indistinguishable in repeated measurements of students in high school or early college (Potvin & Hazari, 2013), describes a student’s belief in their ability to succeed at physics both in terms of understanding the content, and in terms of their performance (e.g., exams). Recognitionbeliefs describe students’ beliefs that others, including parents, instructors, and peers, recognize them as a physics person (in the case
Johnson’s original construction of science identity (Carlone & Johnson, 2007) but later emerged in discussions of domain-specific identity (Hazari et al., 2010), describes a student’s interest and enjoyment in learning about the subject and doing related tasks.
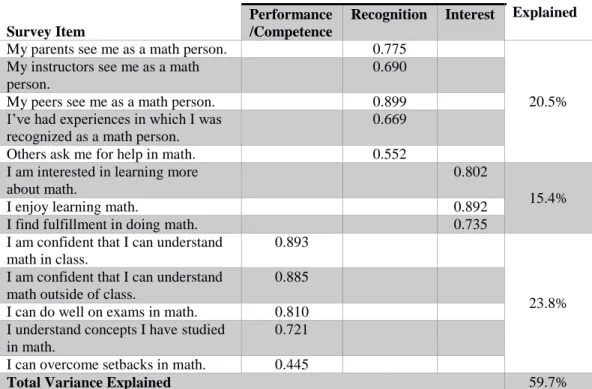
I use the quantitative identity framework developed by Hazari et al. (Hazari et al., 2010) to describe science identity and physics identity, which has been replicated in engineering (Godwin, 2016; Godwin, Potvin, & Hazari, 2013) and math (Cribbs, Hazari, Sonnert, & Sadler, 2015; Godwin et al., 2016). The overall measure of Physics Identity is constructed from the three sub-constructs, Physics Performance / Competence, Physics Recognition, and Physics Interest, which are combined in an unweighted average to give an overall score. Math Identity is similarly constructed of three domain-specific sub-constructs, measured with similar items that are framed in terms of math instead of physics (Cribbs et al., 2015; Godwin, Potvin, Hazari, & Lock, 2013). However, the relationship between these two identities has not yet been fully explored, even though they have been used together as predictors of other outcomes (e.g., engineering identity or interest in pursuing a career in engineering (Godwin, Potvin, & Hazari, 2013; Godwin et al., 2016)).
A note about social cognitive career theory
Social cognitive career theory (SCCT) (Lent, Brown, & Hackett, 1994) has been used in engineering education research for studying career choice (e.g., (Carrico & Tendhar, 2012; Sheu & Bordon, 2017)). Social cognitive career theory combines aspects of social cognitive theory (Bandura, 1977, 1997, 1999). Instead of using this framework to shape the current analysis, I instead chose to focus on the identity framework presented
by Hazari et al., because it better predicts engineering career choice (Godwin et al., 2016) than SCCT alone. Furthermore, SCCT does not account for recognition beliefs, which have been found to be integral to the identity framework and on related career choices, and instead focuses primarily on performance/competence beliefs, which prior work with the identity framework has shown has only an indirect effect on career choice, mediated by interest and recognition beliefs (Godwin et al., 2016).
Other salient theoretical constructs Belongingness
Belongingness is a measure of how accepted, comfortable, and welcome a student feels in their engineering classroom and program, which contributes to academic
engagement and achievement (Freeman et al., 2007; Pittman & Richmond, 2008). In the survey used in this dissertation, this factor is domain-specific to engineering. Example items include: “I feel welcome in engineering,” and “I feel supported in my engineering class.” This construct was developed by the research team for the InIce survey, following prior literature. Originally envisioned as several factors constructed from many more items, the pilot factor analysis showed that a single overall factor was appropriate, as the distinctions between hypothesized sub-constructs were not present.
Achievement Goal Theory
Performance Approach and Mastery Approach are drawn from Achievement Goal Theory, and describe why a student engages in behaviors related to their achievement (Dweck & Leggett, 1988). Students who take a performance approach
my peers that I am a good student”, and “Getting a better grade than other students in this class”) while for students with a mastery approach the focus is on developing competence and understanding (example items: “Really understanding this course’s material” and “Feeling satisfied that I got what I wanted from this course”). Related to these two is
Work Avoidance (Dowson & McInerney, 2001), in which the student’s goal is to
minimize the amount of effort required in order to pass the requirements (example items: “Getting a passing grade with as little studying as possible” and “Not having to work too hard in this class”). The combination of these three factors influences how students approach problem-solving, learning, and their education as a whole.
Kaplan and Flum (Kaplan & Flum, 2010) connected these approaches to generalized identity formation and argued that the mindsets and approaches of
Achievement Goal Theory are related to the mindsets and approaches students use when forming their identities. They raised questions of whether identity formation styles inform which achievement goal mindset a student employs in a particular situation.
Expectancy-Value Theory
Expectancy is drawn from Expectancy-Value Theory (EVT) (Eccles et al., 1983; Eccles & Wigfield, 2002), and describes how well someone expects to do on a task, in the present. An expectation of success is informed by a students’ socialization, including gender and cultural stereotypes, and past performances on similar tasks. Example
questions measuring this construct include “I expect to do well in this engineering course” and “I am confident I can do an excellent job on the assignments in this
their academic success in a class, as opposed to an engineering program as a whole, their college experiences, or their later careers. This construct is related to but distinct from self-efficacy (Bandura, 1997). According to expectancy-value theory, expectation of success at a particular task (including broad definitions of a task like “pass a course”) combined with the student’s subjective task value (a combination of what they gain from doing the task and what it will cost them) influences their choice of actions and overall performance (Wigfield, Eccles, Schiefele, Roeser, & Davis-Kean, 2007). Self-efficacy, like expectancy, addresses student perception of success at a task, but the scope of what constitutes a task is smaller and more focused on the present (e.g., solving a particular kind of math problem right now, versus passing a math class). Expectancy also overlaps with performance/competence beliefs in a particular domain, but again differ in scope. In the case of this survey, a student’s Expectancy describes their expectation of success in this particular engineering course and its assignments; their Engineering
Performance/Competence beliefs describe their ability to do engineering more generally. While performance/competence beliefs may be related to classroom participation, they represent a broader set of beliefs not tied to specific classroom or other contexts.
Future Time Perspective
Connectedness, Instrumentality, Value, and Perceptions of Future are all aspects of Future Time Perspective (FTP) theory (González, Fernández, & Paoloni, 2016; Husman & Lens, 1999; Kirn, Faber, & Benson, 2014; Simons, Vansteenkiste, Lens, & Lacante, 2004) which expands existing motivation theories to explicitly include time considerations in values and goal setting.
Connectedness is a measure of the perceived interconnectedness of the present and future, in general (example items [negatively-coded]: “I don’t like to plan for the future”, “It’s not really important to have future goals for where one wants to be in five to ten years.”).
Perceptions of Future describe how certain a student is that they are going to have a future career in engineering, and how positively they view that future (example item: “I want to be an engineer”).
Instrumentality is a measure of how connected or useful one feels their current tasks are for one’s future career and success. Perceived instrumentality is a context-specific measure and relates to one’s emerging identity (example item: “I will use the information I learn in this engineering course in the future”). In other words, what the value of the current task (i.e., taking and passing their engineering course) is to their future lives. Instrumentality has been associated with student performance; students with a positive perceived future and high instrumentality have higher motivation and
performance for tasks related to that future, while students with a negative perceived future and high instrumentality see decreases in both motivation and performance
(Simons et al., 2004). Here, I measure Instrumentality as it relates to a future career as an engineer.
Value is a statement about the worth of the future as compared to that of the present (example item: “Long range goals are more important than short range goals”). Value, as used in FTP here, is a distinct idea from that used in EVT, which is more similar to the Instrumentality construct (specifically, Instrumentality is a measure of Utility Value the explicitly considers time).
Kirn, Faber, and Benson (2014) describe how students with particular
combinations of these FTP constructs fashion their identities in distinct ways. Students with high Connectedness, Perceptions of Future, and Instrumentality (called “sugar cone students” in this earlier work) had clear and detailed ideas of what they wanted to do and be in the future, as well as clear paths to achieve that future. Sugar cone students were able to envision possible futures containing both positive outcomes (the person they wished to become) as well as outcomes they wished to avoid, negative futures closely related to their ideal future (e.g., a student who wants to become an anesthesiologist, and doesn’t want to become a surgeon of doctor; both the ideal and the avoided futures are similar in kind).
Grit
Grit is defined as perseverance and passion for long-term goals (Duckworth et al., 2007), and has been associated with success such as job retention and scholastic
achievement (Duckworth & Quinn, 2009; Eskreis-Winkler, Shulman, Beal, &
Duckworth, 2014). A person’s grit can be divided into two sub-constructs. Example items from Persistence of Effort, or perseverance for long-term goals, include “I have overcome setbacks to conquer and important challenge” and “I finish whatever I begin”.
Consistency of Interest describes the student’s passion and commitment to long-term goals. Example items include (negatively coded) “I have difficulty maintaining my focus on projects that take more than a few months to complete,” and “My interests change from year to year.”
Agency Beliefs
Agency beliefs refer to a student’s perception of their ability to change their world through their everyday actions and life goals (Basu, Calabrese Barton, Clairmont, & Locke, 2009; Godwin, Potvin, & Hazari, 2013; Turner & Font, 2003), and have been previously connected to the decision to enter engineering and interest in various engineering fields (Potvin et al., 2013). These studies investigated both “Personal” and “Global” Agency Beliefs and found that Personal Agency Beliefs were positive
significant predictors of decisions to enter college for science or engineering (Godwin, Potvin, & Hazari, 2013; Godwin et al., 2016). The questions measuring Personal Agency Beliefs were included in the survey as a measurement of Science Agency Beliefs, in contrast with a related set of questions, which were similarly phrased, but concerning engineering. For example, an item from the Science Agency beliefs factor is “Science is helpful in my everyday life,” whereas a similar item from the Engineering Agency Beliefs
factor is “Engineering can improve our society”. Both talk about the impact of science or engineering, but Science Agency Beliefs are focused on the student (with “I” and “me” phrases), while Engineering Agency Beliefs are somewhat more externally focused on engineering, though still interested in how it relates to the student and their ability to affect the world. In prior research (Godwin, Potvin, & Hazari, 2013; Godwin et al., 2016) these were studied in tandem with physics identity to predict students’ choice to go into engineering, but the constructs were non-interacting in that model.
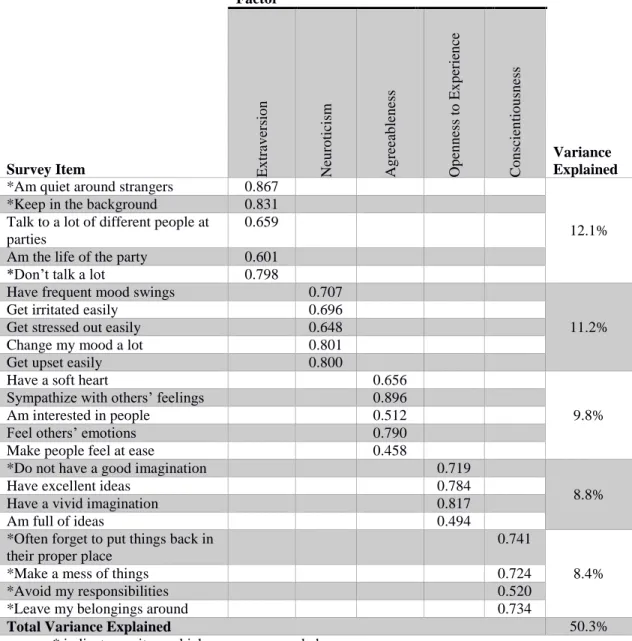
The “Big Five” Psychological Traits
The “Big Five” Psychological Traits describe a five-factor model of personality that has solidified through several decades of research (Judge & Ilies, 2002; McCrae & John, 1992; Zillig, Hemenover, & Dienstbier, 2002). These five traits are Neuroticism, Extraversion, Agreeableness, Conscientiousness, and Openness to Experience.
Neuroticism describes the tendency to show poor emotional adjustment in the form of stress, anxiety, and depression, and has alternatively been positively and negatively associated with student GPA (Noftle & Robins, 2007; Trapmann et al., 2007).
Extraversion represents the tendency to be sociable, outgoing, and positive.
Agreeableness describes tendencies to be kind, gentle, trusting, trustworthy, and warm.
Conscientiousness describes the ways in which individuals are dutiful, orderly, deliberate, and self-disciplined; Conscientiousness has been consistently positively associated with academic success at the high school and college levels (Dumfart & Neubauer, 2016; Rimfeld, Kovas, Dale, & Plomin, 2016; Trapmann et al., 2007). High scores Openness to Experience are associated with people who are creative, flexible, curious, and unconventional. The Big Five have also been associated with student
motivation, whether extrinsic or intrinsic (Clark & Schroth, 2010; Komarraju et al., 2009; Ryan & Deci, 2002). Neuroticism and Extraversion have been associated with extrinsic motivations to succeed academically, while Openness has been associated with high intrinsic motivation to know and experience stimulation. Conscientiousness has been associated with both kinds of motivation, and Agreeableness has been negatively associated with disengagement from learning (i.e., work avoidance).
Grit and Conscientiousness are highly correlated with each other, and persistence has been identified as a major facet of Conscientiousness in studies probing the
underlying factor structure of that personality trait (MacCann, Duckworth, & Roberts, 2009). However, other studies (Eskreis-Winkler et al., 2014; Rimfeld et al., 2016) have shown that while Grit remains a significant predictor of several life outcomes while controlling for Big Five personality traits (including and especially Conscientiousness), it explains a small additional amount of variance.
Relationship Between Theoretical Frameworks
The spectrum of theoretical frameworks employed in the current work is broad, though some of these frameworks are partially overlapping. In part because the theories from which I drew these constructs were developed independently, the concepts
described by each are not necessarily unique to that theoretical framework. For example, expectancy-value theory and the identity framework overlap in that both theories describe a person’s belief about their ability to accomplish something. However, as described above, Expectancy (from expectancy-value theory) and Performance/Competence beliefs (from the identity framework), while related, are still distinct, and worth considering together. Similarly, the three identity constructs used (physics identity, math identity, and engineering identity) have each been strongly associated with each other in prior
research, as discussed above.
Grit and the “Big Five” psychological traits have been studied in relation to each other for years, due to the correlations between grit and conscientiousness, and have each been linked time and again to persistence and success in academic settings. They also
overlap with some of the future-oriented constructs of future time perspective theory; connectedness and value both describe beliefs which are related to the dutifulness and industriousness facets of conscientiousness.
Though correlations between these constructs exist, and hint at a connected theoretical space that might encompass them all, each theory has individual differences that make it unique from the others and independently worthy of consideration in the overall combined analysis because of its potential for increased explanatory power. In terms of an entire space of affect, the chosen theories cluster in a relatively small space, as each has been chosen because of its association with academic performance,
persistence, etc. Further, the affective constructs are all quantitatively characterized, which limits their ability to accurately describe small, nuanced differences between students in favor of better describing broad patterns. The result is a relatively broad brush with which to describe students’ affect mostly as it relates to their academic lives.
Chapter II: Survey Development and Deployment
In this chapter, I describe the process by which the survey used in this work was developed and deployed1.
Survey Development
The theoretical constructs used in this work are latent variables which are cannot be directly measured. Proxy measurements can be directly made with related questions; the overall trend of those items can stand as a proxy for the latent variable. These proxy measurements are assessed by running a factor analysis on the measured questions, and determining which questions load onto which factors. Each factor described by the factor analysis corresponds to a particular theoretical construct, and each question is given a “loading” by the analysis which corresponds to how strongly the responses to that question correspond to the overall factor. In mathematical formalism, given 𝑛-many sets of 𝑑 random variables 𝑥𝑛 = {𝑥1,𝑛, … , 𝑥𝑑,𝑛}, with overall means 𝜇 = {𝜇1, … , 𝜇𝑑}, a factor analysis with 𝑘-many factors seeks to solve the equation 𝒙 − 𝜇 = 𝑳 𝑭 + 𝜀, where 𝒙 is the 𝑑×𝑛 matrix of observed variables, 𝑳 is a 𝑑×𝑘 matrix of loadings, 𝑭 is a 𝑘×𝑛 matrix of factors values for each observation, and 𝜀 is a 1×𝑛 vector of uncorrelated errors which are independent of 𝑭. Thus, through 𝑳, a particular observation 𝑥𝑛 can be converted into a list of numbers 𝐹𝑘 describing the scores for that observation on each factor or latent
variable. (For more information, see e.g., Graffelman, 2012).
1 This material is based upon work supported by the National Science Foundation under Grants No.
1428689 and 1428523. Any opinions, findings, and conclusions or recommendations expressed in this material are those of the author and do not necessarily reflect the views of the National Science Foundation.
Items for the chosen theoretical constructs were taken from previously developed surveys. The expected factor structure was established with an exploratory factor analysis (EFA) using a promax rotation2 on data from a pilot survey. An exploratory factor
analysis was used because many of these questions had not yet been used together with the population under study. This rotation was chosen to maximize interpretability of the factors since inter-correlation was expected between several factors. For example, the identity sub-constructs are known to be well-correlated and interrelated, so forcing those factors to be orthogonal (i.e., with another rotation choice) would reduce the ability of that factor to accurately describe the underlying construct. Results were used to shorten the survey by eliminating poorly performing items. Items with low loadings onto their factor were removed. As a first pass, items needed to have a loading of higher than 0.4 on corresponding factors; subsequent passes increased this cutoff on a factor-by-factor basis depending on the number of questions remaining in the factor. In the end, each factor was measured with 3-5 items which performed best. For newly-developed questions, items which had loadings that were split between multiple factors were particularly targeted for removal to improve factor interpretability, and no such items remained in the final
survey.
Personality tests designed to measure the “Big 5” psychological traits can be hundreds of items long. To reduce survey fatigue, the survey tried to measure these constructs with as few questions as possible without affecting reliability. Starting with a
50-item instrument from Goldberg (1992), the number of items for each factor was reduced to five by choosing the items with the highest loading in a five-factor EFA, as described above. Credé et al. have shown (2012) while two-item measures of these psychological traits have reduced reliability, the reliability quickly increases with just a few more items. Thus, while the measurement of students’ psychological traits may not have the nuance to separate into the various facets of each trait (i.e., six facets of a trait cannot be accurately measured with only five items), the measure of the overall trait can still be considered valid.
The factor analysis revealed 26 theoretical constructs underlying the questions about attitudes and beliefs, drawing from a variety of affective theories as discussed above. Some of these constructs were developed by the research team, for this project or in prior work, and others were drawn from the literature as being relevant to engineering student academic success, performance, learning, retention, and STEM career choice. The numeric results factor analysis establishing this structure and item loadings are included in Chapter 3.
The demographic questions at the end of the survey were developed in large part by the research team, or adapted from either the National Survey of Student Engagement (NSSE) or the Sustainability and Gender in Engineering (SaGE) surveys (Fernandez et al., 2016). Questions were constructed to be as broadly reaching and inclusive as possible; i.e., a “select all that apply” response structure was used for questions about ability/disability status, race and ethnicity, gender identity, sexuality, parental/guardian gender identity(s), and family occupations, and more inclusive response options were provided than, for example, a simple gender binary.
Students’ current major was asked as an open-ended, fill-in-the-blank question. These open responses were then cleaned by hand to remove unnecessary variations while retaining as much information as possible. For example, responses of “ME”, “Mech. E”, and “Mechanical Engineering” were all interpreted to mean “Mechanical Engineering” for subsequent analysis. In all, 23 unique majors were provided with an additional 49 unique combinations (i.e., two or more majors simultaneously reported), though the majority of responses (54.4%) fell into one of three well-populated majors3: 24.9% of students responded that they were “General Engineering” majors, 15.3% responded with “Mechanical Engineering”, and 14.3% responded with “First-year Engineering”. The next most popular response was “Civil Engineering”, with 5.96%, significantly lower than the three most common response categories.
In addition, students were asked directly to asses their current interest in several different majors, each on an anchored scale from 0 (not at all interested) to 6 (extremely interested). The majors included all of the engineering majors offered at the four
participating institutions4, as well as “Other STEM-related Degree” and “Other non-STEM-related Degree”.
The final version of the survey consisted of 22 (multi-item) questions, including several affective constructs (described above), their current major, their career interests,
3 For example, “Mechanical Engineering” and “General Engineering” were two popular categories.
and demographic factors. Affective items used anchored scales (on 0 to 6 scales), while demographic questions were all select-all-that-apply.
Survey Deployment
The survey was developed in Spring 2015 by a four-institution collaboration between Florida International University (FIU); University of Nevada, Reno (UNR); Clemson University; and Purdue University as part of the Intersectionality of Non-normative Identities in the Culture of Engineering (InIce) project. Questions measuring student affect were drawn from previously completed survey studies performed by the grant PIs (Godwin, 2016; Godwin, Potvin, & Hazari, 2013; Hazari et al., 2010; Kirn & Benson, 2013; Potvin et al., 2013; Potvin & Hazari, 2013) or from instruments developed and discussed in the literature (Duckworth & Quinn, 2009; Goldberg, 1992; Husman, Lynch, Hilpert, & Duggan, 2007). These questions were revised and pared down following a piloting of the survey during Spring 2015 at three of the institutions. The pilot survey had 537 respondents (223 from UNR, 78 from Purdue, and 236 from Clemson). See Appendix on page 148 for the final survey version.
At the beginning of the Fall 2015 semester, engineering students were surveyed at the four participating institutions. Surveys were administered between August 15th and September 14th. Students were recruited because of their enrollment in each institution's introductory engineering classes and were surveyed during class time with paper & pencil instruments during the first two weeks of the semester, before students had significantly progressed into their courses.
Student participation was voluntary and anonymous, though at the end of the survey students were asked to provide a contact e-mail address if they were willing to participate in follow-up interviews at a later date. As the survey was given during class time with nothing else to distract the students, the participation rate was high (average response rate of 70.7%, with the response rate at each institution being over 65%). In all, 2916 responses were collected (514 from UNR, 1104 from Purdue, 1050 from Clemson, and 298 from FIU5). A confirmatory factor analysis of the survey data confirmed that the factor structure from the pilot survey persisted.
5 FIU had an undergraduate engineering population of approximately 2,800 students. Purdue had
approximately 7,640 undergraduate engineering majors. Clemson had approximately 1160 general engineering majors, which all first-year engineering students take before later specializing. UNR has approximately 2610 undergraduate engineering students. Thus, though the numbers of students at each
Chapter III: Attitudes associated with Physics Identity Introduction
In this chapter, I reintroduce the two research questions that will be investigated herein and then give a brief overview of the statistical methodology which will be used to conduct the analysis. I present the results of the factor analyses and first linear regression model, followed by a discussion of those results. Then, I present a series of additional linear regressions, a discussion of those results, and an overall discussion of the implications of these findings. I conclude with a discussion of the limitations of this research.
Motivating the search for discipline-specific effects
Engineering is a diverse set of fields that deal with a wide variety of subjects and contexts, and different engineering disciplines can be appealing to different people; the sort of person who wants to become a mechanical engineer is not necessarily the same person who wants to become a chemical engineer. With this in mind, I wanted to
investigate whether a model of which attitudinal factors associated with physics identity changed with the addition of discipline-specific effects. Specifically, it was of interest to understand whether a student’s interest in a particular major mediates the effect of other affective factors discussed in the previous. Prior research has shown differences between various engineering disciplines with regards to how students’ intentions to pursue a career in that discipline are associated with particular factors, including Physics Identity, Math Identity, and Science Agency Beliefs (Potvin et al., 2013). Whereas prior work used each factor independently (i.e., factors were used simultaneously as predictors in a
model, but one factor was not used to predict another), this section extends the analysis to investigate similar discipline-specific effects while simultaneously accounting for
multiple affective factors. Research Questions
I investigate the following research questions in this chapter:
1. For the introductory engineering students at the four collaborating institutions, how are attitudinal factors associated with students’ physics identity beliefs? 2. How are the associations identified in Research Question 1 mediated by students’
interests in engineering disciplines?
Answering these questions may help to illuminate some of the connections
between previously-independently-considered factors which have been studied in relation to student choice, success, and persistence in STEM. Knowing about these associations can help guide future research towards more nuanced and sophisticated explanatory models, and clarify new effects by better controlling for previously known results. And answering the second research question can provide additional depth and nuance to the findings from the first question if it turns out that the sort of engineering being considered can drastically change how these factors interact with each other.
Methodology
The analytic methodology for this chapter and the development of the InIce survey are related. The goal is to determine the association between several theoretical constructs and the one of primary interest, physics identity. The factor structure of these
for each item in these factors is discussed below. To examine the association between several factors and Physics Identity, I created a linear model predicting Physics Identity as a function of the other factors using multiple linear regression. That model was iteratively improved by removing factors which were found to be non-significant to create a final primary model of the associations between attitudes and physics identity.
Students were surveyed near the beginning of their engineering program, and a plurality had not yet declared a major beyond “First Year Engineering” or “General Engineering”, as is typical for the two largest engineering programs studied. Over 40% of the students responded in this way to a survey item (Q11) probing this. However,
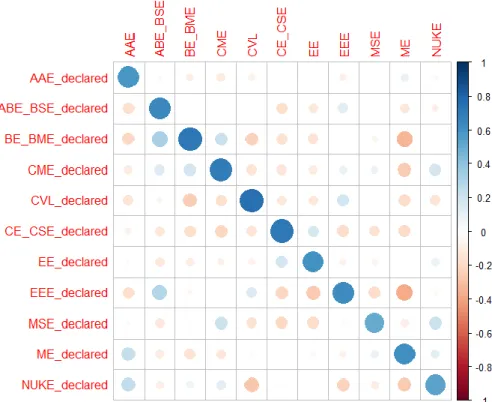
included in the survey was a question (Q14) asking students to “Please rate your interest in the following majors” with several response categories, each on an anchored scale from zero (“Not at all”) to six (“Very much so”). See the full InIce survey in the appendix for the full wording of questions Q11 and Q14 (page 155). Associations between the student responses to “What is your current major?” and these interest items are high; the correlation between a student’s interest in a major and their declared major ranged between 0.5085 and 0.7462, with a mean correlation of 0.6337, which can be interpreted as evidence for concurrent criterion-related validity of Q14 as a proxy for students’ major. See Figure 1 for more details.
Figure 1 – Polyserial correlation between having a declared major and interest score.
Q11 (vertical axis) probed students’ declared major, and their interest in each major was probed by Q14 (horizontal axis). Minimum correlation of a major with itself (diagonal terms) was 0.5085, with a mean correlation of 0.6337. The largest off-diagonal terms were -0.371, between mechanical engineering and a declared major in environmental/ecological engineering, and 0.322, between interest in agricultural biological / biosystems engineering and a declared bioengineering / biomedical engineering major. Abbreviations are explained in Table 1.
Table 1 - Abbreviations used for majors.
The chosen abbreviations are specific to this dissertation, and do not always reflect the canonical nomenclature.
Abbreviation Full Name
AAE Aero/Astronautical Engineering
ABE_BSE Agricultural and Biological / Biosystems Engineering
BE_BME Bioengineering / Biomedical Engineering
CME Chemical Engineering
CVL Civil Engineering
CE Computer Engineering
CON Construction Management Engineering
EE Electrical Engineering
EP Engineering Physics
EEE Environmental / Ecological Engineering
IND Industrial Engineering
IT Information Technology
MSE Materials Engineering / Material Science and Engineering
ME Mechanical Engineering
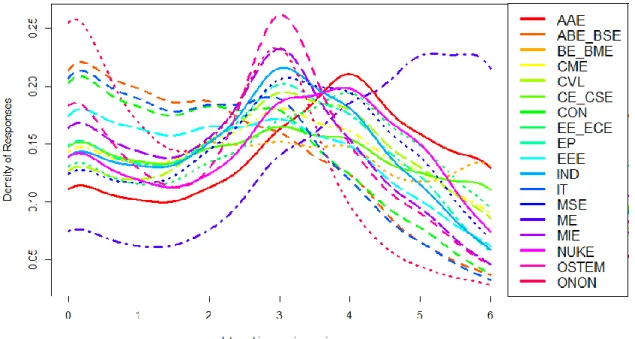
Responses to the question on major interest were typically bimodal, with one peak being near zero (meaning, students declaring no interest in that major), and another in the 3-4 range (those students with significant interest). See Figure 2 for distributions of interest in each major. The only major which broke this trend was Mechanical
Engineering, which had a significantly higher fraction of highly interested responses, with three times as many students answering each of 5 or 6 as compared to 0. However, this information matches with the information about declared majors from Q11, in which Mechanical Engineering was overrepresented compared to any other discipline, being the second highest number after only “General Engineering”. Therefore, one would expect that a higher proportion of students would show an interest in Mechanical Engineering.
Figure 2 - Density estimates for responses to Q14
For each of the identified majors. Major names were abbreviated for space. Abbreviations for majors are explained in Table 1.
The primary model was then extended to multiple parallel models, each corresponding to the addition of another regressor describing student interest in a
particular engineering major. Each interest was added to the model, tested, and then removed before adding the next interest (i.e., the extended models each had only a single additional predictor compared to the primary model). The list of interests was drawn from Q14 in the survey and represented all of the engineering major choices available at the four institutions administering the survey.
Results of the Primary Model
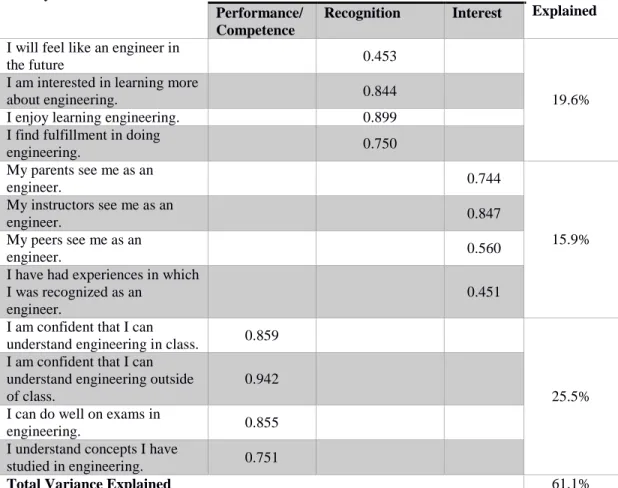
The survey questions to measure physics identity and their loadings on these factors are described below, followed by the questions and loadings for the other attitudinal factors included in this dissertation.
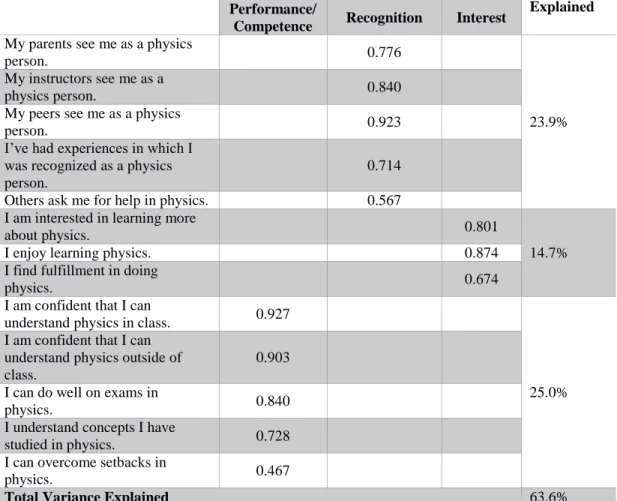
Table 2 - Factor Loadings for Physics Identity sub-constructs
Survey Item Factor Variance
Explained Performance/
Competence Recognition Interest
My parents see me as a physics
person. 0.776
23.9% My instructors see me as a
physics person. 0.840
My peers see me as a physics
person. 0.923
I’ve had experiences in which I was recognized as a physics person.
0.714
Others ask me for help in physics. 0.567
I am interested in learning more
about physics. 0.801
14.7%
I enjoy learning physics. 0.874
I find fulfillment in doing
physics. 0.674
I am confident that I can
understand physics in class. 0.927
25.0% I am confident that I can
understand physics outside of class.
0.903 I can do well on exams in
physics. 0.840
I understand concepts I have
studied in physics. 0.728
I can overcome setbacks in
Table 3 - Factor loadings for Belongingness Survey Item
Factor Variance Explained Belongingness
I feel comfortable in engineering. 0.837
64%
I feel I belong in engineering. 0.825
I enjoy being in engineering. 0.818
I feel comfortable in my engineering class. 0.837
I feel supported in my engineering class. 0.727
I feel that I am part of my engineering class. 0.748
Total Variance Explained 64%
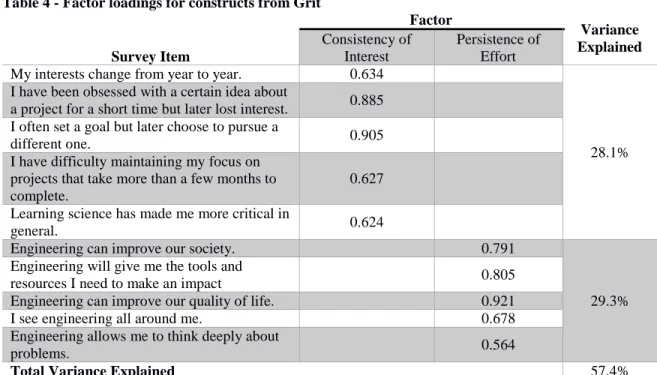
Table 4 - Factor loadings for constructs from Grit
Survey Item Factor Variance Explained Consistency of Interest Persistence of Effort
My interests change from year to year. 0.634
28.1% I have been obsessed with a certain idea about
a project for a short time but later lost interest. 0.885 I often set a goal but later choose to pursue a
different one. 0.905
I have difficulty maintaining my focus on projects that take more than a few months to complete.
0.627 Learning science has made me more critical in
general. 0.624
Engineering can improve our society. 0.791
29.3% Engineering will give me the tools and
resources I need to make an impact 0.805
Engineering can improve our quality of life. 0.921
I see engineering all around me. 0.678
Engineering allows me to think deeply about
problems. 0.564
Table 5 - Factor loadings constructs from Achievement Goal Theory Survey Item Factor Variance Explained Performance
Approach Work Avoid
Mastery Approach
Doing better than the other students
in this class on exams. 0.926
29.6% Proving to my peers that I am a
good student. 0.546
Doing better than the other students
in the class on assignments. 0.959
Getting a better grade than other
students in this class. 0.934
Getting a passing grade with as little
studying as possible. 0.847
23.5% Getting through the course with the
least amount of time and effort. 0.963
Not having to work too hard in this
class. 0.839
Knowing more than I did previously
about these course topics. 0.754
18.0% Really understanding this course’s
material. 0.889
Feeling satisfied that I got what I
wanted from this course. 0.656
Table 6 - Factor loadings for constructs from Expectancy-Value Theory and FTP
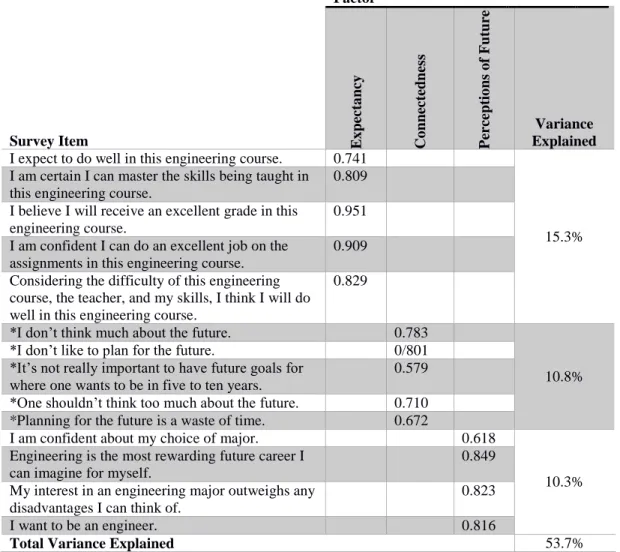
The table is split between two pages; the factor analysis was done with all five factors simultaneously.
Survey Item Factor E x pect a ncy Co nn ec tednes s P er ce ptio ns o f F uture Variance Explained
I expect to do well in this engineering course. 0.741
15.3% I am certain I can master the skills being taught in
this engineering course.
0.809 I believe I will receive an excellent grade in this
engineering course.
0.951 I am confident I can do an excellent job on the
assignments in this engineering course.
0.909 Considering the difficulty of this engineering
course, the teacher, and my skills, I think I will do well in this engineering course.
0.829
*I don’t think much about the future. 0.783
10.8%
*I don’t like to plan for the future. 0/801
*It’s not really important to have future goals for where one wants to be in five to ten years.
0.579
*One shouldn’t think too much about the future. 0.710
*Planning for the future is a waste of time. 0.672
I am confident about my choice of major. 0.618
10.3% Engineering is the most rewarding future career I
can imagine for myself.
0.849 My interest in an engineering major outweighs any
disadvantages I can think of.
0.823
I want to be an engineer. 0.816
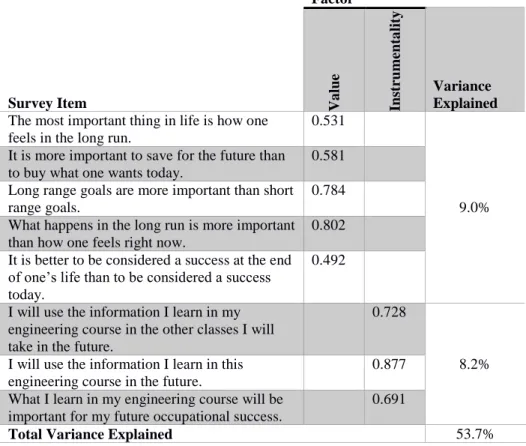
Table6, continued Survey Item Factor Va lue Ins tru menta lity Variance Explained
The most important thing in life is how one feels in the long run.
0.531
9.0% It is more important to save for the future than
to buy what one wants today.
0.581 Long range goals are more important than short
range goals.
0.784 What happens in the long run is more important
than how one feels right now.
0.802 It is better to be considered a success at the end
of one’s life than to be considered a success today.
0.492
I will use the information I learn in my engineering course in the other classes I will take in the future.
0.728
8.2% I will use the information I learn in this
engineering course in the future.
0.877 What I learn in my engineering course will be
important for my future occupational success.
0.691
Total Variance Explained 53.7%
Table 7 - Factor loadings for constructs from Agency Beliefs
Survey Item Factor Variance Explained Science Agency Beliefs Engineering Agency Beliefs
Learning science will improve my career prospects.
0.634
28.1%
Science is helpful in my everyday life. 0.885
Science has helped me see opportunities for positive change.
0.905 Science has taught me how to take care of my
health
0.627 Learning science has made me more critical in
general.
0.624
Engineering can improve our society. 0.791
29.3% Engineering will give me the tools and resources I
need to make an impact
0.805
Engineering can improve our quality of life. 0.921
I see engineering all around me. 0.678
Engineering allows me to think deeply about problems.
0.564
Table 8 - Factor loadings for constructs from the "Big 5" Psychological Traits Survey Item Factor Variance Explained E x tr av er sio n Neu ro ticis m Ag ree ab len ess Op en n ess to E x p er ie n ce C o n scien tio u sn ess
*Am quiet around strangers 0.867
12.1%
*Keep in the background 0.831
Talk to a lot of different people at parties
0.659
Am the life of the party 0.601
*Don’t talk a lot 0.798
Have frequent mood swings 0.707
11.2%
Get irritated easily 0.696
Get stressed out easily 0.648
Change my mood a lot 0.801
Get upset easily 0.800
Have a soft heart 0.656
9.8%
Sympathize with others’ feelings 0.896
Am interested in people 0.512
Feel others’ emotions 0.790
Make people feel at ease 0.458
*Do not have a good imagination 0.719
8.8%
Have excellent ideas 0.784
Have a vivid imagination 0.817
Am full of ideas 0.494
*Often forget to put things back in their proper place
0.741
8.4%
*Make a mess of things 0.724
*Avoid my responsibilities 0.520
*Leave my belongings around 0.734
Total Variance Explained 50.3%
Table 9 - Factor loadings for constructs related to Math Identity Survey Item Factor Variance Explained Performance /Competence Recognition Interest
My parents see me as a math person. 0.775
20.5% My instructors see me as a math
person.
0.690
My peers see me as a math person. 0.899
I’ve had experiences in which I was recognized as a math person.
0.669
Others ask me for help in math. 0.552
I am interested in learning more about math.
0.802
15.4%
I enjoy learning math. 0.892
I find fulfillment in doing math. 0.735
I am confident that I can understand math in class.
0.893
23.8% I am confident that I can understand
math outside of class.
0.885
I can do well on exams in math. 0.810
I understand concepts I have studied in math.
0.721 I can overcome setbacks in math. 0.445