University of Huddersfield Repository
Tang, Xiaoli, Xu, Yuandong, Gu, Fengshou and Wang, Guangbin
Fault Detection of Rolling Element Bearings Using the Frequency Shift and Envelope based
Compressive Sensing
Original Citation
Tang, Xiaoli, Xu, Yuandong, Gu, Fengshou and Wang, Guangbin (2017) Fault Detection of Rolling
Element Bearings Using the Frequency Shift and Envelope based Compressive Sensing.
Proceedings of the 23rd International Conference on Automation & Computing, (University of
Huddersfield, 78 September 2017). ISSN 9780701702601
This version is available at http://eprints.hud.ac.uk/id/eprint/33643/
The University Repository is a digital collection of the research output of the
University, available on Open Access. Copyright and Moral Rights for the items
on this site are retained by the individual author and/or other copyright owners.
Users may access full items free of charge; copies of full text items generally
can be reproduced, displayed or performed and given to third parties in any
format or medium for personal research or study, educational or notforprofit
purposes without prior permission or charge, provided:
•
The authors, title and full bibliographic details is credited in any copy;
•
A hyperlink and/or URL is included for the original metadata page; and
•
The content is not changed in any way.
For more information, including our policy and submission procedure, please
contact the Repository Team at: [email protected].
http://eprints.hud.ac.uk/
Fault Detection of Rolling Element Bearings
Using the Frequency Shift and Envelope based
Compressive Sensing
Xiaoli Tang, Yuandong Xu, Fengshou Gu, Andrew D. Ball
Centre for Efficiency and Performance Engineering University of Huddersfield
Huddersfield, UK [email protected]
Guangbin Wang
Hunan Provincial Key Laboratory of Health Maintenance for Mechanical Equipment
Hunan University of Science & Technology Xiangtan, China
Abstract—Rolling element bearings are the essential
components of rotating machines, faults of which can cause serious failures or even major breakdowns of a machine. Fault diagnosis deliveries significant benefits to machines with rolling element bearings by finding the faults at early period and taking corrective actions to enhance safe and high performance operations. However, multiple sensor usages and high rate data acquisition involved in a monitoring system have considerable drawbacks of high system cost involved in purchasing hardware for data transfer, storage and processing. To reduce these shortages, this paper investigates compressive sensing (CS) techniques for the fault detection of rolling element bearings. Based on the frequency shift and envelope analysis, a CS scheme is developed for monitoring the bearing. The number of data transmitted and stored can be reduced by several thousands of times. The simulation and the experimental results demonstrate that the compressed vibration signals of rolling element bearings are effective to detect bearing faults at the total compressing ratio up to several thousand with the corresponding maximum compression ratio (CR) of CS process at nearly 100. In addition, several performance measures are applied to evaluate the reconstructed signals and show approximately the information about the noise level of the system.
Keywords-Rolling element bearings, compressive sensing, frequency shift, reconstruction
I. INTRODUCTION
The faults of a rolling element bearing cost the majority of the maintenance expenditure and can inevitably cause serious failures or even damages of a rotating machine during operation. Thus, it is extremely necessary to monitor the condition of a rotating machine and diagnose faults of its rolling bearings. However, multiple sensor usages and high rate data collection involved in the data acquisition of the monitoring system have significant drawbacks of high system cost involved in purchasing the hardware for data transfer, storage and processing.
Recently, a new theory called compressive sensing (CS) was proposed as a framework by D. Donoho et al., in
which the sparsity of a signal can be exploited to recover it from fewer samples than required by the Shannon-Nyquist sampling theorem through optimization [1]. It innovates the technology through reducing the number of data in the signal processing field, especially medical imaging, radar imaging, image and video compression. Abo-Zahhad et al. [2] made a survey for CS including concepts, fundamentals, algorithms, and applications. In addition, many researchers has applied CS for the fault diagnosis of bearings to solve the aforementioned issue. For example, Zhang et al. [3], [4] proposed two methods, one according to the results of matching pursuit and the other one based on training over-complete dictionaries, that bearing condition will be estimated finally using few measurements directly without reconstructing the signals. C. Wang et al. [5]studied a novel sparse wavelet reconstruction residual feature for rolling element bearing diagnosis based on building new dictionary matrices. Wang et al. [6], [7] extracted different characteristic parameters for segments of bearing signals and then detected faults based on compressed feature signals. In [8], Liu et al. et al. presented an efficient method to detect early defects of bearings with extraction the acoustic emission compressive features from compressively-sensed data directly, which reduced the amount of data required and computation. However, due to great computational burden of CS, some algorithms only selected a small segment for compression so that parts of signal features may be lost. Simultaneously, these papers did not mention to reduce the sampling frequency because of a large expense of instruments with high sampling rate in industrial applications. In this paper, CS is utilized to detect faults of rolling bearings through compressing vibration signals based on the frequency shift, down sampling and envelope analysis. In addition, the relationship between the CR and average mean squared error (AMSE) is also discussed with simulated signals and experimental signals.
The reset content of this paper is organized as follows. Section II introduces the basic theory of CS and then develops the fault detection scheme for rolling bearing monitoring. Section III depicts the performance of the proposed scheme based on simulated signals applied with This paper is supported by China Scholarship Council.
Proceedings of the 23rd International Conference on Automation & Computing, University of Huddersfield, Huddersfield, UK, 7-8 September 2017
CS. Section IV presents the experimental verifications along with critical discussion. After that, conclusions are summed up in the final section.
II. METHODOLOGY
A. Basic Theory of Compressive Sensing
Compressive sensing breaks the traditional Nyquist sampling theorem followed by a data acquisition and expresses that far fewer samples are required to reconstruct the original signals. The original signal x, which is sparse and with the length of N , can be compressed to a signal y with a length of M (MN) by using a random matrix , which is called measurement matrix with the size of MN. Specifically, the compressed signal y is defined as
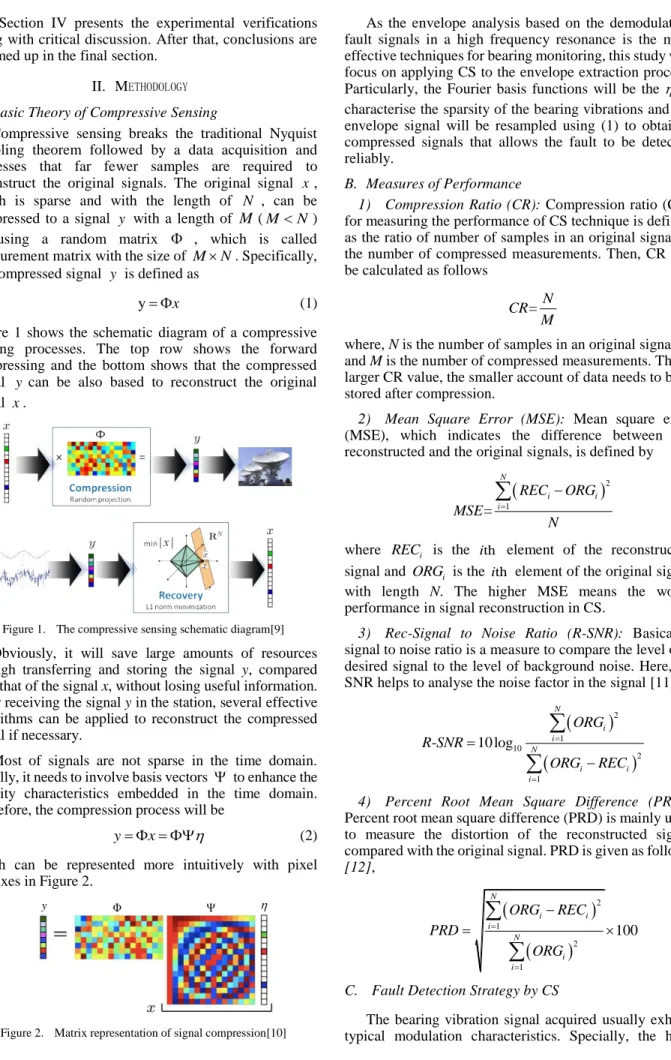
y x (1) Figure 1 shows the schematic diagram of a compressive sensing processes. The top row shows the forward compressing and the bottom shows that the compressed signal y can be also based to reconstruct the original signal x.
Figure 1. The compressive sensing schematic diagram[9] Obviously, it will save large amounts of resources through transferring and storing the signal y, compared with that of the signal x, without losing useful information. After receiving the signal y in the station, several effective algorithms can be applied to reconstruct the compressed signal if necessary.
Most of signals are not sparse in the time domain. Usually, it needs to involve basis vectors to enhance the sparsity characteristics embedded in the time domain. Therefore, the compression process will be
y x (2) which can be represented more intuitively with pixel matrixes in Figure 2.
y Φ Ψ
Figure 2. Matrix representation of signal compression[10]
As the envelope analysis based on the demodulating fault signals in a high frequency resonance is the most effective techniques for bearing monitoring, this study will focus on applying CS to the envelope extraction process. Particularly, the Fourier basis functions will be the to characterise the sparsity of the bearing vibrations and the envelope signal will be resampled using (1) to obtain a compressed signals that allows the fault to be detected reliably.
B. Measures of Performance
1) Compression Ratio (CR): Compression ratio (CR) for measuring the performance of CS technique is defined as the ratio of number of samples in an original signal to the number of compressed measurements. Then, CR can be calculated as follows
= N
CR
M (3)
where, N is the number of samples in an original signal and M is the number of compressed measurements. The larger CR value, the smaller account of data needs to be stored after compression.
2) Mean Square Error (MSE): Mean square error (MSE), which indicates the difference between the reconstructed and the original signals, is defined by
2 1 = N i i i REC ORG MSE N
(4) where RECi is the ith element of the reconstructed signal and ORGi is the ith element of the original signal with length N. The higher MSE means the worse performance in signal reconstruction in CS.3) Rec-Signal to Noise Ratio (R-SNR): Basically, signal to noise ratio is a measure to compare the level of a desired signal to the level of background noise. Here, R-SNR helps to analyse the noise factor in the signal [11].
2 1 10 2 1 - 10 log N i i N i i i ORG R SNR ORG REC
(5)4) Percent Root Mean Square Difference (PRD):
Percent root mean square difference (PRD) is mainly used to measure the distortion of the reconstructed signal compared with the original signal. PRD is given as follows
[12],
2 1 2 1 100 N i i i N i i ORG REC PRD ORG
(6)C. Fault Detection Strategy by CS
The bearing vibration signal acquired usually exhibit typical modulation characteristics. Specially, the high
frequency resonance technique (HFRT) treats the measured vibration responses as a result of the modulation between the periodic impulses and structural resonances. To have high signal to noise ratio data for bearing fault detection, bearing CM usually acquires vibration data at a sampling rate as high as several thousand Hertz in order to capture the frequency ranges having the resonances. This acquisition results in a large amount data which demands high capacity resources for post processing.
In order to reduce the sampling rate, a frequency shifting can be utilized to move the vibration signals from a high band such as from 2000Hz to 3000Hz to a lower one from 0 to 1000 Hz firstly. The following two equations show that the signal will shift left with w0 in the frequency domain if it is multiplied by
e
jw t0 in the time domain.
1
2 jwt jwt f t F w e dw F w f t e dt
(7)
0 0 0 0 jw t jwt jw t jwt j w w t y t f t e Y w y t e dt f t e e dt f t e dt F w w
(8) After shifting frequency with an exponential function, the vibration signal is resampled based on the bandwidth. Then, envelope the resampled signal to obtain the main information through the signal contour. After that, the signal vector is compressed with a Gaussian random matrix and a discrete Fourier transform (DFT) matrix to get a compressed signal with length M M
N
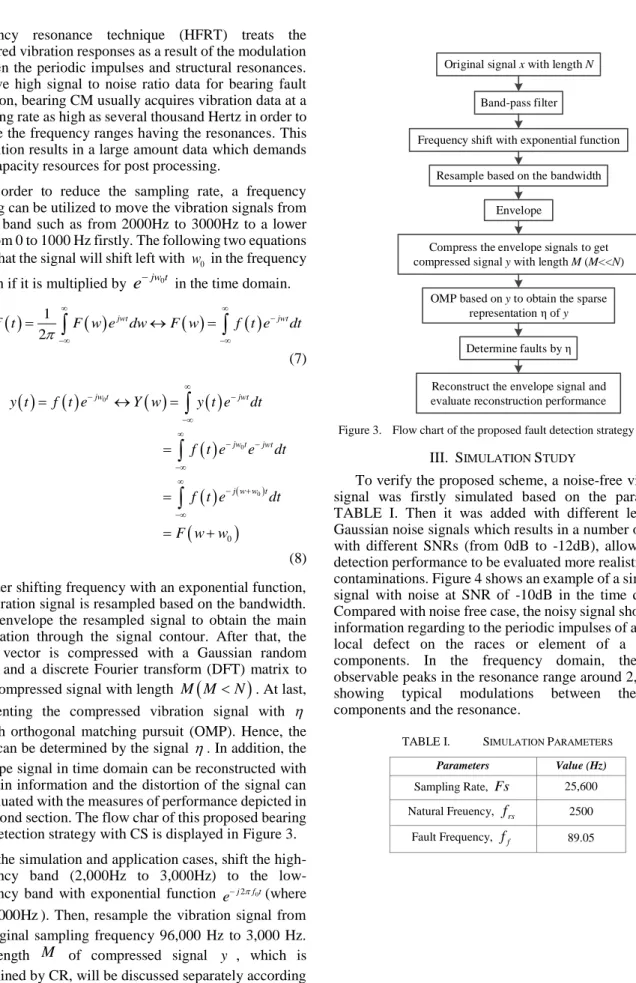
. At last, representing the compressed vibration signal with through orthogonal matching pursuit (OMP). Hence, the faults can be determined by the signal . In addition, the envelope signal in time domain can be reconstructed with the main information and the distortion of the signal can be evaluated with the measures of performance depicted in the second section. The flow char of this proposed bearing fault detection strategy with CS is displayed in Figure 3.In the simulation and application cases, shift the high-frequency band (2,000Hz to 3,000Hz) to the low-frequency band with exponential function ej2f t0 (where
0 2000Hz
f ). Then, resample the vibration signal from the original sampling frequency 96,000 Hz to 3,000 Hz. The length M of compressed signal y , which is determined by CR, will be discussed separately according to the following actual situation. Due to the randomness of the measurement matrix, the process of CS will be repeated 100 times and acquire the average result to determine the bearing faults.
Original signal x with length N
Envelope
Compress the envelope signals to get compressed signal y with length M (M<<N)
OMP based on y to obtain the sparse representation η of y
Determine faults by η Frequency shift with exponential function
Resample based on the bandwidth Band-pass filter
Reconstruct the envelope signal and evaluate reconstruction performance
Figure 3. Flow chart of the proposed fault detection strategy with CS
III. SIMULATION STUDY
To verify the proposed scheme, a noise-free vibration signal was firstly simulated based on the parameters TABLE I. Then it was added with different levels of Gaussian noise signals which results in a number of cases with different SNRs (from 0dB to -12dB), allowing the detection performance to be evaluated more realistic noise contaminations. Figure 4 shows an example of a simulated signal with noise at SNR of -10dB in the time domain. Compared with noise free case, the noisy signal show little information regarding to the periodic impulses of a typical local defect on the races or element of a bearing components. In the frequency domain, there are observable peaks in the resonance range around 2,500Hz, showing typical modulations between the fault components and the resonance.
TABLE I. SIMULATION PARAMETERS
Parameters Value (Hz)
Sampling Rate, Fs 25,600
Natural Freuency, frs 2500
Figure 4. Simulated bearing signal in time and frequency domains By applying band-pass filtration, frequency shift, down sampling, envelope extraction, the CS was carried out to evaluate if the fault is detectable i.e. with at least that the first two harmonics are observable in the envelope spectrum. At the same time, the relationship among the SNR, CR and various measures based on fault detection are analysed to investigate the performance of reconstruction in CS.
The sparse representation of the signal with noise at SNR of -10dB, which was demonstrated in Figure 4, is displayed in Figure 5. It can be seen that the first three harmonics are presented significantly in the envelope spectrum, confirming the occurrence of the outer race fault on the bearing without doubt.
Figure 5. Sparse representation of a signal and its reconstruction after CS (SNR= -10dB CR=16)
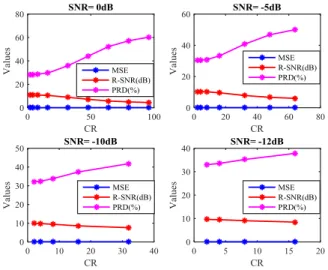
Figure 6. Performance measures with different CR Figure 6 depicts the relationship among the performance measures and CR under different SNR cases. For the purpose of exploring the effect of SNR on CR, a rule of appearance of second harmonic is set up. According to this rule, the smaller the value of SNR is, the smaller the maximum compression ratio achieved. On the other side, the performance measures R-SNR and PRD have an excellent positive correlation with CR.
Figure 7. Comparison of performance measures for different SNR For further comparison of performance measures for different SNR cases, Figure 7 demonstrates the MSE, R-SNR and PRD with the change of CR at different R-SNR. MSE values increase with CR under low SNR (0dB and -5dB). Conversely, they decrease with the increase of CR under the lower SNR (-10dB and -12dB). However, MSE can only be used for comparison of the same signal at different CRs instead of different signals. To solve this problem, we use R-SNR and PRD measures to evaluate the performance of CS reconstruction. Both these two measures indicate that the level of the noise can affect significantly the reconstruction result of the compressed signal. It is clear that R-SNR and PRD always have a converse trend, so that only PRD will be used for performance evaluation in the next section.
IV. EXPERIMENTAL RESULTS
A. Test System
Figure 8 shows the schematic diagram of the test system, which consists mainly of a DC generator, a motor, a data acquisition device, bearings, accelerometers. During the faulty bearing test, the vibration response was acquired at a sampling rate of 96kHz in order to capture any potential structure resonances of the bearing systems.
PC DAQ
Vibration Sensors Motor Device and DC Generator
Figure 8. Schematic diagram of the test system
In this experiment, key specifications of the roller bearings used are shown in TABLE II, and the outer race fault created artificially is shown in Figure 9.
TABLE II. SPECIFICATIONS OF BEARINGS
Elements Values
Pitch Diameter, Dc 46.4 mm
Roller Diameter, Db 9.53 mm
Shaft Rotating Frequency, fr 24.90 Hz
Roller Number, Nr 9
Contact Angle, 0
Figure 9. Bearing with outer race fault
The theoretical outer race fault frequency fo can be calculated through (9). 1 cos 2 b r o r c D N f f D (9)
According to (9), the outer race fault frequency is about 88.86Hz when the test rig operated at the rated speed of 24.90 Hz, which is the particularly frequency to be identified for fault detection.
B. Analysis and Results
In this experiment, the length N of the original signal is 96k. The length of data changed to be only 3000 after frequency shift and down sampling. The next step is CS which will further compress the envelope signal acquired after down sampling. Figure 10 demonstrates two
examples of envelope and reconstructed signals at CR=32 and 96.
Figure 10. Examples of envelope and reconstructed signals at CR=32 and 96
The frequency information in Figure 10 denotes the first two harmonics are included in the sparse representation, which is useful to determine the fault type. TABLE III gives values of two evaluation indicators for these two CRs. The CRs state that the compressed signal only retains about 90 and 30 data points for CR=32 and CR=96, separately. It is observed that reconstructed signals maintains most of the useful information after CS referred the reconstruction in Figure 10. As a result, the proposed approach compresses the original signal up to thousands of times and the fault can be detected by the sparse representation of the compressed signal.
TABLE III. VALUES OF MEASURES FOR FIGURE 10
Parameters Values
CR 32 96
MSE 0.0761 0.0910
PRD(%) 27.28 48.34
Figure 11 presents the MSE and PRD trended with different CR for the faulty bearing. As aforementioned in section III, the values of MSE increases with the rise of CR and PRD. This result shows that the noise in this signal is relatively smaller, compared with the high noise cases simulated. Alternatively, it may also mean that the fault severity is large.
Figure 11. Performance measures for the bearing with outer race fault
V. CONCLUSION
This paper proposes a fault detection scheme based on CS through the frequency shift and the envelope extraction to overcome the problems of large quantity of data transmission and storage in monitoring systems with modulation signals, especially rolling element bearings. Both simulation and experimental results show that the outer race fault can be reliably detected with a small amount of data points. Additionally, the maximum CR can reach to almost 100, so that the outer race fault can be detected accurately at the total compressing ratio up to thousands, and the compressed signal can be reconstructed with the performance measures evaluated. Moreover, it has demonstrated that the vibration signals acquired based on conventional methods can be resampled into compressed signals with a much smaller number of samples for the purpose of bearing condition monitoring. For further application, according to the theoretical analysis, it also can be used for other systems with modulation signals to reduce the resources consumed by data transmission and storage.
REFERENCES
[1] R. G. Baraniuk, ‘Compressive Sensing [Lecture Notes]’, IEEE Signal Process. Mag., vol. 24, no. 4, pp. 118–121, Jul. 2007. [2] M. M. Abo-Zahhad and A. I. Hussein, ‘Compressive Sensing
Algorithms for Signal Processing Applications: A Survey’,
Commun. Netw. Syst. Sci., pp. 197–216, 2015.
[3] Z. Xinpeng, H. Niaoqing, and C. Zhe, ‘A Bearing Fault Detection Method Base on Compressed Sensing’, in Engineering Asset Management - Systems, Professional Practices and Certification, P. W. Tse, J. Mathew, K. Wong, R. Lam, and C. N. Ko, Eds. Cham: Springer International Publishing, 2015, pp. 789–798.
[4] X. Zhang, N. Hu, L. Hu, L. Chen, and Z. Cheng, ‘A bearing fault diagnosis method based on the low-dimensional compressed vibration signal’, Adv. Mech. Eng., vol. 7, no. 7, Jul. 2015. [5] C. Wang, M. Gan, and C. Zhu, ‘Fault feature extraction of rolling
element bearings based on wavelet packet transform and sparse representation theory’, J. Intell. Manuf., Sep. 2015.
[6] H. Wang, Y. Ke, G. Luo, L. Li, and G. Tang, ‘A Two-Stage Compression Method for the Fault Detection of Roller Bearings’,
Shock Vib., vol. 2016, pp. 1–11, 2016.
[7] H. Wang, Y. Ke, G. Luo, and G. Tang, ‘Compressed sensing of roller bearing fault based on multiple down-sampling strategy’,
Meas. Sci. Technol., vol. 27, no. 2, p. 25009, Feb. 2016.
[8] C. Liu, X. Wu, J. Mao, and X. Liu, ‘Acoustic emission signal processing for rolling bearing running state assessment using compressive sensing’, Mech. Syst. Signal Process.
[9] P. Schwabe, ‘TI - Research - Applications - Compressed Sensing’.
[Online]. Available:
https://www.ti.rwth-aachen.de/research/applications/cs.php. [Accessed: 28-Apr-2017]. [10] J. Stinnett and J. Gillenwater, ‘NIR Single Pixel Camera’, Connex.
Httpcnx Orgcontentcol1052511, 2008.
[11] S. Joshi, K. V. Siddamal, and V. S. Saroja, ‘Performance analysis of compressive sensing reconstruction’, in Electronics and Communication Systems (ICECS), 2015 2nd International Conference on, 2015, pp. 724–729.
[12] R. Khanam and S. N. Ahmad, ‘Selection of Wavelets for Evaluating SNR, PRD and CR of ECG Signal’, Int J Eng Sci Innov Technol, vol. 2, pp. 112–119, 2013. 0 10 20 30 40 50 60 70 80 90 100 0.06 0.07 0.08 0.09 CR V al ue s
Reconstruction measures for bearing with outer race fault
MSE 0 10 20 30 40 50 60 70 80 90 100 20 30 40 50 CR V al ue s PRD(%)