PointerViz
- Towards Visualizing Pointers for Novice Programmers
Akhila Sri Manasa Venigalla, Chaitanya S. Lakkundi*, Sridhar Chimalakonda Intelligent Software & Human Analytics (ISHA) Research Lab
Dept. of Computer Science and Engineering Indian Institute of Technology
Tirupati, India
{cs18m017, cs18s502*, ch}@iittp.ac.in
Abstract
Pointers are considered as one of the key concepts in learning programming and are extensively used for implementing several data structures. They lay the foundation for handling dynamic aspects of a program, increase execution speed and handle data types with more efficiency. This makes it critical for budding programmers to be well versed with using pointers. However, most of the novice programmers find it difficult and tricky to understand concepts such as address allocations, pointers referring pointers and data structures containing pointers. Hence, drawing the physical structure and flow of pointers is considered to be a common learning practice to gain better clarity and avoid confusion when learning pointers. But, it is time consuming and tedious to draw the flow of pointers on paper while programming. To help programmers understand these variations in pointers, we propose PointerViz as a Google Chrome extension that displays the pictorial representation of selected code with pointers. We conducted a preliminary survey with 40 students from various universities and 83% of the users reported positive experience with the plugin.
1.
Introduction
Good programming skills require sound knowledge of data structures. Learners of programming languages face various difficulties in terms of understanding various functions, attributes and data structures [1]. Several tools have been developed to help novices learn programming [2,3,4,5,6]. They include games that help students learn computer programming [7], environments that support conventional programming instructions like Mindstorm [4], Scratch [5], Blockly
[6], Snap! [8] and many other code visualization tools such as Examplore [9] and Python tutor [3].
*This author has discontinued from the institute.
execution speed, handling complex data structures with more efficiency and ease. Pointers allow sharing without copying through pass by reference, which is advantageous when programmers desire to pass around big arrays. They also enable programmers to resize data structures whenever required, supporting dynamic memory allocation. While security seems to be a concern when pointers are used by novice programmers, pointers provide a greater advantage in terms of performance by speeding up program execution [11]. Performance being a critical aspect of programming, trade-off between security and performance can be considered useful. A study conducted by Lahtinen et al., states that most of the students face difficulties in understanding pointers and references [12]. This reveals that though pointers are the basic concepts of programming, they are still difficult to understand.
Visualization is one of the ways that can help learners to gain a better of data structures. Researchers have proposed various forms of code visualizations to improve learning of novice programmers since a couple of decades [13,3]. Continuous improvements are being made to develop techniques and tools that can better support visualization. Online Python Tutor
proposed by Philip Guo is one such tool that visualizes code written after compilation [3]. Visualizing code snippets written by programmers helps in better program comprehension. Visualization can also aid programmers who are well aware of data structures and their implementation in helping them with trade-offs of using pointers. Learners of programming are generally tested on the address references and pointers to assess their knowledge of data structures [12], making it necessary for even novice learners to understand these concepts.
A common practice of learners is to draw down the flow of pointers’ data and references with respect to memory allocations to better understand the code. But this method demands time, effort and sometimes may also be incorrect [14]. Hence, there is a strong need to Proceedings of the 53rd Hawaii International Conference on System Sciences | 2020
Page 118 URI: https://hdl.handle.net/10125/63754
provide learners with technology that visualizes pointers based on the program or pseudo code they write, which is the main motivation for our work.
Though there are many existing visualization tools that help in visualizing code snippets, there is not much work done to visualize pointers and their references before compilation, to the best of our knowledge. Hence we propose PointerViz1 to support learners of
programming language to comprehend pointers better. The remainder of this paper is structured as follows. Section 2 discusses the related work followed by Section 3, which focuses on design methodology and development of PointerViz. Working of PointerViz is described in Section 4. Section 5 presents user scenario in the form 4 cases. We present the evaluation and user survey results in Section 6 and Section 7. Finally, we discuss the limitations in Section 8 and end the paper with conclusions and future directions in the Section 9.
2.
Related Work
Researchers have developed various visualization tools to help novice programmers learn programming quicker have been developed. Scratch [5] is a block-based visualization tool that helps users to program easier by supporting drag and drop of blocks than writing the program. Blockly is also a block-based tool that provides visualization of programs [6]. Coding concepts are represented as interlocked blocks and
Blockly generates syntactically correct code in programming language of our choice [6]. Tools like
Examplore provide visualization of API usage examples to help users understand various correct ways of using APIs in programming languages [9].
Progranimate, an e-learning web based tool assists users in programming using flow chart representations. It provides code generation, inspects variables and thus provides syntax and semantic learning of programmers to the users. This helps users to gain an in-depth sound knowledge of the programming language [15]. NetBlox
is another visualization tool that has been developed to enhance understanding of distributed programming [16]. In this tool, messages that are communicated among systems are represented as blocks with message payloads. Programmers are provisioned to provide Message Type that defines data present in the message.
Games is another direction of research that has been leveraged to make programming interesting and easy [17,18,19,20].One of the games developed by Leutenegger et al. teaches fundamental programming concepts in C++language, with the help of 2D game development [18].Robot ON! is a game developed to improve program
1https://github.com/AkhilaSriManasa/
PointerViz
Comprehension among learners. It helps players in understanding of control flow, program statements, data types and function calls by allowing players to demonstrate their understanding of the above in a given program [19]. RoBUG game has been developed to support and motivate players in learning of effective debugging. It comprises of four levels that require player to do certain tasks in each of them, like code tracing, using print statements to identify bugs, use divide-and-conquer strategy to spot the bugs and using breakpoints to analyze variable values [20].
Extensions to GCspy tool have been developed, that track and visualize dynamic memory allocations as nodes and graphs [21]. BlueJ is an IDE that provides UML notation of Java code which helps users visualize structure of the application [22]. Users can view source code of classes present in UML diagrams by clicking on them. CoffeeDregs, a dynamic analysis tool, has been developed to support and visualize debugging facilities [23]. VisuAlgo has been introduced to visualize a set of predefined algorithms. It shows the visual execution of an algorithm for a given input [24].
Jeliot3 has been developed as a programming tool that enables users program and visualize step by step execution of the program in the form of animations. It is mainly focused on expression evaluation and is depicted by the movement of messages, method calls, values and references in the code [25]. Java Visualizer illustrates dynamic run-time behavior of program by moving back and forth in program execution2.
JavelinaCode, a web-based IDE, supports synchronized visualization of static and dynamic aspects of Java source code [26]. Pythontutor, proposed by PhilipGuo visualizes the code by displaying the data structures used [3]. Another visualization tool called
PlayVisualizerC (PVC) that dynamically visualizes the code in terms of memory allocations has been proposed by Ryosuke et al. in [27]. Visualization tools have been developed to help students learn programming, debugging and explore various possible ways of writing programs. Games have been developed to support students in program comprehension, various concepts of programming such as function calls, values, movement of messages and so on. To the best of our knowledge, there is no visualization tool or a game that can help programmers comprehend concepts of pointers and their implementation in the program without compilation of. Hence, in this paper, we propose PointerViz to address this issue. PointerViz
aims to visualize the statements insitu IDE, before compilation, rather than visualizing
2http://www.cs.princeton.edu/˜cos126/java_
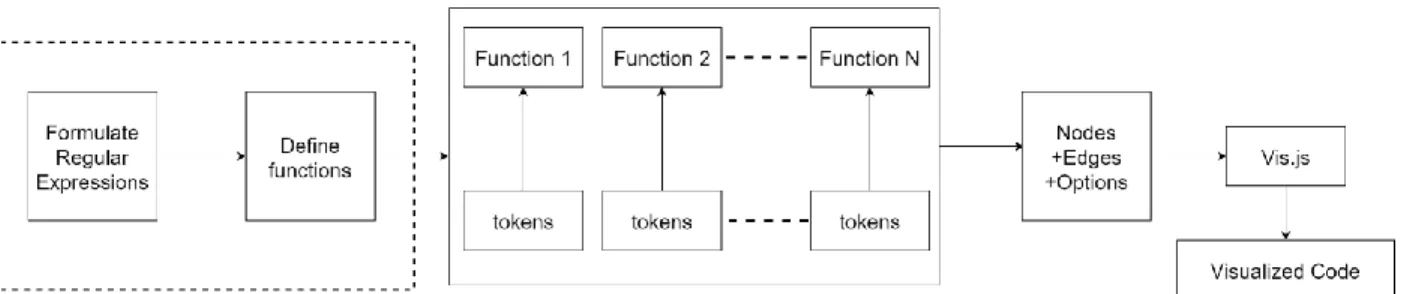
Figure 1. Approach for design of PointerViz them after compilation of the code unlike existing works
such as pythontutor [3] that visualizes the code after compilation. Visualizing statements on the go will help novice programmers in identifying and rectifying the mistakes if any, at the early stages of the code, as a result reducing the debugging efforts. Also, PointerViz displays primitive visualization of pointers, which is identical to the way budding programmers draw on paper, unlike
PVC [27] which displays memory locations and internal details. This primitive representation can help novice programmers relate better to their interpretations.
3.
Design of
PointerViz
PointerViz prototype is currently developed as an extension3 to Google Chrome. As a proof of concept,
we developed PointerViz as a plugin to support an online compiler and interpreter, ideone.com4, as shown
in Figure 1. However, our plugin can be extended to support any other online coding playgrounds such 5
might motivate users to view representations and thus comprehend the concepts better. As the first step of design, we formulated regular expressions that portray various ways in which pointers are defined. The regular expressions used to match the statements written in the code by users, are as follows:
as codepad.org and compileonline.com. In its current form, PointerViz can also be added as an extension to browsers other than Google Chrome, such as Mozilla Firefox. Visualizations are generated using an open source Javascript framework, vis.js6. Vis.js enables us
to dynamically visualize graphs within the browser by facilitating manipulation of and interaction with dynamic data and also customization of nodes. Vis.js also helps in handling large amounts of dynamic data, making it a suitable choice to generate visualizations in coding environments which involve considerably large amounts of dynamic data.
PointerViz is designed to support novice programmers get a better view of pointer data structures. It provides interactive visualization to the users. The floating representations of links among various nodes
3PointerViz can be installed on Mozilla Firefox as well. 4https://ideone.com/
5http://codepad.org/ 6https://visjs.org/
Regular expression [A] points to pointer declarations alone, where in the pointers point to a garbage value. Statements in which pointers are assigned NULL values are recognized by Regular expression [B]. Regular
Regular expression [A]:
/[a-z]+\ \*\ ([a-zA-Z$_][a-zA-Z0-9$_]*)\;/gm; recognizes examples such as : int *p;
Regular expression [B]:
/[a-z]+\ \*\ ([a-zA-Z$_][a-zA-Z0-9$_]*)\ *=\ *null\;/gmi;
recognizes examples such as : int *p = NULL; Regular expression [C]:
/[a-z]+\ \*\ ([a-zA-Z$_][a-zA-Z0-9$_]*)\ *= \ *\&\ ([a-zA-Z$_][a-zA-Z0-9$_]*)\;/gm; recognizes examples such as : int *p = &a; Regular expression [D]:
/[a-z]+\ ([a-zA-Z$_][a-zA-Z0-9$_]*)\ *\[\ *([0-9]+)\ *\]\;/g;
recognizes examples such as : int p[10]; Regular expression [E]:
/[a-z]+\ ([a-zA-Z$_][a-zA-Z0-9$_]*)\ *\[\ *([0-9]+)\ *\]\;/g;
recognizes examples such as : int p[9][10]; Regular expression [F]:
/[a-z]+\ *\*\ *([a-zA-Z$_][a-zA-Z0-9$_]*)\ *=\ *\"([a-zA-Z0-9$_]+)\"\ *;/gm;
recognizes examples such as : char *p="test"; Regular expression [G]:
[a-z]+\ *([a-zA-Z$_][a-zA-Z0-9$_]*)\ *\[\ *([0-9]+)\ *\]\ *\=\ *((\{('([[a-z]|[A-Z]| [0-9]+|[$_]])' *\,*)*\})
|(\{(([0-9]+)\ *\,*)*\}));/gm;
recognizes examples such as : int p[2]={1,2}; Regular expression [H]:
/[a-z]+\ *([a-zA-Z$_][a-zA-Z0-9$_]*)\ *\[\ *([0-9]+)\ *\]\ *\[\ *([0-9]+)\ *\]=\ *((\{('([[a-z]|[A-Z]|[0-9]+|[$_]])' *\,*)*\})|(\{(([0-9]+)\ *\,*)*\}));/gm; recognizes examples such as :
expression [C] recognizes statements in which the pointers are assigned the address of a variable. Arrays of a given size can be obtained from Regular expression [D]. Two dimensional arrays of given row and column sizes are recognized by Regular expression [E]. Pointers to strings are recognized by Regular expression [F]. One dimensional arrays whose elements are defined are recognized by Regular expression [G] and 2D arrays whose elements are defined at the time of declaration are recognized by Regular expression [H].
For every regular expression that has been formulated, a function is defined to generate the corresponding visualization. Every visualization is a set of nodes with connections between them that are represented using edges. Node shapes are defined in functions in a way, such that they convey the semantic meaning of statements written by the user. The difference in address space between nodes is also represented in by a numeric value between the nodes, representing the number of bytes. These nodes and edges are passed as a dataset to previously stated visualization framework, vis.js to render visualizations. Functions take parsed tokens as inputs and verify if they match any of the defined regular expressions. They return options of shapes, nodes and edges in the form of data. The function in script below deals with statements of the form defined in Regular expression [A].
Definitions for Edges, nodes and shape options are shown in the script below considering Regular expression [A] as an example, where nodes are defined to be displayed as circles and edges as arrows. Variables and pointers are defined to be displayed as circles and arrays are represented as rectangular boxes.
Visualization is updated regularly at the end of every statement. Code is processed in the form of tokens, which are fed into each of the pattern recognizing functions. The function which contains matching regular expression is executed. New patterns that are not defined previously can easily be added, by defining new functions the newly defined patterns, making it easy to extend this plugin from a developer’s perspective.
4.
Working of
PointerViz
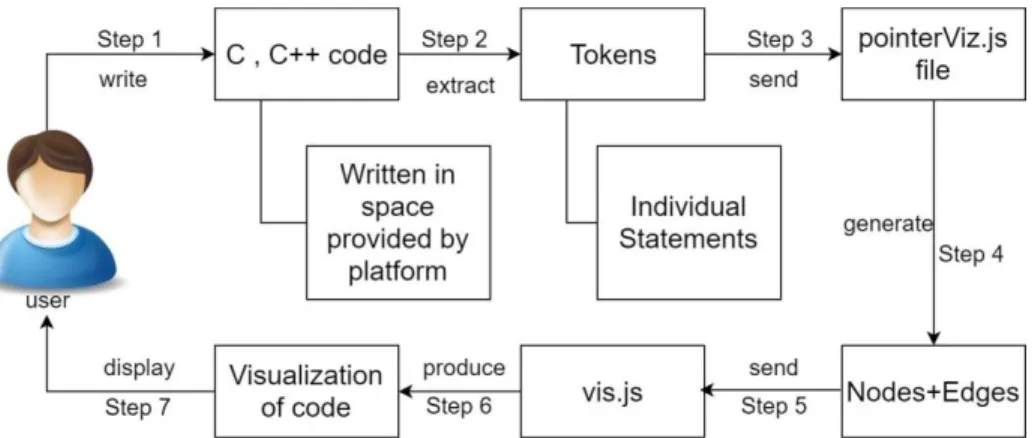
The main aim of PointerViz is to display the references of pointer data structures as used in the code written by the user. Workflow of PointerViz is a seven step mechanism, as shown in Figure 2.
• Step 1: User enters a statement in desired programming language among C or C++ in the text space provided by ideone.com, as the current prototype is being tested forideone.com.
• Step 2: Tokens are extracted from these statements and are considered as individual statements. Token extraction is done with help of
pointerViz.js script that filters out statements by semi colons used. Even if users enter various statements in the same line, they can be separated out by considering semi colon symbols.
• Step 3: Extracted tokens are passed to
pointerViz.js file, which forms the basis of plugin. Functions written in the script process these tokens and compare them with regular expressions which are defined apriori.
• Step 4: The pointerViz.js file generates nodes edges based on the matched regular expressions. It then renders shapes corresponding to these regular expressions, as defined in each function. • Step 5: Resulting nodes and edges are passed to
vis.js framework to produce results by processing them. It provides overlays for the same as mentioned in the pointerViz.js file.
size: 30, font: { size: 30, multi: true }, borderWidth: 2, shadow:true }, edges: { width: 3, } }; const identifier = m[1]; const nodes = [
{id:0, label: identifier, group: "0", title: code}, {id:2, shape: 'dot',
label: "Garbage"} ];
const edges = [
{from: 0, to: 2, arrows: 'to'} ];
const options = { nodes: {
shape: 'circle', function ptr_type1(code) {
const regex_1 =/[a-z]+\
\*([a-zA-Z$_][a-zA-Z0-9$_]*)\;/gm; const m = regex_1.exec(code); const identifier =m[1]; . . const data = {
nodes: nodes,edges: edges}; return [data, options]; }
Figure 2. Stepwise Working of PointerViz • Step 6: Results are produced in the form of
visualizations based on the code entered by user. • Step 7: The results obtained in the previous step
are displayed to the user in the space provided below the existing text space. Users are provided with facilities to change orientations of the figures and also to view code that resulted in creation of the node by hovering on the first node.
For each line entered by the user on the console provided, PointerViz compares the statement with predefined regular expressions. For a correct match, the shapes and their relations are displayed. These shapes help novice users to differentiate among various types of pointer declarations. The pointers are visualized using circles with arrows emerging from these circles. These arrows point to the referenced variables as per the identified tokens. The shapes used to represent these data structures contain respective variables that have been used by users in their code for better readability.
Semi colons are used as delimiting symbols to separate tokens in monolithic code. As we have implemented PointerViz for programming languages like C and C++, it identifies next line or statement by semi colon. As new statements are entered, new visualizations with respect to those statements are generated and displayed to the user. Visualizations of previously entered statements are maintained to help users revisit those structures instead of re-writing the same statements. Visualizations are done in First Come First Display pattern i.e., visualizations of latest statements are displayed at the bottom, similar to push operations in queue. Users can select and drag nodes in the displayed visualizations to alter their orientation.
5.
User Scenario
Suppose Veda is a novice programmer working on C programming language and she wishes to learn the how pointers refer to various variables in the program. She then visits ideone.com, an online coding playground, selects C as the language she wishes to code.
• Case 1: She starts typing the first statement:
i n t * p ;
Visualization of this statement is displayed. She then hovers on the node p displayed in the visualizations. The code that resulted in creation of node p is displayed above this node as shown in Figure 3.
Figure 3. Visualization of code for Case 1
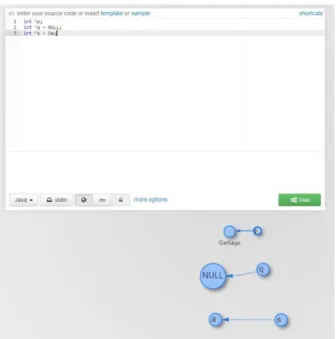
• Case 2: She writes another statement in addition
to the previous statement resulting in the following code
i n t * p ;
i n t * q = NULL;
i n t * s = &a ;
A visualization of the statement is displayed with
s as a circular node and an arrow originating from this node to another circular node a as shown in Figure 4. Also, the statement where a pointer is assigned a NULL value is represented with a circular node q pointing to another circular node having the value as NULL. These statements are visualized and displayed below the previous statement as shown in Figure 4.
Figure 4. Screenshot of PointerViz showing visualization of code for Case 2
• Case3: Veda adds another statement that
declares an empty array of size five.
i n t p [ 5 ] ;
Veda can view visualization of the statement by scrolling down the page as in Figure5. The difference between memory address of one element of the array to the next element is represented with the numeric value of number of bytes that differ, on a line between the elements. Since the entered array is an integer array, each element occupies a memory of 4 bytes and hence, memory locations of consequent elements differ by 4 bytes, as indicated between the nodes in Figure 5.
Figure 5. Visualization of code for Case 3
• Case 4: When Veda writes a statement with a
two dimensional character array of two rows and three columns.
char p [ 2 ] [ 3 ] ;
Veda can view visualization on the page as in Figure 6. Since, the array is a character array, each element of the array occupies 1 byte in the memory and hence, it indicates that one element occupies the memory location that is equal to memory location of the preceding element+1.
Figure 6. Visualization of code for Case 4
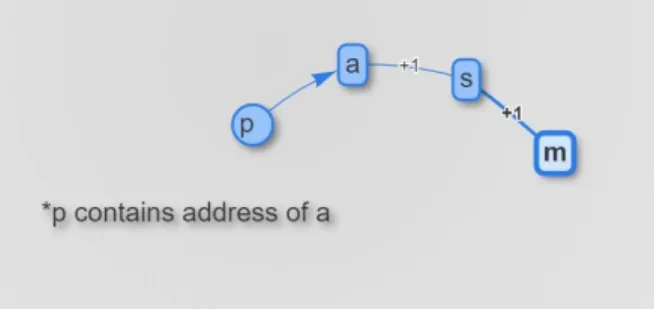
• Case 5: Veda, then writes a statement
representing a pointer to string:
char *p = "moksha";
The above statement is then displayed to Veda as shown in Figure 7, where the pointer variable p
points to the given string and stores the address of the first character in the string (m in this example).
Figure 7. Visualization of code for Case 5
• Case 6: Veda writes another statement that
defines a character array of size3.
i n t p [ 3 ] = { ' a ' , ' s ' , 'm ' } ;
Visualization of the above statement is displayed as shown in Figure 8.
• Case 7: Visualization of a two dimensional array
defined at the time of declaration as given below, is displayed as shown in Figure 9.
Q1: How easy was it to use PointerViz interface? (1=very easy, 5=very difficult)
Q2: PointerViz has visualized pointer data structures clearly and correctly. (1=strongly agree, 5=strongly disagree)
Q3: PointerViz has helped me in learning
about various ways of usages of pointer data structures. (1=strongly agree, 5=strongly disagree)
Q4: PointerViz has kept the whole experiment interesting and informative. (1=strongly agree, 5=strongly disagree)
Q5: I will recommend PointerViz to my peers. (1=strongly agree, 5=strongly disagree) Figure 8. Visualization of code for Case6
Figure 9. Visualization of code for Case7
6.
Evaluation
To evaluate PointerViz, we have conducted a user experience study with 40 volunteers, in the age group of 18-20 years, from various universities. The participants were asked to install our PointerViz plugin as an extension to Google Chrome browser, on their personal desktops or laptops. They were also provided with a slide-show depicting the procedure to install
PointerViz, a sample working video of the plug-in and few sample statements that contain pointers, which served as a basic tutorial. They were then asked to write code that involved snippets containing pointers usingideone.com. The participants were suggested to view and verify visualizations displayed based on the code that they have written. A user survey has been conducted with the help of a five point Likert Scale. A questionnaire as provided in Table 1, in which each question has to be rated on a scale of 1 to 5, has been sent to volunteers to assess their experience and evaluate PointerViz.
7.
Results
As reported in Figure 10, PointerViz had a good user-friendly interface (83% in Q1). In Q2, about
Table 1. Questions in survey using a 5-point Likert Scale.
82% of participants have agreed that PointerViz has visualized the statements clearly and correctly. The ratings in Q3 and Q4 indicate that PointerViz has helped about 77% of participants learn about various ways of using pointers and that the experiment has been considerably interesting (80% in Q4). However, they have also suggested increasing the scope of visualization to various definitions of pointers. In Q5, most of the participants have agreed that they would recommend PointerViz to their peers (83%).
8.
Discussion and Limitations
The core idea of this paper is to apply the concept of visualization to aid users in understanding critical concepts in programming languages. One of the critical aspects as identified by researchers is pointers [12].
PointerViz prototype is a first step towards supporting critical programming concepts through visualization. In order to do an in-line visualization of code, the current implementation of the tool uses lexical analysis and parsing at statement level instead of block level. We have limited the scope of PointerViz to understand individual statements and visualize the same. We shall hence extend PointerViz to support analysis of complete code considering relations among the statements in code in the future versions. While we initially planned to map understanding pointers with different levels of Bloom’s taxonomy, we limited our scope to basic concepts in the current version.
While the idea seems to be simple, we aim to extend this to support visualization of pointers in cases where
Figure 10. Results of User Survey Questionnaire
pointers deal with various programming concepts such as use of pointers in a function, array of pointers, linked lists and use of pointers in user defined data types such as structures. Though the current prototype focuses only on visualizing code statement wise, based on the feedback we received, PointerViz could help novices get a better understanding of the pointers and references.
9.
Conclusion and Future Work
In this paper, we have introduced PointerViz to visualize pointers, as a prototype extension to Google Chrome web browser that augments ideone.com. As pointers are considered to be one of the critical aspects of learning programming, our work aims to support novice programmers learn better [12,1]. PointerViz
prototype has visualized code written by users upto a decent level of satisfaction, owing to 82% of participants willing to recommend this plugin to their peers. PointerViz can easily be extended to support other online coding platforms as well. As reported by survey participants, one most important suggestion is to extend
PointerViz for other usages of pointers such as linked lists and doubly linked lists. We plan to extend the plugin to support multiple scenarios of pointers pointing to pointers, array of pointers. We shall also extend the plugin to include display of timely visualizations of code blocks. We see this work as a first step towards improving program comprehension through visualization that could help novice programmers.
Acknowledgements
We thank all the volunteers for their valuable time and honest feedback that helped us in evaluating
PointerViz.
References
[1] Y. Bosse and M. A. Gerosa, “Why is programming so difficult to learn?: Patterns of difficulties related to programming learning mid-stage,” ACM SIGSOFT Software Engineering Notes, vol. 41, pp. 1–6, 01 2017. [2] A. Luxton-Reilly, E. McMillan, E. Stevenson,
E. Tempero, and P. Denny, “Ladebug: an online tool to help novice programmers improve their debugging skills,” in Proceedings of the 23rd Annual ACM Conference on Innovation and Technology in Computer Science Education, pp. 159–164, ACM, 2018.
[3] P. J. Guo, “Online python tutor: embeddable web-based program visualization for cs education,” in Proceeding of the 44th ACM technical symposium on Computer science education, pp. 579–584, ACM, 2013.
[4] S. H. Kim and J. W. Jeon, “Programming lego mindstorms nxt with visual programming,” in Control, Automation and Systems, 2007. ICCAS’07. International Conference on, pp. 2468–2472, IEEE, 2007.
[5] J. H. Maloney, K. Peppler, Y. Kafai, M. Resnick, and N. Rusk, “Programming by choice: Urban youth learning programming with scratch,” in Proceedings of the 39th SIGCSE Technical Symposium on Computer Science Education, SIGCSE ’08, (New York, NY, USA), pp. 367–371, ACM, 2008.
[6] A. Marron, G. Weiss, and G. Wiener, “A decentralized approach for programming interactive applications with javascript and blockly,” in Proceedings of the 2nd edition on Programming systems, languages and applications based on actors, agents, and decentralized control abstractions, pp. 59–70, ACM, 2012.
[7] M. Muratet, P. Torguet, J.-P. Jessel, and F. Viallet, “Towards a serious game to help students learn computer programming,” International Journal of Computer Games Technology, vol. 2009, p. 3, 2009.
[8] C. North and B. Shneiderman, “Snap-together visualization: can users construct and operate coordinated visualizations?,” International Journal of Human-Computer Studies, vol. 53, no. 5, pp. 715–739, 2000.
[9] E. L. Glassman, T. Zhang, B. Hartmann, and
M. Kim, “Visualizing api usage examples at scale,” in Proceedings of the 2018 CHI Conference on Human Factors in Computing Systems, p. 580, ACM, 2018. [10] B. W. Kernighan and D. M. Ritchie, The C programming
language. 2006.
[11] A. D. Robison and P. F. Dubois, “C++ gets faster for scientific computing,” Computers in Physics, vol. 10, no. 5, pp. 458–462, 1996.
[12] E. Lahtinen, K. Ala-Mutka, and H.-M. Ja¨rvinen, “A study of the difficulties of novice programmers,” Acm Sigcse Bulletin, vol. 37, no. 3, pp. 14–18, 2005.
[13] S. Bassil, R. K. Keller, et al., “Software visualization tools: Survey and analysis.,” in IWPC, pp. 7–17, 2001. [14] A. J. Ko, B. A. Myers, and H. H. Aung, “Six learning
barriers in end-user programming systems,” in 2004 IEEE Symposium on Visual Languages-Human Centric Computing, pp. 199–206, IEEE, 2004.
[15] A. Scott, M. Watkins, and D. McPhee, “E-learning for novice programmers; a dynamic visualisation and problem solving tool,” in Information and Communication Technologies: From Theory to Applications, 2008. ICTTA 2008. 3rd International Conference on, pp. 1–6, IEEE, 2008.
[16] B. Broll, A. Le´deczi, P. Volgyesi, J. Sallai, M.Maroti, A. Carrillo, S. L. Weeden-Wright, C. Vanags, J. D. Swartz, and M. Lu, “A visual programming environment for learning distributed programming,” in Proceedings of the 2017 ACM SIGCSE Technical Symposium on Computer Science Education, pp. 81–86, ACM, 2017.
[17] A. Vahldick, A. J. Mendes, and M. J. Marcelino, “A review of games designed to improve introductory computer programming competencies,” in Frontiers in Education Conference (FIE), 2014 IEEE, pp. 1–7, IEEE, 2014.
[18] S. Leutenegger and J. Edgington, “A games first approach to teaching introductory programming,” in ACM SIGCSE Bulletin, vol. 39, pp. 115–118, ACM, 2007.
[19] M. A. Miljanovic and J. S. Bradbury, “Robot on!: a serious game for improving programming comprehension,” in Games and Software Engineering (GAS), 2016 IEEE/ACM 5th International Workshop on, pp. 33–36, IEEE, 2016.
[20] M. A. Miljanovic and J. S. Bradbury, “Robobug: A serious game for learning debugging techniques,” in Proceedings of the 2017 ACM Conference on International Computing Education Research, pp. 93– 100, ACM, 2017.
[21] A. M. Cheadle, A. Field, J. Ayres, N. Dunn, R. A. Hayden, and J. Nystrom-Persson, “Visualising dynamic memory
allocators,” in Proceedings of the 5th international symposium on Memory management, pp. 115–125, ACM, 2006.
[22] M. Ko¨lling, B. Quig, A. Patterson, and J. Rosenberg, “The bluej system and its pedagogy,” Computer Science Education, vol. 13, no. 4, pp. 249–268, 2003.
[23] C. Huizing, R. Kuiper, C. Luijten, V. Vandalon, et al., “Visualization of object-oriented (java) programs.,” in CSEDU (1), pp. 65–72, 2012.
[24] S. Halim, “Visualgo,” Dostupne´ net/en, 2015. z:¡ https://visualgo.
[25] A. Moreno and M. S. Joy, “Jeliot 3 in a demanding educational setting,” Electronic Notes in Theoretical Computer Science, vol. 178, pp. 51–59, 2007.
[26] J. Yang, Y. Lee, and D. Hicks, “Synchronized static and dynamic visualization in a web-based programming environment,” in Program Comprehension (ICPC), 2016 IEEE 24th International Conference on, pp. 1–4, IEEE, 2016.
[27] R. Ishizue, K. Sakamoto, H. Washizaki, andY. Fukazawa, “Pvc: Visualizing c programs on web browsers for novices,” in Proceedings of the 49th ACM Technical Symposium on Computer Science Education, pp.245– 250,ACM,2018.