International Research Journal of Management and Commerce Vol. 4, Issue 1, January 2017 Impact Factor- 5.564 ISSN: (2348-9766)
© Associated Asia Research Foundation (AARF)
Website: www.aarf.asia Email : [email protected] , [email protected]
A STUDY OF THE INFLUENCE OF SELECTED MACROECONOMIC
VARIABLES ON INDIAN STOCK MARKET
Raju Warrier1 and Dr. Unny C J2
1
Asst. Prof., School of Commerce, DePaul Institute of Science and Technology, Angamaly
2
Director, School of Management, DePaul Institute of Science and Technology, Angamaly
ABSTRACT
A study to identify the impact of selected macroeconomic variables on Nifty 50 is carried out in
this paper. It also tries to find out if the macroeconomic variables have any relation with the
industry stock indices of the National Stock Exchange. Secondary data pertaining to the period
from April 2000 to March 2015 was collected for six selected macroeconomic variables and
eleven industry indices. The analysis carried out in the study came to identify that except Nifty
Metals and Nifty Media all other indices including Nifty 50 are influenced by the six
macroeconomic variables selected for the study. The regression analysis conducted to
understand the collective impact of macroeconomic variables on Nifty 50 gave the results that
the index can be predicted the best using the model formulated using only three macroeconomic
variables namely, US Dollar, M3 and gold prices.
Key Words: Macroeconomic variables, Nifty 50, Indian stock market, industry indices,
predictability model.
Introduction
The financial markets provide a platform for the mobilization of funds from saving public to
business and industries and vice versa. Surplus money with the individuals gets transmitted to
the areas in need of funds through money market or capital market which together constitute the
particular, play a vital role in the flow of money in an economy. The undeniable prominence of
the stock markets in investment decisions began with the introduction of limited liability
concept. The concept was introduced for the first time by the United Kingdom under Limited
Liability Act, 1855(Malik, 2006). The limited liability concept led to the increased involvement
of public investors into share market which also encouraged individual and institutional investors
to go for risky investments (Malik, 2006). This makes a study of investments in the stock market
and their influencing factors significant.
There are several factors that affect the stock market fluctuations. India is an emerging economy
and it is generally considered that the stock exchanges of emerging economies are more volatile
in nature. This makes the macro economic factors of the country play a crucial role in its stock
market dynamics.
The dynamics of the financial markets are studied based on fundamental and technical analysis.
The performance of an enterprise is evaluated by analyzing its financial statements. The financial
statements provide information about the true and fair position of the company. The company’s
activities and accomplishments are influenced a lot by the macroeconomic factors, industry
factors and the internal factors of the organization. The detailed study of the economy as a
whole; the industry in which the company belongs to and the financial statements which give an
insight into the company’s state of affairs is known as fundamental analysis. Fundamental
analysis entails the use of information in current and past financial statements, in conjunction
with industry and macroeconomic data to arrive at a firm’s intrinsic value (Kothari, 2001).
“In general, I believe that fundamental analysis has more value than technical analysis because it
provides a much deeper framework for valuing stocks or bonds than just looking at patterns in
past price movements,” says Andreas Sauer, as cited in Harrington (2003, p. 36-37). For an
investment decision which has a long term perspective the best and the most reliable method is to
evaluate the stocks using fundamental analysis ratios (Samaras, Matsatsinis, & Zopounidis,
2008). In the light of the arguments put forward by these researchers, this study tries to
understand the predictability of the index of National Stock Exchange of India, Nifty 50 using
Review of literature
Chen (2009) focuses on the US stock market and investigates its stock returns using the monthly
returns on the S&P 500 price index from 1957 to 2007. Yield spreads (the difference between the
3-Month Treasury Bill Rate and the 10-Year Treasury Constant Maturity Rate, and the difference
between the 3-Month Treasury Bill Rate and the 5-Year Treasury Constant Maturity Rate),
inflation rates (consumer prices), money stocks (M1 and M2), aggregate output (industrial
production), unemployment rates, federal funds rates, nominal effective exchange rates, and
federal government debts are the other variables considered by the researcher. Unit root tests
conducted on the variables led to the rejection of all the hypotheses which indicates to the
absence of a unit root in the series being tested. The researcher states that term spreads and
inflation rates are the most useful predictors of recessions in the US stock market, according to
both in-sample and out-of-sample forecasting performance. He further states that
macroeconomic variables can be useful in predicting bear markets than returns in the stock
market.
Kumar and Puja (2012) studied the Granger causality based on VECM conducted between
Sensex and macroeconomic variables in India and found that no unidirectional or bidirectional
causality existed between Sensex and macroeconomic variable with IIP as an exception. On the
other hand, long run causal relationship is found in the direction from a few macroeconomic
variables like money supply, and interest rates to stock prices.
Long run and short run integration techniques like Johansen and Juselius multivariate
co-integration technique and multivariate VECM were used by Srinivasan (2011)to establish the
relationship between six macroeconomic variables and NSE-Nifty in India. The study disclosed
that the NSE-Nifty share price index has a significant positive long-run relationship with money
supply, interest rate, index of industrial production, and the US stock market index but
significant negative relationship exists between the NSE-Nifty share price index and exchange
rate in the long run. The multivariate VECM reveals that there is a strong unidirectional
causation running from interest rate and the US stock market return to NSE stock market return
in India.
An empirical analysis conducted by Sampath (2011) on the relation between BSE-Sensex and
wholesale price index was conducted based on a time series data ranging from April 1993 to
March 2010. The study revealed that the selected macroeconomic variables are co-integrated
with the BSE stock index in India and they have statistically significant long-run effect on stock
prices.
The exchange rates’ influence on the stock market was investigated in a research work where
data pertaining to eight years period starting from 2004 to 2012 was collected. The variables
selected for the study are USD/INR exchange rate and SENSEX and Nifty 50 as independent and
dependent variables respectively. The granger causality test revealed that over the course of 8
years there exists no relationship between exchange rates and stock market. However,
Correlation result shows that there is very low degree of positive relationship between the two
(Gulati & Kakhani, 2012).
Ray and Sarkar (2014) in their paper attempted to investigate the dynamic relation between the
stock market and the select macroeconomic variables at log-levels, in India, for the period
January 1991 to April 2008. Findings of the study show that the long-run stock market behavior
is positively related to output and exchange rate, and negatively related to short- and long-term
interests, money supply and inflation. The results of the causality and innovation analysis
suggest that the stock market influences the economic activities, more specifically the industrial
activities and the market is expected to be more sensitive to the shocks of itself over the
projected period of the study.
Mohanamani and Sivagnanasithi (2012)analysed the nature and extent of foreign institutional
investment in India to study the relationship between foreign institutional investment and stock
indices. The data collected pertains to the period of 2000-2010 and was collected from official
sources of BSE, NSE and the SEBI. The dependent and independent variables of the study were
market indices (SENSEX and NIFTY) and FIIs respectively. A simple linear relationship
wasshown between these variables with the help of correlation and regression as the data
analysis tools. In the study, the researchers found out that, FIIs tend to buy and sell stocks in bulk
and tend to create major withdrawal effects when they leave. It was also found that Foreign
Institutional Investment and movement of SENSEX and Nifty are closely correlated in India.
Several other researchers have also carried out studies which try to find out the relation between
macroeconomic variables and stock market indices in India and abroad and have come out with
contradictory outcomes in the previous years. Hsing (2011) in his research came to the
conclusion that selected macroeconomic variables either positively or negatively influence the
stock market indices of South Africa.Likewise, Ozcan (2012) came out with the conclusion that
there exists high relationship between the Istanbul Stock Exchange index and the
macroeconomic variables. At the same time Balint (2010) came with the results of her research
that the correlation between macroeconomic variables and thirty stocks listed in Bucharest Stock
Exchange were weak and insignificant. This result was substantiated by a research by Lupu and
Calin (2014)in which they came to a conclusion that except for the stock indices of the country
of Slovenia, all other nations in Europe taken for the study indicated very low dependency
between macroeconomic variables and stock indices.
Problem of the study
An empirical analysis on the relation between BSE-Sensex and macroeconomic variables like
index of industrial production, real effective exchange rate and wholesale price index was
conducted based on a time series data ranging from April 1993 to March 2010. The study
revealed that the selected macroeconomic variables are co-integrated with the BSE stock index
in India and they have statistically significant long-run effect on stock prices (Sampath, 2011)
Studies concerning macroeconomic variables and stock market movements have been carried out
in various countries. India as an emerging economy and also an economy which is looked
forward as a future financial super power by all the other nations needs to get updated in this
respect. Several fruitful studies have been carried out taking Bombay Stock Exchange index,
SENSEX and National Stock Exchange index, Nifty 50 into consideration. This study thus
focuses on this aspect and tries to enlighten the relationship between a few selected
macroeconomic variables and Nifty 50.
Objectives of the study
The study was undertaken with the following objectives:
1) To identify thelevel of correlation between all selected macroeconomic variables with all
the industry stock indices.
3) To identify a fitting model for the prediction of Nifty 50.
Significance of the study
Stock market investments are being done by different classes of people from many walks of life.
Researches in this area have followed different dimensions and established new theories and
models which have facilitated the investment decisions of all kinds of investors. Academicians
from finance and economics have been fascinated with the developments in the stock markets
and the dynamics they have showcased over the years.
The growth of Indian financial markets has been phenomenal in the post liberalization period. As
per the reports of SEBI, the number of registered corporate brokers increased from 3316 in
2000-01 to 4917 in 22000-013-14 and the number of registered sub-brokers increased from 5675 in 2000-2000-01
to 51885 in 2013-14, which counts to 48 percentage and an unbelievable 814 percentage increase
respectively (SEBI, 2010; 2014). The market capitalization of NSE has increased from Rs.
6,578,470 million in 2000-01 to Rs. 72,777,200 million in 2013-14(National Stock Exchange,
2008; 2010; 2014). There have been ups and downs in this journey which is well complemented
by the growth of market participation. The average daily turnover over these years has increased
from Rs. 53,367 million to Rs. 111,892 million (National Stock Exchange, 2008; 2010; 2014).
NSE also witnessed a 134 percentage (720 in 2000-01 to 1688 in 2013-14) rise in the number of
listed companies within this time frame. The introduction of internet stock trading in Capital
Market Segment at NSE in February, 2000 led to an increasingly rising pattern in average
turnover of NSE till 2005-06. With the introduction of NSE InfoTech Services Ltd., the average
turnover almost doubled when compared to preceding years (Singh & Kaur, 2011). This shows
that the establishment of online platforms has increased the participation of retail investors as
well.
A majority of the retail investors are not quite familiar with any of the analysis of stock market
prices. Rather, they are moved by the sudden fluctuations in the indices and also by the rumours.
Hence, when the market prices fall, they come across heavy losses which ultimately will make
them recede from the market. The long term impact of this on the economy is lack of sufficient
capital investment. One of the most important factors that fundamentally affect the stock market
prices is the movements in the macroeconomic variables. The study is aimed at providing a new
observing and analyzing macroeconomic variable movements. The study undertaken, therefore,
has a significance in the modern financial era.
Research methodology
Design
As the current research is aimed at giving an insight into the relationship between the stock
prices and macroeconomic variables and lays a strong foundation and a platform for further
study in the discipline, the study has an exploratory design.
Data and Methodology
The study is focused on the past movements of the stock market and other macroeconomic
variables in India. The information required for analysis, thus, is historically available. Hence,
rather than primary data, secondary data is used in the study.
Monthly closing price of each index was taken as the data for analysis. The data used was for
time period from April, 2000 to March, 2015. Index of the National Stock Exchange, Nifty 50
and the sector based indices of the exchange, namely, Nifty Bank, Nifty IT, Nifty Pharma, Nifty
Media, Nifty Metals, Nifty Finance, Nifty Energy, Nifty FMCG, Nifty Auto and Nifty Realty,
are used in the study as NSE is the stock exchange that has the highest volume of trade in India.
The entire eleven indices are taken into consideration for the analysis. There are sector indices
which had its inception after the initial years of the period of study. Hence, data available from
the date of their inception only is considered for such analysis. The data relating to the indices
were collected from the official website of the National Stock Exchange. The index of IT sector
Nifty IT was initially introduced with a base value of 1000. However, on 1st May 2004 this was
reconstructed into 100. So, for the purpose of the study, the initial years’ index values are
converted from base 1000 to base 100.
Selection of macroeconomic variables was done in two stages. From the works of Maysami,
Howe and Hamzah (2004), Ang and Piazzesi (2003), Zarnowitz (1992) and Bhatia and Jain
(2013), a list of macroeconomic variables were selected in the first stage. The correlation of
these macroeconomic variables with Nifty 50 was calculated and those variables which had the
highest correlation with Nifty 50 were selected for the final study in the second stage. The finally
(CPI) as inflation rate, Broad Money Supply (M3), Exchange Rate of U S Dollar (USD),
International Oil Prices (OP) and International Gold Prices (GP). In the data collection process, it
was found that some variables like CPI and GDP had different base periods for their calculations.
To attain uniformity in the values, the values of each variables were brought under one base year.
In the case of Consumer Price Index (CPI), the values obtained were converted to conform with
base year 1999, and in the case of GDP, quarterly values were obtained for base years 1999-2000
and 2004-2005. As monthly values were not available, the quarterly values were equally divided
into three for the three months pertaining to the quarter. Along with that, the data for all fifteen
years were brought under the base year 1999-2000.The statistics related to these variables are
collected from the official websites of Reserve Bank of India, Ministry of Statistics and
Programme Implementation, Securities and Exchange Board of India, www.indexmundi.com,
www.inflation.eu (Worldwide Inflation Data) and World Gold Council.
Analysis tools
For selecting the variables, that is, finalizing the six macroeconomic variables, simple correlation
was carried out between all the macroeconomic variables and Nifty 50. The six variables which
depicted highest correlation were selected to be put to further analysis. For accomplishing the
objective of identifying relation between the selected macroeconomic variables and the stock
market, both simple and multiple regression was carried out at 95% level of confidence.
Analysis and interpretation
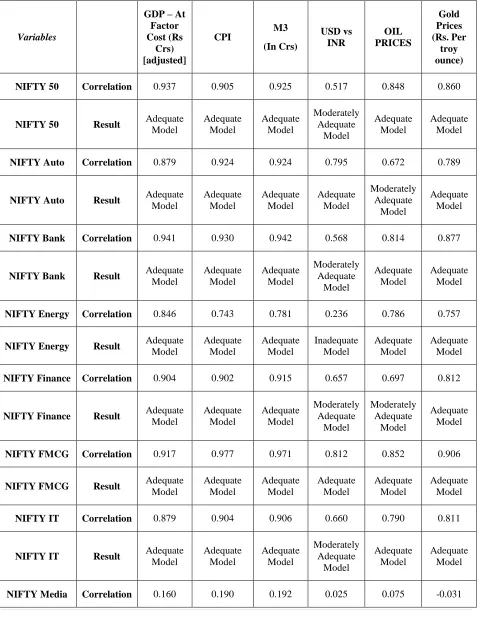
The study looks into the correlation of all the macroeconomic variables with all the industry
stock indices individually. This gives us a holistic view into the relation between these variables
when taken individually. Table 1 provides these values and also gives the results as to whether
the relation is adequate, moderately adequate or inadequate. The classification is made as
mentioned below.
Highly adequate – those values which are greater than or equal to 0.75
Moderately adequate – those values which are more than or equal to 0.50 and below 0.75.
Table 1
Correlation between all selected macroeconomic variables and the industry indices
Variables
GDP – At Factor Cost (Rs Crs) [adjusted] CPI M3 (In Crs) USD vs INR OIL PRICES Gold Prices (Rs. Per troy ounce)
NIFTY 50 Correlation 0.937 0.905 0.925 0.517 0.848 0.860
NIFTY 50 Result Adequate
Model Adequate Model Adequate Model Moderately Adequate Model Adequate Model Adequate Model
NIFTY Auto Correlation 0.879 0.924 0.924 0.795 0.672 0.789
NIFTY Auto Result Adequate
Model Adequate Model Adequate Model Adequate Model Moderately Adequate Model Adequate Model
NIFTY Bank Correlation 0.941 0.930 0.942 0.568 0.814 0.877
NIFTY Bank Result Adequate
Model Adequate Model Adequate Model Moderately Adequate Model Adequate Model Adequate Model
NIFTY Energy Correlation 0.846 0.743 0.781 0.236 0.786 0.757
NIFTY Energy Result Adequate
Model Adequate Model Adequate Model Inadequate Model Adequate Model Adequate Model
NIFTY Finance Correlation 0.904 0.902 0.915 0.657 0.697 0.812
NIFTY Finance Result Adequate
Model Adequate Model Adequate Model Moderately Adequate Model Moderately Adequate Model Adequate Model
NIFTY FMCG Correlation 0.917 0.977 0.971 0.812 0.852 0.906
NIFTY FMCG Result Adequate
Model Adequate Model Adequate Model Adequate Model Adequate Model Adequate Model
NIFTY IT Correlation 0.879 0.904 0.906 0.660 0.790 0.811
NIFTY IT Result Adequate
Model Adequate Model Adequate Model Moderately Adequate Model Adequate Model Adequate Model
NIFTY Media Result Inadequate Model Inadequate Model Inadequate Model Inadequate Model Inadequate Model Inadequate Model
NIFTY Metal Correlation 0.453 0.322 0.362 -0.105 0.396 0.387
NIFTY Metal Result Inadequate
Model Inadequate Model Inadequate Model Inadequate Model Inadequate Model Inadequate Model
NIFTY Pharma Correlation 0.895 0.947 0.945 0.769 0.777 0.834
NIFTY Pharma Result Adequate
Model Adequate Model Adequate Model Adequate Model Adequate Model Adequate Model
NIFTY Realty Correlation -0.722 -0.730 -0.729 -0.731 -0.476 -0.764
NIFTY Realty Result Adequate
Model Adequate Model Adequate Model Adequate Model Inadequate Model Adequate Model
Source: Calculated by the researcher
From the above table it is observed that some of the relations are highly significant but there are
a few indices which do not have any relation with the macroeconomic variables. Those indices
which do not reflect even simple correlation with the macroeconomic variablesare not
investigated in detail in the process of analysis which will be explained in the coming sections.
While analysing the table, it is found that Nifty Media and Nifty Metals do not have simple
correlation with any of the macroeconomic variables under study. This may be due to the reason
that, the indices are not being considered as an attractive investment avenue by the investors as
they consider the banking and IT sector companies. Along with these indices inadequate relation
could be found when USD is correlated with Nifty Energy and the oil prices with Nifty Realty.
These relations are of least significance that their causality and prediction capability has limited
value when considered individually.
Relation between the selected macroeconomic variables and the stock market.
The analysis gives an insight as to those variables having a collective impact on the movements
of Nifty 50. The R-squared (R2) is a statistic that measures the explanatory or predictive power
of a regression model. It is commonly known as coefficient of determination. It is a
of R2, the more dependent is the variable on the independent variables. The variables are
considered to be influencing each other only if the R2 value exceeds 0.50.
The research tried to analyse if the selected macroeconomic variables are collectively leading to
the movements in Nifty 50. To investigate this, multiple regression (backward) was adopted so
as to provide an equation that will help in the prediction of the index.
[image:11.612.70.543.182.724.2]Table 2
Table Showing Result of Multiple Regression Analysis by Keeping Nifty 50 as Dependent
Model
Unstandardized Coefficients
Standardized Coefficients
t Sig. R R2
Adjusted R2
B Std. Error Beta
1 (Constant) 7116.144 958.540 7.424 0.000
0.978 0.957 0.955
GDP 0.003 0.002 0.122 1.371 0.172
CPI -7.785 9.963 -0.188 -0.781 0.436
M3 0.001 0.000 1.863 7.267 0.000
USD -151.004 12.620 -0.422 -11.965 0.000
Oil Prices 0.064 0.049 0.052 1.290 0.199
Gold Prices -0.049 0.005 -0.624 -9.752 0.000
2 (Constant) 6612.234 708.351 9.335 0.000
0.978 0.957 0.955
GDP 0.003 0.002 0.136 1.560 0.121
M3 0.001 0.000 1.683 15.034 0.000
USD -155.367 11.305 -0.434 -13.743 0.000
Oil Prices 0.063 0.049 0.051 1.274 0.205
Gold Prices -0.050 0.005 -0.636 -10.196 0.000
3 (Constant) 6849.286 684.671 10.004 0.000
0.978 0.956 0.955
GDP 0.003 0.002 0.126 1.455 0.148
M3 0.001 0.000 1.716 15.758 0.000
USD -159.148 10.927 -0.445 -14.564 0.000
Gold Prices -0.048 0.005 -0.605 -10.480 0.000
M3 0.001 0.000 1.845 28.863 0.000
USD -168.489 8.869 -0.471 -18.997 0.000
Gold Prices -0.047 0.004 -0.591 -10.351 0.000
Dependent Variable: Nifty 50
Source: Calculated by the researcher
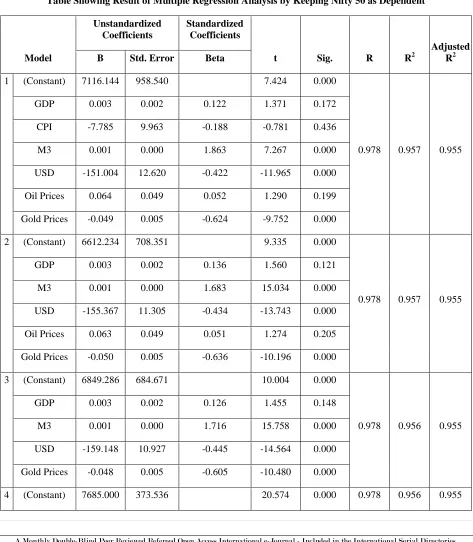
In the multiple regression analysis Nifty 50 was taken as the dependent variable and all the
selected macroeconomic variables were taken as independent variables. This produced several
models which can be understood from table 2. The table shows four models which eliminates
each variable moving from the first to the fourth model.
Model 1 includes all the independent variables under study where we can see that the R2 value is
0.957 which is considerably higher than 0.50. This can be said to be a fit model, but while
observing the t values and the p values (mentioned in column named “sig”), we can understand
that there are certain variables which do not significantly contribute to the model. Variables with
high t value and p values which is lesser than 0.05 are the variables that explains model
significantly. In model 1, three variables namely GDP, CPI and oil prices are found to be
insignificant as the p values are far greater than 0.05. However, after eliminating CPI that is the
variable having the highest p value the other two were retained to see whether these two
variables, namely GDP and oil prices have any collective impact on Nifty 50. The second model
analyses the impact of the five variables on Nifty 50.
Model 2 is created by eliminating CPI. However, this model does not make any difference in R2,
but the t value of the variables other than that of oil prices go up. However, the variables GDP
and oil prices are still insignificant. The p value of oil prices is the highest and this variable is
eliminated to formulate the next model.
Model 3 is drawn after the elimination of Oil prices. This model also gives a high R2 value of
0.956 but we can find GDP as a variable which does not contribute significantly to the model.
The p value of GDP in this model is higher than 0.05 at 0.148. However, the values of all the
other variables have gone up in the results.
Model 4 the final model is formulated by eliminating GDP as it does not significantly contribute
quite significantly to the model as all p values are lesser than 0.05. Thus, we can conclude that
the prediction of Nifty 50 is best done with the help of Model 4 and the model is drawn as under.
Nifty 50 = 7685 + 0.001 M3 – 168.5 USD – 0.047 GP
Thus multiple regression confirms the collective impact of M3, USD and GP only in the
prediction of Nifty 50.
Findings
From the analysis done in this study, we can summarise the findings as below.
In the case of correlation between Nifty 50 and all selected macroeconomic variables, except
for US Dollar which indicates only moderate correlation, all other variables indicated high
correlation and chance of predictability. The correlation values indicate that there exists high
relationship between Nifty industry indices and all selected macroeconomic variables when
taken individually except in the case of Nifty Metals and Nifty Media. These indices do not
indicate even moderate correlation with any of the macroeconomic variables. The correlation
of Nifty Energy and Nifty Realty with US Dollar and oil prices also indicated inadequate
relation as in the case of Nifty Media and Nifty Metals.
The regression analysis indicate that only three macroeconomic variables confirm collective
impact on Nifty 50 movement, namely US Dollar, Gold Prices and broad money supply. The
model developed with this regression analysis has high R2 value which states that 95.6
percent of the variations in Nifty 50 can be explained with these variables.
Conclusion
Some of the cited studies, both national and international, have tried to examine the impact of
macroeconomic variables on the stock prices. A few other studies have tried to examine the other
reasons for the movement of stock prices. In the present study, it is found that in Indian
conditions the prime movers of Nifty 50 are variations in the strength of US Dollar in relation to
Indian Rupee, gold prices and broad money supply. Variations in these variables lead to
References
Ang, A., & Piazzesi, M. (2003). A no-arbitrage vector autoregression of term structure dynamics
with macroeconomic and latent variables. Journal of Monetary Economics, 50, 745-787.
Retrieved from http://web.stanford.edu/~piazzesi/AP.pdf
Balint, C. C. (2010). The correlation between the macroeconomic variables and the Bucharest
Stock Exchange share prices. Finances – Challenges of the Future, 9(12), 189-195.
Retrieved from
http://www.financejournal.ro/fisiere/revista/121981432525_CURUTIU_EN.pdf
Bhatia, B. S., & Jain, A. (2013). Relationship of macroeconomic variables and growth of
insurance in India: A diagnostic study. International Journal of Advances in Management
and Economics, 2(6), 50-54. Retrieved from
www.managementjournal.info/download1.php?f=0802062013.pdf
Chen, S.-S. (2009). Predicting the bear stock market: Macroeconomic variables as leading
indicators. Journal of Banking and Finance, 33(2), 211-223. Retrieved from
https://scholar.google.co.in/scholar?hl=en&q=Predicting+the+bear+stock+market%3A+
Macroeconomic+variables+as+leading+indicators&btnG=
Gulati, D.& Kakhani, M. (2012). Relationship between stock market and foreign exchange
market in India: An empirical study. Pacific Business Review International, 5(5), 66-71.
Retrieved from http://www.pbr.co.in/Vol-5%20Iss-5/7.pdf
Harrington, C. (2003). Fundamental vs. technical analysis: Controversy between the two schools
is still alive and well. CFA MAGAZINE , pp. 36-37. Retrieved from www.cfapubs.org:
http://www.cfapubs.org/doi/pdf/10.2469/cfm.v14.n1.2789
Hsing, Y. (2011). The stock market and macroeconomic variables in a BRICS country and
policy implications. International Journal of Economics and Financial Issues, 1(1),
12-18.
Index Mundi. (2015, August). Crude oil (petroleum) monthly price - Indian rupee per barrel.
Retrieved on September 5, 2015, from www.indexmundi.com:
inflation.eu - Worldwide inflation data. (2015). Historic inflation India - CPI inflation. Retrieved
on September 15, 2015, from www.inflation.eu:
http://www.inflation.eu/inflation-rates/india/historic-inflation/cpi-inflation-india.aspx
Kothari, S. P. (2001). Capital markets research in accounting. Journal of Accounting and
Economics, 31(1), 105-231. Retrieved from
http://citeseerx.ist.psu.edu/viewdoc/download?doi=10.1.1.200.1558&rep=rep1&type=pdf
Kothari, C. R. (2004). Research methodology: Methods and techniques (Second ed.). New Delhi:
New Age International Publishers.
Kumar, N. P., & Puja, P. (2012). The impact of macroeconomic fundamentals on stock prices
revisited: An evidence from Indian data. Retrieved from mpra.repec.org/:
http://mpra.ub.uni-muenchen.de/38980/2/MPRA_paper_38980.pdf
Lupu, R. & Calin, A. C. (2014). A mixed frequency analysis of connections between
macroeconomic variables and stock markets in central and eastern Europe. Financial
Studies, 69-79.
Maysami, R. C., Howe, L. C., & Hamzah, M. A. (2004). Relationship between macroeconomic
variables and stock market indices: Cointegration evidence from stock exchange of
Singapore’s all-S sector indices. Jurnal Pengurusan, 24, 47-77. Retrieved from
http://core.ac.uk/download/pdf/11490872.pdf
Malik, D. M. (2006). International Aspects of Corporate Law and Governance. School of Law.
UK: University of Warwick. Retrieved October 22, 2015, from
http://www.dgtrdt.gov.pk/research/limited-liablity.pdf
Mohanamani, P., & Sivagnanasithi, T. (2012). Impact of Foreign Institutional Investors on the
Indian Capital Market. Journal of Contemporary Research in Management, 7(2).
National Stock Exchange. (2008; 2010; 2014). Indian securities market, A review (ISMR) - 2008;
2010; 2014. Mumbai: www.nseindia.com.
Ozcan, A. (2012). The relationship between macroeconomic variables and ISE industry index.
Ray, H.& Sarkar, J. (2014). Macroeconomic link to Indian capital market: A post-liberalization
evidence. Modern Economy, 5, 272-288. Retrieved from
http://search.proquest.com/business/docview/1518675968/fulltextPDF/E4020AF6277949
BAPQ/3?accountid=171177
Reserve Bank of India. (2015). Reference Rate Archive. Retrieved on September 25, 2015, from
www.rbi.org.in: https://rbi.org.in/scripts/ReferenceRateArchive.aspx
Samaras, G. D., Matsatsinis, N. F. & Zopounidis, C. (2008). A multicriteria DSS for stock
evaluation using fundamental analysis. European Journal of Operational Research,
187(3), 1380-1401. Retrieved October 22, 2015, from
http://www.sciencedirect.com/science/article/pii/S0377221706008459
Sampath, T. (2011). Macroeconomic variables and stock prices in India: An empirical analysis.
The IUP Journal of Monetary Economics, 9(4), 43-55.
Singh, D. G. & Kaur, S. (2011). Growth and performance of turnover in capital market segment
at the National Stock Exchange. Management Convergence, 51-63.
Srinivasan, P. (2011). Causal nexus between stock market return and selected macroeconomic
variables in India: Evidence from the National Stock Exchange (NSE). The IUP Journal
of Financial Risk Management, 8(4), 7-24.
Saji, T. G. (2013). Time varying macroeconomic risk and industry stock returns: Empirical
evidence from India. Asian Journal of Finance & Accounting, 5(2), 289-304.
SEBI. (2010; 2014). Handbook of Statistics on Indian Securities Market. Research Department.
Mumbai: www.sebi.gov.in. Retrieved on May 5, 2015, from
http://203.199.247.102/sebiweb/home/list/4/32/0/0/Handbook-of-Statistics
U S Bureau of Labour Statistics. (2011). Focus on Prices and Spending: www.bls.gov. Retrieved
on November 4, 2015, from
http://www.bls.gov/opub/btn/archive/differences-between-
the-consumer-price-index-and-the-personal-consumption-expenditures-price-index-pdf.pdf
World Gold Council. (2013). Why invest in gold. Retrieved December 4, 2015, from
World Gold Council. (2015). Download the gold price in a range of currencies since December
1978 . Retrieved on September 25, 2015, from www.gold.org:
http://www.gold.org/research/download-the-gold-price-since-1978
Zarnowitz, V. (1992). Major macroeconomic variables and leading indexes. In V. Zarnowitz,
Business Cycles: Theory, History, Indicators, and Forecasting (pp. 357-382). Chicago.