Network Traffic Measurement for
the Next Generation Internet
Dimitrios P. Pezaros, B.Sc. (Hons.), MIEEE
Computing Department
Lancaster University
England
SUBMITTED FOR THE DEGREE OF DOCTOR OF PHILOSOPHY
Στη µνήµητωννεκρώντηςεξέγερσηςτουΠολυτεχνείου, τονΝοέµβρη 1973:
ΣπύροςΚοντοµάρης (57) ΑλέξανδροςΣπαρτίδης (16)
∆ιοµήδηςΚοµνηνός (17) ∆ηµήτρηςΠαπαϊωάννου (60)
ΣωκράτηςΜιχαήλ (57) ΓιώργοςΓεριτσίδης (47)
Toril Margrethe Engeland (22) ΒασιλικήΜπεκιάρη (17)
ΒασίληςΦάµελλος (26) ∆ηµήτρηςΘεοδωράς (5)
ΓιώργοςΣαµούρης (22) ΑλέξανδροςΒασίλης (Μπασρί) Καράκας (43)
∆ηµήτρηςΚυριακόπουλος (35) ΑλέξανδροςΠαπαθανασίου (59)
ΣπύροςΜαρίνος (31) ΑνδρέαςΚούµπος (63)
ΝίκοςΜαρκούλης (24) ΜιχάληςΜυρογιάννης (20)
ΑικατερίνηΑργυροπούλου (76) ΚυριάκοςΠαντελεάκης (44)
ΣτέλιοςΚαραγεώργης (19) ΣτάθηςΚολινιάτης (47)
ΜάρκοςΚαραµανής (23) ΓιάννηςΜικρώνης (22)
To the memory of the students and the civilians murdered during the tragic events that followed the public uprising at the National Technical University of Athens (NTUA) in November 1973:
Spyros Kontomaris (57) Alexandros Spartidis (16)
Diomidis Komninos (17) Dimitris Papaioannou (60)
Socrates Mihail (57) Giorgos Geritsidis (47)
Toril Margrethe Engeland (22) Vasiliki Mpekiari (17)
Vasilis Famellos (26) Dimitris Theodoras (5)
Giorgos Samouris (22) Alexandros Vasilis (Bashri) Karakas (43)
Dimitris Kyriakopoulos (35) Alexandros Papathanasiou (59)
Spyros Marinos (31) Andreas Koumpos (63)
Nikos Markoulis (24) Michalis Myrogiannis (20)
Ekaterini Argyropoulou (76) Kyriakos Panteleakis (44)
Stelios Karageorgis (19) Stathis Koliniatis (47)
Markos Karamanis (23) Giannis Mikronis (22)
Abstract
Measurement-based performance evaluation of network traffic is a fundamental prerequisite for the provisioning of managed and controlled services in short timescales, as well as for enabling the accountability of network resources. The steady introduction and deployment of the Internet Protocol Next Generation (IPNG-IPv6) promises a network address space that can accommodate any device capable of generating a digital heart-beat. Under such a ubiquitous communication environment, Internet traffic measurement becomes of particular importance, especially for the assured provisioning of differentiated levels of service quality to the different application flows. The non-identical response of flows to the different types of network-imposed performance degradation and the foreseeable expansion of networked devices raise the need for ubiquitous measurement mechanisms that can be equally applicable to different applications and transports.
Acknowledgments
There has been such a long list of people with whom interaction has enriched my life during the last five years that I could not possibly include all of them in these lines. I will always remember their invaluable contributions through the sharing of wonderful experiences, which influenced not only the evolution of this work, but also my overall personal blossoming. I am particularly indebted to the following people for their prompt and supportive encouragement, their guidance, and the selfless sharing of their knowledge and experience, without which this thesis would have not been possible as it stands.
I would like to express my very special gratitude to my academic supervisor, Professor David Hutchison, for his endless support, his professional guidance, his friendship, and the highly positive impact of his personality on my first steps in the international research community. By being my advisor throughout all my studies and my work at Lancaster University, David has taught me how to set high professional standards and conduct quality research in a self-confident and always optimistic manner.
Throughout my doctoral studies, I have been privileged to been offered an industrial fellowship from Agilent Laboratories, Scotland. I could not find the appropriate words to express my special gratitude to Agilent Technologies in general, and to individual members of the Telecommunications Solutions Department of Agilent Laboratories in particular, for their financial and practical support of this research. I wish this thesis stands up to their high standards. I would like to thank Professor Joe Sventek, who initiated this industrial fellowship, not only for his trust, but also for his highly-competent views and comments on numerous aspects of this work. This thesis would have not been possible as it stands, without the invaluable contributions of Dr. Francisco Garcia and Dr. Robert Gardner, with whom I had the privilege to work closely throughout my doctoral studies. I wish to sincerely thank them for always considering me as part of their extended team, for teaching me many aspects of systems and network research, and also for their friendship.
encouragement during the last stages of my studies. I would like to thank Dr. Steven Simpson, Dr. Christopher Edwards, Dr. Paul Smith, Dr. Michael Mackay, and Dr. John Cushnie, for sharing their knowledge, but mostly for their friendship.
My very special thanks are also due to some very good friends who, over the years, offered their selfless emotional and also practical support. Panos Gotsis has generously shared his deep system administration knowledge, and provided invaluable systems support. Theodore Kypraios offered tremendous help during the descriptive statistical analysis of the experimental results documented in this thesis. Manolis Sifalakis has been a great friend and colleague whose axiomatic optimism taught me that modesty can perfectly match with self-confidence. Kostas Georgopoulos and Erasmia Kastanidi stood by me and offered great emotional support, especially during the last stages of this work, when suddenly everything seemed to be getting more difficult. I will never forget the Lancaster's good-old Greek Ph.D. gang and the great experiences I shared with Dr. Christos Efstratiou, Dr. Andrianos Tsekrekos, and Dr. Anthony Sapountzis.
My beloved Lena Gogorosi offered me an unquantifiable amount of love and support without which my life would have been very different. I feel that I could not thank her enough for the moments we shared together.
I wish to sincerely thank Deborah J. Noble for teaching me how to speak, read and write the English language during my childhood, and for remaining a good friend thereafter.
Declaration
This thesis has been written by myself, and the work reported herein is my own. The documented research has been carried out at Lancaster University, and was fully funded by Agilent Technologies Laboratories, Scotland, through an industrial fellowship.
The work reported in this thesis has not been previously submitted for a degree in this, or any other form.
Table of Contents
Chapter 1... 1
Introduction ... 1
1.1 Overview ... 1
1.1.1 Aims ... 2
1.2 Motivation (Multi-service networks, QoS provisioning, and Internet traffic dynamics) ... 3
1.3 Internet Measurements ... 4
1.4 Thesis outline ... 7
Chapter 2... 9
Internet Measurements: Techniques, Metrics, Infrastructures, and Network Operations ... 9
2.1 Overview ... 9
2.2 Active Measurements and Performance Metrics... 10
2.2.1 Different Levels of Performance Metrics ... 12
2.2.2 The IETF IP Performance Metrics (IPPM) Working Group ... 13
2.2.3 ICMP-based Active Measurements ... 19
2.2.3.1 The Ping End-to-end Reporting (PingER) Project ... 21
2.2.3.2 The Skitter Project ... 24
2.2.3.3 Measuring Unidirectional Latencies Using Variations of Ping... 26
2.2.4 UDP and TCP-based Active Measurements... 27
2.2.4.1 RIPE NCC TTM Project ... 28
2.2.4.2 Surveyor... 30
2.2.4.3 AT&T Tier 1 Active Measurements ... 32
2.2.4.4 End-to-end Internet Traffic Analysis ... 33
2.2.5 The Active Measurement Project (AMP) and the Internet Performance Measurement Protocol (IPMP)... 35
2.2.6 Bandwidth Estimation ... 39
2.3 Passive Measurements and Network Operations... 44
2.3.1 Simple Network Management Protocol (SNMP) ... 45
2.3.1.1 Standardised SNMP-based Network Monitoring: RMON and RMON2 ... 48
2.3.1.2 Open-source, SNMP-based Monitoring Tools... 52
2.3.2 Flow Measurements... 53
2.3.2.1 The IETF Real-time Traffic Flow Measurement (RTFM) Working Group... 54
2.3.2.2 Cisco IOS® Netflow ... 57
2.3.2.3 The Internet Protocol Flow Information eXport (IPFIX) Working Group... 60
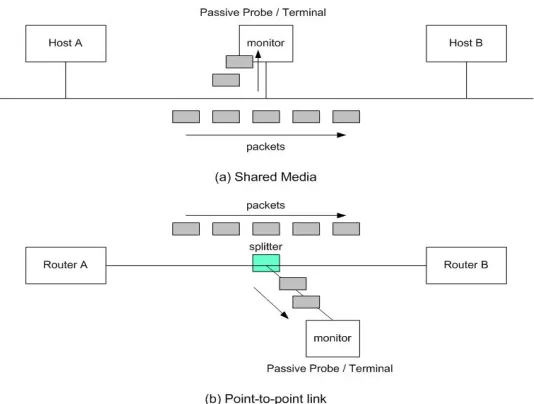
2.3.3 Packet Monitoring ... 61
2.3.3.1 Shared Media Vs. Point-to-point Links... 62
2.3.3.2 Data-Link Layer Access... 64
2.3.3.3 Hardware-Assisted Packet Capturing: DAG Cards (example)... 65
2.3.4 Network Operations... 72
2.3.5 Need for Sampling... 75
2.3.5.1 Trajectory Sampling... 77
2.3.5.2 The IETF Packet SAMPling (PSAMP) Working Group ... 78
2.4 Summary ... 78
Chapter 3... 80
In-Line Service Measurements and IPv6 ... 80
3.1 Overview ... 80
3.2 Limitations of Active Measurement Techniques... 81
3.3 Limitations of Passive Measurement Techniques ... 85
3.4 In-Line Measurements: A New (Hybrid) Measurement Technique ... 88
3.4.1 On the Scope of the In-line Measurement Technique... 93
3.5 Internet Protocol: How It Was Not Designed For Measurement... 94
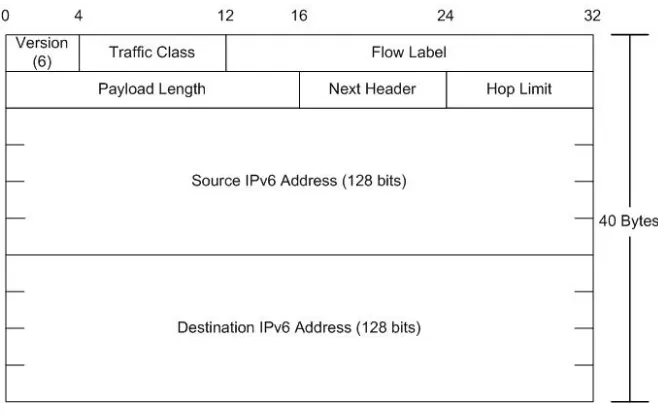
3.6 The Internet Protocol version 6 (IPv6)... 98
3.6.1 IPv6 Extension Headers and Optional Functionality... 100
3.6.2 The Destination Options Extension Header... 103
3.7 The Measurement Plane for IPng: A Native Measurement Technique ... 106
3.7.1 Multi-point Measurement ... 108
3.7.2 Ubiquitous Applicability ... 110
3.8 In-Line Measurement Headers and Options... 110
3.8.1 One-Way Delay (OWD) TLV-encoded Option... 114
3.8.2 One-Way Loss (OWL) TLV-encoded Option ... 117
3.9 Flexibility: The Different Notions of end-to-end ... 120
3.10 Measurement Instrumentation for Next Generation, all-IP Networks: Applications and Implications... 123
3.11 Summary ... 126
Chapter 4... 128
Implementing In-Line Measurement in Systems’ Protocol Stacks ... 128
4.1 Overview ... 128
4.2 Decouple the Measurement Technique from Particular Measurement Applications ... 129
4.3 Measurement Instrumentation within Network Nodes and End-Systems ... 133
4.4 In-Line Measurement Technique: The Prototype... 136
4.4.1 The Linux Kernel Network Model ... 140
4.4.2 Extending the Linux IPv6 Implementation... 143
4.4.2.1 The Netfilter Hooks in the Linux Kernel ... 145
4.4.2.2 The In-line Measurement Hooks in the Linux Kernel... 147
4.4.3 Measurement modules as Linux Dynamically Loadable Kernel Modules (LKM)... 149
4.4.3.1 Generic Functionality of a Source Measurement Module... 153
4.4.3.2 General Functionality of a Destination Measurement Module ... 155
4.4.3.4 The One-Way Loss (OWL) Measurement Modules ... 159
4.4.3.5 Communicating Data between Measurement LKMs and User Processes... 161
4.4.3.6 Measurement Scope, Granularity and Cost Reduction: Partial Byte Capture, Filtering and Sampling ... 163
4.4.3.7 Dealing with Interface and Path Maximum Transfer Unit (MTU) Issues... 167
4.4.4 Complementary Higher-Level Processes... 171
4.4.4.1 Re-Constructing Bi-directional flows from unidirectional packet traces ... 174
4.5 Summary ... 176
Chapter 5... 177
Instrumenting IPv6 Application Flows... 177
5.1 Overview ... 177
5.2 Mobile-IPv6 Systems Research Laboratory (MSRL)... 178
5.2.1 Measurement testbeds within the IPv6 Testbed... 180
5.3 Implementing Representative Performance Metrics ... 183
5.4 TCP Measurements ... 188
5.4.1 Time-Related Measurements ... 190
5.4.2 Packet Loss Measurements... 199
5.5 UDP Measurements... 203
5.5.1 Time-Related Measurements ... 204
5.5.2 Packet Loss Measurements... 210
5.6 Time Synchronisation Issues... 213
5.7 Overhead ... 215
5.7.1 TCP Maximum Segment Size (MSS) and Performance... 222
5.7.2 System Processing Overhead and Scalability ... 223
5.8 Comparative Analysis ... 224
5.8.1 Quantitative Comparison... 224
5.8.2 Qualitative Comparison... 231
5.9 Summary ... 234
Chapter 6... 235
Conclusions and Future Work ... 235
6.1 Overview ... 235
6.2 Thesis Summary... 236
6.3 Main Contributions... 238
6.3.1 Ubiquity... 238
6.3.2 Relevance to Operational Traffic Service Quality... 238
6.3.3 Minimal Impact on the Network... 239
6.3.4 Direct (Targeted) Service Measurement... 240
6.3.5 Transparency ... 240
6.3.6 Incremental Deployment ... 240
6.3.7.1 Internet Measurement Techniques Taxonomy ... 241
6.3.7.2 Modular In-line Measurement System Prototype ... 241
6.3.7.3 Per-Packet Measurement Experimental Findings ... 241
6.4 Future Directions... 242
6.5 Concluding Remarks ... 244
References ... 246
List of Figures
Figure 2-1: ICMP Echo Request or Reply Message Format ... 20
Figure 2-2: Graphical Representation of the PingER Architecture ... 22
Figure 2-3: Skitter Output Packets ... 25
Figure 2-4: ICMP Timestamp Request or Reply Message Format... 26
Figure 2-5: Overview of the RIPE NCC TTM Measurement Setup ... 30
Figure 2-6: The IPMP Echo Packet... 37
Figure 2-7: Path Record Format ... 37
Figure 2-8: Pipe Model with Fluid Traffic of a Network Path ... 40
Figure 2-9: Graphical Illustration of the packet pair technique... 42
Figure 2-10: Internet Architecture Model... 46
Figure 2-11: Partial Organisation of the Internet Registration Tree ... 47
Figure 2-12: The RTFM Architecture ... 54
Figure 2-13: Different NeTraMet Configurations ... 56
Figure 2-14: Netflow Export (v5) Datagram Format... 58
Figure 2-15: Tapping into (a) shared media and (b) point-to-point network link... 63
Figure 2-16: Packet Capture using BPF ... 64
Figure 2-17: DAG Series Architecture... 66
Figure 2-18: CoralReef Software Components ... 71
Figure 2-19: Path, Traffic, and Demand Matrices for Network Operations ... 73
Figure 3-1: In-line Measurement Technique ... 90
Figure 3-2: The Alternative Places within the TCP/IP Stack where a Measurement Protocol Could be Defined ... 95
Figure 3-3: The IP(v4) Header ... 96
Figure 3-4: The IP Timestamp Option ... 97
Figure 3-5: The Latest Internet Domain Survey (January 2005)... 99
Figure 3-6: The IPv6 Main Header... 100
Figure 3-7: IPv6 Extension Headers’ Encoding ... 101
Figure 3-8: The IPv6 Destination Options Header ... 103
Figure 3-9: IPv6 TLV-encoded Option format... 104
Figure 3-10: The Two Padding Options Defined for IPv6 ... 105
Figure 3-11: In-Line IPv6 Measurements Operation... 107
Figure 3-12: Encapsulation of TLV-encoded Measurement Options within IPv6 Data Packets... 111
Figure 3-13: OWD Option Encapsulated in a Destination Options header ... 114
Figure 3-14: One-Way Loss Option Encapsulated in a Destination Options header... 117
Figure 3-15: OWD and OWL Options simultaneously encoded in a single IPv6 Destination Options header ... 119
Figure 3-16: Different scopes of two-point measurement ... 120
Figure 3-18: Edge-to-Edge Inline Measurement Instrumentation ... 122
Figure 3-19: In-line measurement within ISP network boundaries ... 125
Figure 4-1: A Distributed, In-line Measurement Framework... 130
Figure 4-2: Abstract Model of a Network Element ... 134
Figure 4-3: In-line Measurement Prototype ... 137
Figure 4-4: Structure of a Socket Buffer (struct sk_buff)... 141
Figure 4-5: Operations on the Packet Data Area of a Socket Buffer... 142
Figure 4-6: Linux Kernel IPv6 Implementation with In-line Measurements Extensions (Hooks) ... 144
Figure 4-7: Generic Operation of a Source Measurement Module (LKM) ... 153
Figure 4-8: Generic Operation of a Destination Measurement Module (LKM)... 156
Figure 4-9: Systematic Sampling Schemes ... 166
Figure 4-10: Sequence of Messages in TCP three-way Handshake ... 170
Figure 4-11: Prototype Architecture and Software Components... 171
Figure 4-12: Bi-directional In-line Measurement Instrumentation... 174
Figure 4-13: TCP Connection Dictionary... 175
Figure 5-1: Mobile IPv6 Testbed... 178
Figure 5-2: IPv6 Testbed Layer 3 Infrastructure ... 180
Figure 5-3: Measurement Testbeds within the MSRL Infrastructure ... 181
Figure 5-4: Histograms of the Per-Packet Transfer Rate - Data and Reverse Paths... 191
Figure 5-5: Packet Inter-Departure vs. Inter-Arrival Times - Data Path ... 194
Figure 5-6: Per-Packet Transfer Rate vs. Packet Size - Reverse (ACK) Path ... 195
Figure 5-7: Density Plots of the TCP Per-Packet Transfer Rate – Data Path ... 197
Figure 5-8: Per-Packet Transfer Rate vs. Packet Size - Reverse (ACK) Path ... 198
Figure 5-9: Instantaneous Packet Loss of a TCP Data Transfer over the 11Mb/s wireless topology... 200
Figure 5-10: Out-Of-Order Datagram Delivery ... 201
Figure 5-11: Instantaneous Packet Loss of a TCP Data Transfer over the 512 kb/s ADSL Downlink 201 Figure 5-12: Instantaneous Packet Loss of a TCP Data Transfer over the 256 kb/s ADSL Uplink ... 202
Figure 5-13: End-to-end One-Way Delay and Jitter of UDP Video Streaming over an 11Mb/s Path . 204 Figure 5-14: Packet Inter-Departure vs. Packet Inter-Arrival Times - UDP Streaming over the 11 Mb/s Path ... 205
Figure 5-15: End-to-end One-Way Delay and Jitter of UDP Video Streaming over a 512 Kb/s Path . 207 Figure 5-16: Packet Inter-Departure vs. Packet Inter-Arrival Times - UDP Streaming over 512 Kb/s 208 Figure 5-17: End-to-end One-Way Delay and Jitter of UDP Video Streaming over a 256 Kb/s Path . 209 Figure 5-18: Packet Inter-Departure vs. Packet Inter-Arrival Times - UDP Streaming over 256 Kb/s 210 Figure 5-19: Instantaneous Packet Loss over the wireless 11 Mb/s Topology... 211
Figure 5-20: Instantaneous Packet Loss over the Asymmetric DSL (512/256 Kb/s) Topology... 212
Figure 5-21: Different Synchronisation (red, dashed) and Measurement (blue, long-dashed) Paths for the 11 Mb/s Experiments ... 214
Figure 5-23: One-Way-Delay boxplot and pdf for Systematic Once-every-M seconds Sampling Scheme
– TCP Data Path ... 218
Figure 5-24: One-Way-Delay boxplot and pdf for Systematic One-in-N Sampling Scheme – TCP Reverse (ACK) Path ... 219
Figure 5-25: One-Way-Delay boxplot and pdf for Systematic Once-every-M seconds Sampling Scheme – TCP Reverse (ACK) Path... 219
Figure 5-26: One-Way-Delay boxplot and pdf for Systematic One-in-N Sampling Scheme – UDP Streaming Flow... 220
Figure 5-27: One-Way-Delay boxplot and pdf for Systematic Once-every-M seconds Sampling Scheme – UDP Streaming Flow... 220
Figure 5-28: Boxplots of the One-way Delay experienced by TCP Data, Acknowledgment and ICMP Traffic ... 225
Figure 5-29: Boxplots of the One-way Delay experienced by UDP and ICMP Traffic ... 226
Figure 5-30: Inter-arrival Jitter for Iperf UDP flows over 10-Second Intervals ... 228
List of Tables
Table 1: The five metrics defined for the PingER analysis ... 22
Table 2: Option Type Identifier Internal Encoding ... 104
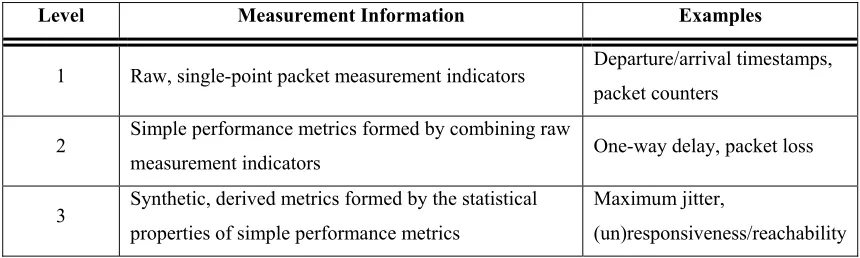
Table 3: The Different Levels of Measurement Information... 109
Table 4: OWD Option fields ... 115
Table 5: One-Way Loss Option fields... 118
Table 6: Details of two FTP Sessions Measured over the Wireless (11 Mb/s) Topology ... 190
Table 7: TCP Goodput Measured by the In-line Measurement Modules and Pure-FTPd Respectively192 Table 8: Average Arrival Time and Mean One-Way Delay for the two File Transfers ... 194
Table 9: Details of a FTP Session Measured over the ADSL (512 kb/s) Topology... 196
Table 10: Details of a FTP Session Measured over the ADSL (256 kb/s) Topology... 196
Table 11: Mean Per-Packet Transfer Rate and TCP Goodput over the Assymetric DSL Topology .... 198
Table 12: Details of the Data Path of Two File Transfers Measured over the ADSL Topology... 203
Table 13: Summaries of the Distributions of the Measured Phenomena over the 11 Mb/s Topology . 206 Table 14: Summaries of the Distributions of the Measured Phenomena over the 512 Kb/s Topology 208 Table 15: Summaries of the Distributions of the Measured Phenomena over the 256 Kb/s Topology 210 Table 16: Summary of Loss-Related Phenomena over the Wireless and ADSL Topologies... 212
Table 17: Measurement Data Overhead Details for TCP Data, Reverse and UDP flows' Paths ... 217
Table 18: Measurement Data Overhead Details for the OWD Instrumentation of Bulk TCP Data and UDP flows using the One-in-100 Packet Sampling Scheme ... 222
Table 19: Details of the Inter-Arrival Jitter Computed by Iperf and the In-Line Measurement Modules ... 228
Table 20: Details of the Packet Loss Computed by Iperf and the In-Line Measurement Modules ... 231
Chapter 1
1
Introduction
1.1
Overview
he Internet is persistently expanding and evolving into a global communications medium, consisting of heterogeneously inter-connected systems and carrying an increasing mix of traffic flows with diverse characteristics and performance requirements. Consequently, network operators and service providers are faced with the major challenge of being able to provide a stable service with consistently predictable performance characteristics, as these can be defined by a combination of metrics and associated thresholds to include low and invariable latency, highly reliable datagram delivery, and high network availability [FeHu98]. In doing so, and especially when considering introducing preferential treatment to some arbitrary amount of network traffic, as opposed to all traffic being treated as best-effort, then the necessary mechanisms need to be in place to provide feedback over the different service quality characteristics experienced by the different traffic flows.
Provision of predictable and dynamically managed services in the context of telecommunications networks can be achieved by employing the triptych of Measurement, Monitoring and Control (MMC), whose principal activities are concerned with assessing and assuring the infrastructural behaviour and the operational traffic dynamics in relatively short timescales. Quantitative measures of such temporal performance properties can be then used to provide the necessary input to control and adaptation algorithms, which ultimately facilitate a managed and optimised operation of the networked environment. Measurement and monitoring need to be always-on mechanisms to continuously report infrastructural and network components status, and most importantly, to assess the perceived performance of the operational traffic flows (at a local, network-wide, or even end-to-end level) a combinational and highly fluctuant attribute at potentially very short timescales.
However, network and inter-network performance measurements have traditional been seen as being part of a distinct control plane of the Internet, rather than an integrated component of
the main store-and-forward data plane mechanism which is the core of the Internet operation. The top level architectural goal of the Internet has been to provide an effective and highly decentralised technique to multiplex utilisation of existing inter-connected networks, assuming a combination of simple, transparent core (network) with rich end-system functionality, and an overall multi-administrative structure [Clar88]. Although the Internet owes much of its success to this design philosophy, at the same time, performance measurement and resource optimisation have consequently been mostly considered as an afterthought, and in many cases have been deployed in an ad-hoc manner. Hence, in the event of (partial) failure, much manual, static configuration, diagnosis and design is required [ClPR03].
1.1.1
Aims
This thesis focuses on the investigation of measurement techniques adequate to assess the Internet’s traffic perceived performance, by seeking minimal cooperation of the network’s edge-nodes and/or end-systems (where intelligence and rich functionality exist), and by being seamlessly and inexpensively integrated with the Internet’s main forwarding mechanism. The definition, design, prototype system implementation and experimental validation of in-line measurement, a new measurement technique for the next generation Internet, comprise the core of this thesis. Instead of incrementally improving certain aspects of the existing measurement approaches in order to overcome some of their well-known limitations, this thesis aims at raising the importance of extending the fundamental classification of active and
passive measurements by establishing a new paradigm to address the issue of directly
revealing the service quality experienced by the actual user traffic.
It is envisaged that in-line measurement can potentially provide for an always-on operation, and form an integral part of broader MMC frameworks, capable of timely communicating the operational traffic’s performance characteristics with network operations and control systems.
1.2
Motivation (Multi-service networks, QoS provisioning,
and Internet traffic dynamics)
The Internet Protocol (IP) is emerging as the ubiquitous, universal convergence layer in the gradual marriage of telephony networks with data communications networks. The result is the increasing aggregation of multi-service traffic onto IP networks that carry various equivalence classes of network flows, but operate largely, by nature, according to the best-effort paradigm. In addition, it has been a long time since the Internet was (simply) a large research project; it has now evolved to comprise a large and complicated full-fledged business interest for most organizations connected to the global Internet, since it provides services that complement and sometimes even substitute traditional business model processes, such as, for example, e-commerce and IP telephony. It becomes evident that the current best-effort datagram delivery service as it stands cannot provide an adequate mechanism for a future global communication medium that will potentially carry critical services, substituting today’s traditional and diverse networks1. Performance guarantees will need to be provided, and mechanisms to enable pro-active as well as re-pro-active optimisation and control based on the actual traffic perceived performance will need to be in place to enhance the Internet operation. Consequently, the different service quality requirements, and non-identical sensitivities and responses to potential service degradation of the different equivalence traffic classes make timely and accurate measurement of actual network flow performance essential.
Service quality in the Internet can be expressed as the combination of network-imposed delay, jitter (variation in end-to-end transit delay), maximal sustained data transfer rate (bandwidth), and reliability2 (average error rate of the transmission medium). Consistent service quality provisioning has been researched under the broad area of Quality of Service (QoS). Practically, the main focus of QoS-related activities has been to provide preferential treatment to some arbitrary amounts of traffic, as opposed to all traffic being treated as best-effort, by increasing the quality level of one or more of the aforementioned metrics for particular categories of traffic. Supplementary architectures have been researched and defined, in an attempt to enhance the Internet environment with the ability to provide differentiated levels of service and consequently quantitative and/or statistical guarantees to certain portions of the
1 For example, if telephony is migrated from the traditional Public Switched Telephone Network
(PSTN) to be carried over the Internet infrastructure, then high system availability guarantees must be provided, since it is a critical system. Another example of a safety critical communication system is the railway signalling system.
2 Reliability can be expressed in terms of out-of-order datagram delivery, loss, and erroneous
Internet workload, at different granularity levels [BrCS94, BlBC98, RoVC01]. However, the fluctuating traffic dynamics and the unpredictable multiplexing of different traffic flows, as well as the gradual (if not rapid) introduction of new services and traffic types, makes the accurate and timely measurement of flows’ perceived performance a key to the success of continuously delivering good service quality and predictably sustainable QoS levels.
Operators have largely relied on statically engineered over-provisioning of networks to avoid congestion and saturation of resources, especially at the core of the Internet. Indeed, advances in transmission capacities allowed over-provisioning to facilitate a non-congested core however, especially when moving to the edges of the Internet congestion is implicitly opposed by TCP’s congestion control and by bandwidth rate limiting enforced by Internet Service Providers (ISP)s. Nevertheless, the number of always-on Internet users is expanding, broadband home connectivity is becoming a commodity, and soon users will have gigabit ethernet on their (corporate) desktops. Hence, causing congestion, especially at the edges, can be a matter of an appropriate new killer application development. As an example, recent studies have reported that peer-to-peer (p2p) file sharing systems have been increasingly popular, and in some cases p2p traffic wins the lion’s share from the previously dominant World-Wide Web (WWW) workloads [AzGu03]. The potential of any arbitrary end-system to become a highly-loaded p2p server for an arbitrary amount of time constitutes the presence of largely unpredictable and variable traffic dynamics more than simply possible. Indeed, long-lasting flash-crowd events have already been reported in certain p2p topologies [PoGE05]. All these factors constitute measurement-based performance evaluation and re-active network engineering and optimisation a necessity for multi-service, next generation networks. Measurements revealing the real service experienced by user traffic can prove valuable for long and short term network design decisions, dynamic traffic engineering, as well as for Service Level Agreement (SLA) negotiation and dynamic policing, and advanced network and service management.
1.3
Internet Measurements
administrators, researchers, and service providers. The people who actually run the network initially needed to be able to detect traffic anomalies and infrastructure failures hence some inspired diagnostic tools started being developed as the Internet was growing larger. Ping
and traceroute are some well-known examples that are still being widely used to reveal some link-level detail for ad hoc network diagnostic tasks. Researchers started investigating the behaviour and usage patterns of computer networks in order to create realistic models of the traffic sources, and these efforts have lead to the emergence of new research themes dealing with measurement methodologies, inferences, and statistical analyses of the Internet traffic characteristics. More recently, service providers started considering the provision of services beyond best-effort, and are therefore interested in characterising traffic demands to match available resources, in order to provide certain service levels and increase revenue by implementing non-flat-rate usage pricing.
Within the research community, Vern Paxson’s seminal work [Paxs97b] in the mid 1990’s played a crucial role, not only to the empirical characterisation of end-to-end Internet routing behaviour and packet dynamics, but also to the actual birth and subsequent tremendous popularity of inter-network measurements as distinct research area, involving an ever increasing amount of manpower. Paxson recruited a large number of Internet sites and used TCP and route information to assess the traffic dynamics of the dominant transport protocol as well as the routing behaviour across a representative number of geographically-spread end-to-end Internet paths. Using a significant number of traces, he then empirically examined among others routing pathologies, packet delay and loss, as well as bandwidth bottlenecks across the Internet.
wide-area traffic [Cace89]. A later more comprehensive yet similar study by Cáceres et al. characterised bulk transfer and interactive wide-area network traffic and reported the dominance of the former [CaDJ91]. Jon Crowcroft and Ian Wakeman analysed the characteristics of operational traffic captured during a 5-hour interval on the UK-US academic network 384 Kb/s link, and calculated among others statistics of packet size and connection duration distributions, inter-packet latencies, as well as sizes of packet bursts [CrWa91]. At a later seminal study, Leland at al. used long traces of captured ethernet LAN traffic to characterise its nature as statistically self-similar, and hence very different from conventional telephone traffic and from commonly considered formal models for packet traffic, such as Poisson-related, packet train, and fluid flow models [LeTW93].
In contrast to measurement in other research disciplines, Internet measurements are technically easy to do. However, the uniqueness and heterogeneity of the Internet constitute every measurement also unique, non-reproducible and non-typical [SaDD05]. Hence, a major concern is how to generalise unique measurements to the overall network, and how to deploy measurement mechanisms to provide more meaningful and valuable insight to the different properties of traffic across the Internet. This has led to an explosion on Internet measurement research. Initial simple diagnostic tools inspired researchers to derive active methodologies to probe the network in order to elicit some special response that can somehow characterise its behaviour. Traffic monitoring has been extensively used to provide insight to the operational usage patterns of network administrative domains, and numerous passive measurement techniques and infrastructures have been developed to capture microscopic and macroscopic level traffic properties. Control and management plane measurements – which are usually considered as part of passive techniques – are also used for gathering routing (e.g. OSPF, IS-IS, BGP) and network element (SNMP) information, and to produce more aggregate topology-centric views of the traffic.
A common theme for the majority of Internet measurement and subsequent analysis work is that the measurement processes and/or architectures are mostly decoupled from the Internet’s main forwarding mechanism3, and are mostly deployed ad hoc over well-known and mainly statically provisioned network topologies. However, the heterogeneity of inter-connected systems and networks is ever increasing, and advances in mobile and wireless communications facilitate the emergence of networks where end-system processing resources
3 Active measurement techniques probe the network’s forwarding mechanism, but concentrate on
are limited, charging is performed based on fine-grained bandwidth consumption, infrastructural access cannot be assumed and the overall environment is highly dynamic. A major challenge for Internet measurement research is therefore to provide the necessary generic mechanisms that can ubiquitously and pervasively provide insight to the actual performance experienced by all-IP next generation networks traffic.
1.4
Thesis outline
This thesis researches the challenges involved in assessing the network response elicited by the diverse set of traffic flows, with the aim of providing an adequate mechanism to directly measure the actual traffic-perceived performance while this is routed over the next generation Internet. In particular, it describes the rationale, design and definition of a novel measurement technique, as well as the implementation of a prototype measurement system and its validation through experimentation over operational network topologies.
The remainder of this thesis is decomposed into five chapters. Chapter 2 provides a thorough survey of the major deployments and advances in network traffic measurement techniques and methodologies. Major measurement infrastructures and tools, widely-implemented performance metrics, as well as standardised measurement cost-reduction techniques are documented.
Chapter 3 introduces in-line service measurements, a novel measurement technique targeted at assessing the operational traffic’s perceived performance between multiple (mainly two) points in the network. The design of the technique is presented, its particular applicability to IPv6 inter-networks is highlighted and subsequently, the definition of two representative measurement options as IPv6 destination header options to implement two-point time-based and packet loss-related metrics is presented.
Chapter 4 provides a detailed description of the prototype implementation of a highly modular, two-point instantiation of the in-line IPv6-based measurement technique. The feasibility of an equivalent production system been realised using hardware, software and hybrid components is discussed, and the particular suitability of the measurement modules being the main processing entities within a broader, distribute measurement framework is also highlighted. The chapter focuses on the implementation details of the software-based prototype that demonstrate the potential of in-line measurement instantiations on commodity hardware and software end-system configurations.
experimentally quantified, and a quantitative and qualitative comparison of the in-line measurement prototype implementation with complementary measurement systems is presented.
Chapter 2
2
Internet Measurements:
Techniques, Metrics,
Infrastructures, and
Network Operations
2.1
Overview
This chapter provides a thorough discussion on the major representative researches and deployments in the area of network and inter-network traffic measurements. A detailed taxonomy is presented that categorises measurement systems, based on the techniques and infrastructures they employ to measure performance properties across network links and paths. Traffic measurements fall into two broad categories, namely active and passive
measurements, and hence the two major sub-sections of this chapter focus on each category individually.
Passive measurements depend entirely on the presence of appropriate traffic on the network under study, and have the advantage that they can be conducted without affecting the traffic carried by the network during the period of measurement. They are usually deployed within single administrative domains, and require hardware and/or software support, sometimes within the network nodes themselves. Passive measurement systems are mostly concerned with providing feedback for network operations and engineering tasks, such as traffic demands derivation, network provisioning, and workload analysis. They can be decomposed down to different categories based on the granularity on which they operate with respect to the collection and subsequent presentation of measurement information, from aggregate link monitoring, to individual flow and packet monitoring.
Throughout the chapter, the strong coupling of active measurement techniques with particular infrastructures and tools, as well as with the performance metrics each technique can measure is identified. A brief discussion of research efforts that use active probing to derive not only traffic performance, but also path capacity estimates is also included.
Additionally, the evolution of passive measurement techniques from the device-centric perspective of traditional network management, to the network-and-traffic-oriented nature of packet monitoring is revealed; the network operations tasks which can use inputs from passive measurement systems, and some methods used to minimise the overhead of packet monitoring are also briefly discussed.
2.2
Active Measurements and Performance Metrics
Many measurement methodologies are active, meaning that part of the measurement process is the generation of additional network traffic, whose performance properties will be measured and assessed [PaAM98].
Active measurements are deployed between two points in the network, and the injected traffic attempts to bring to the surface the unidirectional or bidirectional performance properties of end-to-end Internet paths. These techniques are usually implemented within an active measurement infrastructure framework, and offer the flexibility of running at commodity hardware/software end-hosts at different Internet sites.
Specially designed measurement processes insert some stimulus into the network to either elicit a special response from the network components (e.g. traceroute), or to discover the level of performance delivered by the network to this type of traffic (e.g. treno4) [PaAM98]; it is the network response to that stimulus that is then being measured [BaCr99].
4 Traceroute RENO (TRENO) is a network testing tool that simulates the full TCP algorithm and
Many such processes exploit the ICMP ECHO responder (implemented in most modern IP stacks’ ICMP server) [Post81] to deduce round-trip performance indicators experienced by ICMP traffic. Others operate under a pure client-server model where user-space applications create and exchange datagrams over the common transport layers (TCP or UDP), and then compute unidirectional performance properties. Computation can be based on measurement data carried within the injected datagrams, in special header fields on top of the transport layer or within optional fields of the transport protocol headers (e.g. timestamps carried in TCP Options field) [Pure]. However, measurement data might not be at all present within the datagrams; applications can simply operate as traffic generators which then compute performance by other (application-level) means, e.g. by recording packet departure and/or arrival times, or by examining TCP sequence and acknowledgement numbers).
The relatively minimal implementation requirements of these measurement processes as well as the increasing popularity of network measurements research since Paxson’s seminal work in mid 90s, has led to an explosion of standalone network measurement and monitoring tools and benchmarks [Caid, NLAN, SLAC], together with traffic generators [HGS, FOKU] most of which also implement some measurement functionality.
Deployment of complete measurement infrastructures that measure performance over a mesh of Internet paths however, has proven a harder and more challenging task, both politically and administratively. Being only as good as the number of sites/systems that implement them, active measurement infrastructures try to exploit the
Ν
2 effect, where adding one more measurement site to existingΝ
sites, adds 2Ν more Internet paths that can be measured end-to-end. Hence the total number of measurable paths isΟ
(
N
2)
. With enough sites and repeated measurements, they can capture a reasonably representative cross-section of Internet behaviour [Paxs98b].The following sub-sections concentrate on presenting the major, representative active measurement infrastructures, as well as on categorising them based on their main architectural and implementation differences.
In this section, the direct relationship between active measurements and performance metrics
is emphasised, and hence, sub-sections are included which briefly describe the notion of performance metrics and efforts towards their standardisation by the Internet community.
2.2.1
Different Levels of Performance Metrics
A metric is a carefully specified quantity related to the performance and reliability of the operational Internet that one would like to know the value of [PaAM98]. At a very raw level, metrics can be defined in terms of packet counters, byte counters, and timing information related to the departure/arrival of datagrams from/at specific nodes in the network. In contrast, some metrics can be derived, meaning that they can only be defined in terms of other metrics [PaAM98].
Simple metrics can include the propagation time of a link, as being the time difference in seconds between when host X on link L begins sending 1 bit to host Y and when host Y has received the bit; transmission time of a link as the time required to transmit β bits (instead of 1 bit) from X to Y on the link L; bandwidth of a network link as the link’s data-carrying capacity, measured in bits per second, where “data” does not include those bits needed solely for link-layer headers [Paxs96].
Derived metrics can include the maximum jitter5 along an Internet path, as being the maximum amount of inter-packet delay variation, measured in seconds, that packets sent from A to B might experience in their end-to-end transmission time; the availability of an Internet path as the unconditional probability that for any S second interval host A will have epoch connectivity to host B.
Metrics can also be decomposed down to analytically and empirically-specified. Analytical metrics are those that view a component in terms of its abstract, mathematical properties, e.g. the transmission time of a link. Empirical metrics are defined directly in terms of a measurement methodology, e.g. the throughput achieved across an IP cloud, which is mostly influenced by experimental parameters than from an analytical definition [Paxs96]. Analytical metrics are easier to define and might offer the possibility of developing a framework for understanding different aspects of network behaviour. However, proving that an analytical metric is well-defined to capture the notion of interest, and sometimes measuring the analytical metric can be inherently and significantly difficult. On the other hand, empirical metrics can prove difficult to compose or to generalise how they will be affected by changes in network parameters.
5 The term “jitter” has commonly two meanings: It can be used to describe the variation of signal with
The definition of performance metrics is a recent and very active research area, hence providing an exhaustive list or taxonomy of metrics here would not be feasible. At the same time, as this will be raised in later sections, different measurement infrastructures and tools define their own higher-level performance metrics, which they then implement to draw network service quality conclusions. However, there are recent efforts in standardising a relatively small set of performance metrics within the Internet community, envisioning future unambiguous implementations in network products and measurement architectures. This work is discussed in the next section.
2.2.2
The IETF IP Performance Metrics (IPPM) Working Group
The Internet Protocol Performance Metrics (IPPM) Working Group (WG) was established in the late 1990s under the Transport Area of the Internet Engineering Task Force (IETF), targeting at the development of a set of standard metrics that can be applied to the quality, performance, and reliability of Internet data delivery services. These metrics should be designed so that they can be performed by network operators, end-users, or independent testing groups, and they should provide unbiased quantitative measures of performance, rather than a value of judgement [IPPM].
The Working Group focuses on documenting the procedures for measuring the individual metrics and how these metrics characterise features that are important to different service classes, such as bulk transport, periodic streams, or multimedia streams.
IPPM charter identifies two long-term, overall deliverables to be proposed as IETF standards: a protocol to enable communication among test equipment that implements one-way metrics, and a Management Information Base (MIB) to retrieve results of IPPM metrics to facilitate the communication of metrics to existing network management systems [IPPM].
The protocol will intend to provide a base level of functionality allowing interoperation between different manufacturers’ equipment that implement the metrics according to the standard.
The main properties of individual IPPM performance and reliability metrics are that the metrics should be well-defined and concrete, and they should exhibit no bias for IP clouds implemented with identical technology. Also, the methodology used to implement a metric should have the property of being repeatable, so that if used multiple times under identical conditions it should result in consistent measurements [PaAM98].
The framework document for IP performance metrics defines three distinct notions of metrics,
together (e.g. an hour’s one-way delay measurements made at Poisson intervals with one second mean spacing). Statistical metrics are derived from a given sample metric by computing some statistic of the values defined by the singleton metric on the sample (e.g. the
mean of an hour’s one-way delay measurements made at Poisson intervals with one second mean spacing). By applying these three notions of metrics, IPPM provides for an extensible and reusable framework where meaningful samples and statistics can be defined for various different singleton metrics, mainly in order to identify variations and consistencies for each measured metric.
Other important generic notions defined in the IPPM framework -and hence used in individual metrics’ definitions- include the notions of “wire-time” and of “packets of type P”.
• The “wire arrival time” of a packet P at host H on link L is the first time T at which any bit of P has appeared at H’s observational position on L.
• The “wire exit time” of a packet P at host H on link L is the first time T at which all the bits of P have appeared at H’s observational position on L.
Due to the fundamental property of many Internet metrics taking values depending on the type of IP packets used to make the measurement (e.g. IP-connectivity metric), the generic notion of “packet of type P” is defined, where in some contexts P will be explicitly defined, partially defined, or left generic.
Additionally, the framework provides advice on measurement methodologies, on measurement uncertainties and errors, on composition of metrics, on clock and time resolution issues, on methods for collecting samples, on measurement calibration and self-consistency tests, and on the definition of statistical distributions for measurements.
At the time of writing, the IPPM initiative has defined four distinct metrics as well as a bundle of metrics for measuring connectivity that have advanced along the standards track within the IETF.
• One-way Delay Metric for IPPM
For a real number dT, “the Type-P-One-way-Delay from a source to a destination node at T is dT” means that the source sent the first bit of a Type-P packet to the destination at wire-time T and that destination received the last bit of that packet at wire-time T+dT.
“The Type-P-One-way-Delay from a source to a destination node at T is undefined (informally, infinite)” means that the source sent the first bit of a Type-P packet to the destination at wire-time T and that destination did not receive that packet [ALKZ99a].
protocols to sustain high bandwidths; at the same time, the minimum value of this metric provides an indication of delay due only to propagation and transmission delay.
One-way delay can prove valuable over round-trip delay, especially in cases where the forward and reverse paths between a source and a destination are different (asymmetric paths) or when, even in the case of symmetric paths, there are radical performance differences between the forward and reverse directions due to asymmetric routing. In QoS-enabled networks, provisioning can be radically different between the two directions of a path, and hence measuring them independently allows for verification of QoS guarantees. Also, the performance of applications may depend mostly on the unidirectional performance of a path. One-way delay measurements heavily rely on accurate timestamps between the two clocks at the source and the destination nodes of the measured path. Hence, the accuracy, the resolution, and the skew of each of these clocks play a crucial role on the accuracy of the one-way delay measurement. Accuracy of a clock measures the extent to which a given clock agrees with Coordinated Universal Time (UTC). Resolution measures the precision of a given clock, in terms of the frequency of “clock ticks”. Skew measures the change of accuracy, or of synchronization, with time [ALKZ99a].
From the singleton Delay metric, the sample metric Type-P-One-way-Delay-Poisson-Stream and also statistic definitions have been defined. The sample metric obtains values of Type-P-One-way-Delay between two points in time, at time instances that follow a pseudo-random Poisson process with average arrival rate lambda. Statistics definitions include the Xth percentile, median, minimum, and inverse percentile of the delay values in the sample metric.
• One-way Packet Loss Metric for IPPM
“The Type-P-One-way-Packet-Loss from a source to a destination node at time T is 0” means that the source sent the first bit of a Type-P packet to destination at wire-time T and that destination received that packet.
“The Type-P-One-way-Packet-Loss from a source to a destination node at time T is 1” means that the source sent the first bit of a Type-P packet to destination at wire-time T and that destination did not receive that packet [ALKZ99b].
The definition of the one-way packet loss metric is motivated by the sensitivity of certain (real-time) applications to excessive loss phenomena, and of transport-layer protocols in sustaining high bandwidths. Particular importance of one-way packet loss over round-trip loss is raised due to Internet path asymmetry, queuing asymmetry, and QoS provisioning phenomena, as well as due to applications’ performance depending mainly on unidirectional path characteristics.
The sample Type-P-One-way-Packet-Loss-Poisson-Stream metric is derived from the
singleton P-One-way-Packet-Loss metric, following a similar procedure with the Type-P-One-way-Delay-Poisson-Stream sample metric. Statistic definitions for this sample metric include the average of all loss values in the stream.
Specific metrics to capture packet loss patterns, such as the frequency and length of loss phenomena once they start, as well as the spacing between loss periods, have been defined separately [KoRa02].
• Round-trip Delay Metric for IPPM
For a real number dT, “the Type-P-Round-trip-Delay from a source to a destination node at T is dT” means that the source sent the first bit of a Type-P packet to the destination at wire-time T, that destination received that packet, then immediately sent a Type-P packet back to the source, and that source received the last bit of that packet at wire-time T+dT.
“The Type-P-Round-trip-Delay from a source to a destination node at T is undefined (informally, infinite)” means that the source sent the first bit of a Type-P packet to the destination at wire-time T and that (either the destination did not receive the packet, the destination did not send a Type-P packet in response, or) the source did not receive that response packet [ALKZ99c].
at which a given delay was measured. Accuracy, per se, has no importance to the accuracy of the measurement of delay [ALKZ99c].
Similar to the One-way-Delay-Poisson-Stream sample metric, the sample Type-P-Round-trip-Delay-Poisson-Stream is derived from the singleton Type-P-Round-trip-Delay metric. Statistics definitions for the sample Type-P-Round-trip-Delay-Poisson-Stream metric include the Xth percentile, median, minimum, and inverse percentile of the delay values in the sample metric.
• IP Packet Delay Variation Metric for IPPM
Type-P-One-way-ipdv is defined for two packets from a source to a destination node selected by the selection function F, as the difference between the value of the type-P-One-way-delay from the source to the destination at time T2 and the value of the type-P-One-way-delay from the source to the destination at time T1. T1 is the wire-time at which the source sent the first bit of the first packet, and T2 is the wire-time at which the source sent the first bit of the second packet. This metric is derived from the One-Way-Delay metric.
Therefore, for a real number ddT “The type-P-one-way-ipdv from a source to a destination node at T1, T2 is ddT” means that the source sent two packets, the first at wire-time T1 (first bit), and the second at wire-time T2 (first bit), and the packets were received by the destination at wire-time dT1+T1 (last bit of the first packet), and at wire-time dT2+T2 (last bit of the second packet), and that dT2-dT1=ddT [DeCh02].
“The type-P-one-way-ipdv from a source to a destination node at T1, T2 is undefined” means that the source sent the first bit of a packet at T1 and the first bit of a second packet at T2 and that the destination did not receive one or both packets [DeCh02].
This singleton metric depends on a stream of at least two one-way delay measurements, and its value is either a real (positive, zero, or negative) or an undefined number of seconds. The two packets for which the metric is defined can be selected based on some selection function, such as ‘consecutive Type-P packets within the specified interval’, ‘type-P packets with specified indices within the specified interval’, ‘type-P packets with the minimum and maximum one-way-delays within the specified interval’. Being a differential measurement, this metric is less sensitive to clock synchronization problem; if an error affecting the first measurement of One-Way-Delay were the same as the one affecting the second measurement, they will cancel each other when calculating delay variation.
variation between packets experiencing the maximum and minimum one-way delay in different sub-intervals within the measurement interval.
• IPPM Metrics for Measuring Connectivity
Connectivity metrics aim at determining whether pairs of hosts can reach each other and they can form the basis of a measurement suite. Two analytic metrics are introduced to define one-way and two-one-way connectivity at one moment in time. Using these metrics, further analytic metrics are defined for connectivity over an interval of time [MaPa99]. The instantaneous unidirectional connectivity metric serves as the main building block to define connectivity in the reverse direction, as well as connectivity at specific time intervals.
A source node has Type-P-Instantaneous-Unidirectional-Connectivity to a destination node at time T, if a type-P packet transmitted from the source to the destination at time T will arrive at the destination.
Two Internet addresses A1 and A2 have Type-P-Instantaneous-Bidirectional-Connectivity at time T if address A1 has Type-P-Instantaneous-Unidirectional-Connectivity to address A2 and address A2 has Type-P-Instantaneous-Unidirectional-Connectivity to address A1.
Definitions of the additional derived metrics for unidirectional and bidirectional connectivity at specific time intervals are also included in [MaPa99].
A framework for IP Bulk Transport Capacity (BTC) as a measure of a network’s ability to transfer significant quantities of data with a single congestion-aware transport connection has also been defined by the IPPM working group. The specific definition of bulk transfer capacity is:
_
_
data sent
BTC
elapsed time
=
(1)The requirements for a one-way active measurement protocol as well as the use of periodic sampling streams for network performance measurements have progressed along the IETF standards track. The measurement protocol requirements include suggestions for functional and post-processing issues, distribution of results, separation between the session setup and the actual measurement test process, and support for measurements with different packet types [ShTe04]. Periodic sampling has been suggested as an alternative to Poisson sampling to enable simulation of Constant-Bit-Rate (CBR) traffic, and to be applicable to both active and passive measurement. Sample metrics for periodic streams include the Type-P-One-way-Delay-Periodic-Stream, which intends to quantify the delays and delay variation as experienced by multimedia streams of an application [RaGM02].
The One-Way Active Measurement Protocol (OWAMP) has already been submitted as an IETF draft, and will shortly be considered as a Proposed Standard. This will be a major deliverable for the IPPM working group, whose standardisation together with the different metrics definitions can be the corner-stone for wide-spread deployment of one-way and round-trip performance measurement within network equipment, and across the Internet, under the umbrella of compatible measurement infrastructures. OWAMP test traffic will consist of a stream of UDP packets from and to negotiated port numbers, with potentially nothing static in the packets (negotiated size too). This property should make test traffic hard to detect and distinguish from operational network traffic, and hence, the possibility of test traffic being treated differently by network nodes will be kept at a minimum. Two inter-related protocols have been proposed for control and test traffic. Control will be used to initiate, start and stop the test sessions and fetch their results, while the test protocol is used to exchange test packets between two measurement nodes [ShTK05].
It remains to be seen how these efforts towards unambiguous and standardised definitions of performance metrics and protocol suites will facilitate the wide-spread deployment of measurement activities within the Internet, essentially creating a measurement plane, alongside its forwarding and data delivery operations. Coherent measurement support from different manufacturer equipment, as well as support for inter-domain measurement operations between Internet Service Providers has a crucial role to play on the successful evolution of these developments.
2.2.3
ICMP-based Active Measurements
is an integral part of the Internet Protocol, and its implementation is compulsory in every IP module [Post81].
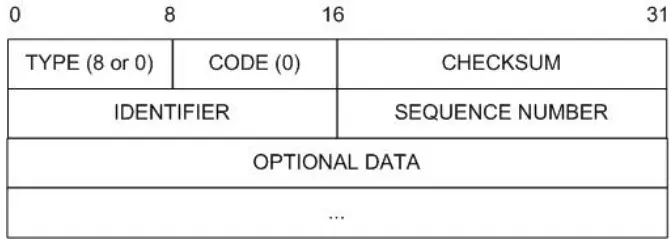
[image:35.595.147.482.318.442.2]Even though ICMP messages are encapsulated and sent using IP, ICMP is not considered a higher layer protocol. The only reason for using IP to deliver ICMP messages is the need for messages to be able to be travel across several physical networks to reach their final destination, and therefore they cannot be delivered by the physical transport alone [Come00]. Among the numerous types of ICMP messages that have been standardised and are currently used across the Internet, the echo request and echo reply messages (Figure 2-1) are deployed to test destination reachability and status. A host or router sends an ICMP echo request message to a specified destination; any machine that receives an echo request formulates an echo reply and returns it to the original sender. The request message contains an optional data area, and the reply contains an exact copy of this data [Come00].
Figure 2-1: ICMP Echo Request or Reply Message Format
One of the most frequently-used debugging tools that invokes a series of timed ICMP echo request and reply packets is PING6, first written for UNIX® by Mike Muuss, in December 1983. Sophisticated versions of ping capture responses and provide statistics about datagram loss, based on the series of ICMP echo messages they generate, and allow users to specify the length of the data being sent and the time interval between requests. By timing the departure of the ICMP echo request packets and the arrival of the corresponding ICMP echo replies,
ping can provide information about the Round-Trip Time (RTT) of the path between the sender and the receiver. The simplicity of ping and its widespread deployment to virtually every Internet host has encouraged researchers to use it not only as a standalone tool for on-demand destination reachability tests, but also as the basis to deploy measurement infrastructures with minimal processing and implementation requirements, to measure certain
6 Mike Muuss named PING after the sound that a sonar makes, inspired by the whole principle of
performance characteristics across the Internet. Some of these infrastructures now include a very large number of Internet sites and hence claim that they can capture representative indications of Internet end-to-end path performance. In the remainder of this section some major deployments in this area are described.
2.2.3.1
The Ping End-to-end Reporting (PingER) Project
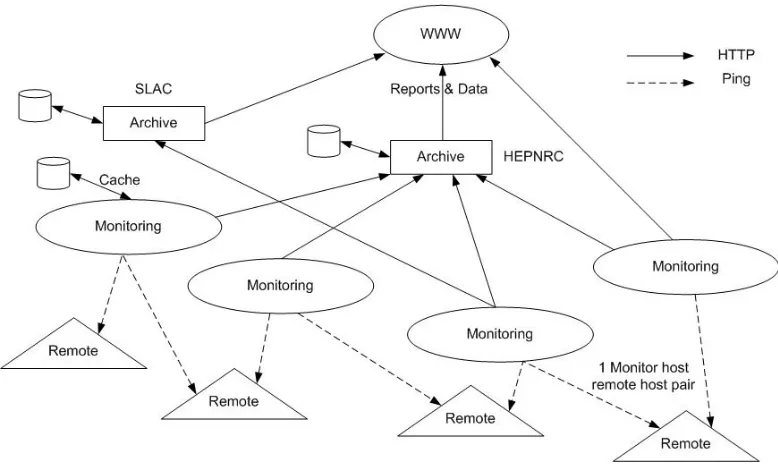
Ping-End-to-end Reporting (PingER) is the name given to the Internet End-to-end Performance Measurement (IEPM) project to monitor end-to-end performance of Internet links. The project was initiated at Stanford Liner Accelerator Centre (SLAC) and mainly included sites involved in the High Energy Nuclear and Particle Physics (HENP) community. Major motivation behind the project was to understand the present performance and to allocate resources to optimise performance between laboratories, universities and institutes collaborating in present and future experiments.
In December 1999 the project consisted of 20 PingER monitoring sites, mainly in the U.S (8), Europe (7) and Asia (3). Recently, it has been reported that it now includes 35 monitoring sites in 12 countries that are monitoring hosts across 106 countries in 15 regions [CoLW03, PiER]. As its name indicates, PingER uses the ping utility to get RTT and loss statistical summaries across the monitoring sites. It sends 11 pings with a 100-byte payload at 1 second intervals, followed by 10 pings with a 1000-byte payload, also at 1 second intervals.
The first ping is only used to prime name server caches and is then discarded from the measurement, since it is assumed to be unrepresentatively slow7. The ping default timeout of 20 seconds is used, since studies on poor links with long delays have shown that less than 0.1 % of packets return after 20 seconds and before 100 seconds. Each set of 10 pings is
called a sample, and each monitoring node-remote node combination a pair [MaCo00a]. Figure 2-2 provides a graphical representation of the PingER architecture. Each of the monitoring sites chooses a set of remote hosts of interest to them. Additionally, a set of representative hosts, called beacons, have been chosen for the various regions and they are monitored by all monitoring-hosts, providing measures for world-wide performance with respect to the beacons [CoLW03].
7 Studies using UDP echo packets have found that the first packet takes almost 20% longer than
Figure 2-2: Graphical Representation of the PingER Architecture
PingER’s architecture defines 3 types of hosts, the monitoring-hosts, the remote-hosts, and the archive/analysis hosts. By default, each monitoring-host sends the 100-byte and the 1000-byte
sample to each of the remote-hosts being monitored, every 30 minutes. However, the 1000-byte sample is usually not sent to remote-hosts with poor connectivity, in order to keep the impact on their networks minimal. Round-Trip Times (RTT), losses, out of order and duplicate packets from the pings are recorded locally on the monitoring-hosts, and are then
gathered by the archiving-hosts on roughly a daily basis. Archive-hosts provide tools for interactive analysis and web presentation of the data, and also the capability to select data by various different aggregations and time-spans [CoLW03].
One of the most interesting features of the PingER project is that it defines five metrics for data analysis, designed to look for the effect of queuing to estimate network performance. Two of these metrics have been previously defined and widely used in the literature, however the rest three are higher-level, derived metrics defined under the umbrella of the PingER project, to characterise end-to-end behaviour. Table 1 summarises these five performance metrics and their definition.
Table 1: The five metrics defined for the PingER analysis
Packet Loss A packet is deemed lost if no ICMP echo reply is received at the originating node within 20 seconds from the time it sent the corresponding ICMP echo request packet.
[image:37.595.121.510.69.301.2]