Using a Grid-Enabled Wireless Sensor Network for Flood
Management
Phil Greenwood, Danny Hughes,
Barry Porter, Paul Grace, Geoff Coulson,
Gordon Blair, Francois Taiani
Computing Department, InfoLab21,
South Drive, Lancaster University
Lancaster, LA1 4WA, UK.
[email protected]
Florian Pappenberger,
Paul Smith,
Keith Beven
Environmental Science Department,
Lancaster University,
Lancaster, LA1 4YQ.
[email protected]
ABSTRACT
Flooding is becoming an increasing problem. As a result there is a need to deploy more sophisticated sensor net-works to detect and react to flooding. This paper outlines a demonstration that illustrates our proposed solution to this problem involving embedded wireless hardware, compo-nent based middleware and overlay networks.
Keywords
Grid, overlay network s, components, sensor networks
INTRODUCTION
Flooding is an increasingly serious problem, especially as population pressures lead to increased building on flood plains. Currently, hydrologists deploy sensors at sites sus-ceptible to flooding to record data such as water depth and rate-of-flow. The sensors are deployed statically and sensor data is fed off-site (e.g. using GSM) to grid-based computa-tional models which predict both short and long term flood-ing trends [1,2]. We see considerable room for improve-ment in such scenarios. In particular, we propose employing a far more dynamic and autonomous sensor network organi-sation, and propose (selectively) shifting the execution of the prediction models to the sensor network itself which acts as a mini-grid. This more sophisticated approach prom-ises several benefits. First, the approach can reduce the time hydrologists need to spend on site by increasing the sur-vivaibility of the sensor networks in case of node of com-munication failures. Second, locally-computed predictions can be used to dynamically reconfigure the sensor network to optimise it for current environmental conditions (e.g., the network can employ a low power, low throughput organisa-tion in quiescent condiorganisa-tions; and switch to a high power, resilient, high throughput organisation when flooding is imminent). And, third, it can be used to directly inform lo-cal stakeholders of imminent flooding.
To achieve this vision we have developed a sensor network framework based on an appropriate combination of soft-ware and hardsoft-ware. Our softsoft-ware is based on our previously developed component-based run-time reconfigurable Grid-Kit middleware [4]. And our hardware platform is based on the embedded Gumstix platform [3] which offers a good
trade off between computational resources (needed to run the prediction models) and power consumption. We call the combined hardware and software platform ‘GridStix’.
GRIDKIT
[image:1.612.343.532.475.619.2]The Lancaster developed GridKit provides the key func-tionality to develop Grid-applications: service-binding, re-source discovery, rere-source management and security. It is based on our language-independent OpenCOM component model [5], with each area of Grid functionality being im-plemented as an independent component framework. As GridKit is component based, it is inherently configurable and extensible. A wide range of target deployments can be built by selectively combining component frameworks, ei-ther rich and complex, or basic and simple, as appropriate. In particular, minimal deployments can be developed that contain just the bare functionality necessary to perform a particular task. By removing unnecessary components in this way, and thus reducing the associated computation and storage requirements, it is possible to deploy GridKit on scarcely-resourced embedded platforms.
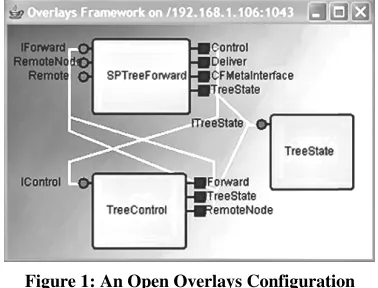
Figure 1: An Open Overlays Configuration
Of particular relevance to the proposed system is the
lay component framework. The overlay component frame-work is GridKit’s core netframe-working abstraction and provides a base for building application level networks (or overlays), which are typically used to implement services not provided by the underlying network, and to provide functionality that is outside of the scope of the underlying network. Classic examples include: resource discovery, content distribution event notification services, and spanning trees. Figure 1 illustrates a shortest path spanning tree implementation, which may be used to transmit sensor data offsite.
HARDWARE
As mentioned, the hardware used to host the GridKit plat-form is based on the Gumstix embedded computing platform—so named as each unit is roughly the same size as a pack of chewing gum. Gumstix are significantly more powerful than highly-embedded devices such as the Berke-ley Motes [6]. Each unit features an Intel XScale CPU run-ning at up to 400MHz, and comes equipped with 64MB of RAM, 16MB of flash memory and Bluetooth radio. 802.11b connectivity can also be added via a Compact Flash expansion card.
As might be expected, this computational power and flexi-bility comes at the expense of power consumption. During typical operation a Gumstix consumes up to 1 watt of power with a maximum theoretical power draw of up to 3 watts. This is not a significant problem in our target do-main, however, as it is quite feasible for these power re-quirements to be met using a mid-sized solar panel and high-capacity battery.
SYSTEM OVERVIEW
As described previously, GridStix nodes are capable of maintaining both Bluetooth and 802.11b network infra-structures. This is desirable as the two networks have quite different properties and one can be selected over the other to reflect changing conditions or failures in the network. For example, a set of nodes in close proximity may be dis-seminating data between themselves in a multi-hop fashion via a low power consumption Bluetooth network. However, a critically placed node in this network could fail, resulting in network partition. To allow the sensor network to continue operating smoothly, our software infrastructure allows a sub-set of the nodes should then switch to 802.11b (due to the improved range) to repair the partition. Addi-tionally, the type of data being disseminated through the sensor network can affect the decision on the network type to use. For example, to detect rate-of-flow in a rising river, we employ an image analysis algorithm to identify and track naturally occurring tracer particles on the water sur-face. Individual nodes are able to detect very coarse-grained changes in surface velocity; however, for more pre-cise measurements to be performed, images need to be dis-tributed to a number of nodes. As a consequence, the Grid-Stix will switch network type from Bluetooth to 802.11b as Bluetooth does not have sufficient bandwidth to distribute the large image data-set in a timely fashion.
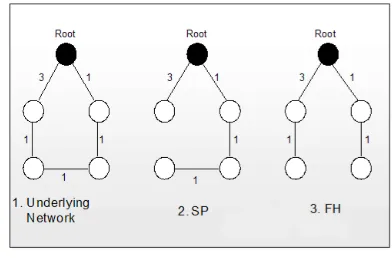
[image:2.612.338.534.259.388.2]Adaptations in the sensor network can also take place at the overlay/spanning tree level, in that different overlays can be substituted at run-time depending on the environmental conditions. The GridStix nodes might initially be structured using a shortest-path tree. As ‘shortest path’ corresponds to the distance between nodes, it correlates with the amount of power necessary to reliably transmit data between nodes, resulting in a power-efficient topology. However, trees of this nature tend to be ‘skinny’ which reduces their resilience to failure. When flooding is predicted it is therefore desirable to increase resilience to failure rather than con-serve power. As a result, a fewest-hop tree can be dynami-cally substituted, thus increasing system resilience. Fewest-hop trees tend to produce ‘fat’ topologies with each node having fewer children. This means fewer nodes are affected when one particular node fails. Example shortest path and fewest hop spanning trees are shown in Figure 2.
Figure 2: SP and FH Spanning Trees
SUMMARY
This paper has given a brief overview of how we have combined embedded hardware and a component-based Grid platform to offer improved support for flood prediction. This combination allows the sensor network to be adapted in rich ways to best suit the current and future environ-mental conditions. This increases the utility, the resilience and the performance of the network.
REFERENCES
1. F. Pappenberger, K. Beven.et al., “Cascading model uncertainty from medium range weather forecasts (10 days) through a rainfall-runoff model to flood inundation predictions within the European Flood Forecasting System (EFFS)”, Hydrology and Earth System Science, 9(4), pp381-393, 2005.
2. F. Pappenberger, P. Matgen and K. Beven, “The influence of rating curve and structural uncertainty on flood inundation predictions.”, Advances in Water Resources. (in press) 2006.
3. Waysmall Computers “Gumstix Embedded Computing Platform Specifications”, website: http://gumstix.com/spexboards.html.
4. G. Coulson, P. Grace, G. Blair et al, "Open Overlay Support for the Divergent Grid", in the proceedings of the UK E-Science All Hands Meeting, Nottingham, UK, September 2005.
5. G. Coulson, G. Blair et al “The Design of a Highly Configurable and Reconfigurable Middleware Platform”,ACM Distributed Comp Journal, Vol. 15, No 2, pp109-126, April 2002.
CONTACT
INFO
First Name
Danny
Last Name
Hughes
Organization
Lancaster University
Street
Address
Computing, InfoLab 21,
South Drive, Lancaster University,
City
Lancaster,
State/Province
Lancashire.
Country
UK
Postal Code
LA1 4WA
Daytime
Telephone
+44 (0) 1524510351
[email protected]
URL
Demonstration Video Supplement:
http://www.comp.lancs.ac.uk/computing/users/hughesdr/DemoVideo_Final.wmv
Project Web Site:
DEMONSTRATION
DESCRIPTION
Title:
GridStix: A Grid-Enabled Wireless Sensor Network for Flood Management
Project Description (100 words max):
The GridStix demo uses a mixture of physical props and on-screen visualizations to
illustrate how a GridStix-based wireless sensor network, deployed to perform flood
monitoring, adapts its behaviour to best suit changing environmental conditions.
Envisioned Interaction:
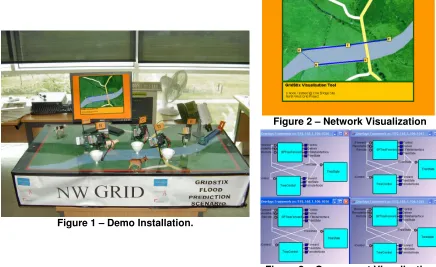
[image:5.612.89.525.346.613.2]Ubicomp attendees will see a table at approximately waist height supporting a display
box that is 75cm long, 60cm wide and 15cm deep. On the front of this installation are the
project logos, while on the top is a printed satellite map showing the deployment site (a
river valley in the north of England). GridStix sensor nodes are ‘deployed’ on this map to
reflect their locations in the real-world deployment. This is shown in Figure 1.
Figure 2 – Network Visualization
Figure 1 – Demo Installation.
Figure 3 – Component Visualization
Following a brief introduction to the relevant hardware and software technologies and
the deployment site, users can interact with the installation by simulating changing flood
conditions as discussed below.
The
first user interaction
is as follows:
In the real-world
, initial detection of high-flow
conditions in the river causes the GridStix nodes to reconfigure from using a low power
Bluetooth network to a high performance 802.11b network suitable for supporting
distributed image-based flow-rate measurement.
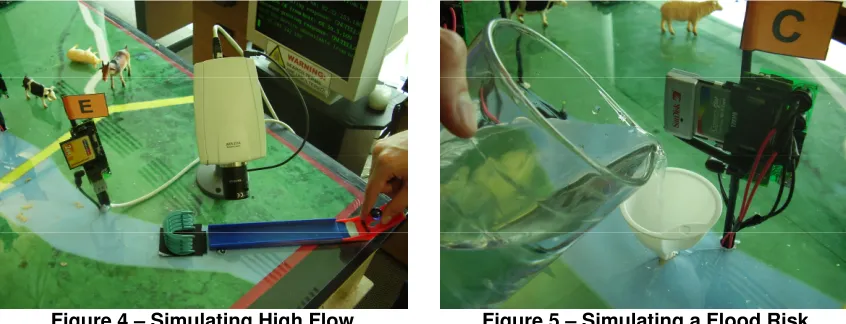
In the demo
, users are invited to
simulate fast flow conditions by rolling marbles down the shute located at the upper-right
hand corner of the installation (see Figure 4). The motion of the marbles is detected by a
network camera and this causes the GridStix to perform the above reconfiguration. The
reconfiguration is reflected in real time by the network visualization (shown in Figure 2).
When the user stops rolling marbles, this simulates river flow returning to normal
conditions and the GridStix switch back to the Bluetooth network, which is again
reflected in the network visualization.
Figure 4 – Simulating High Flow Figure 5 – Simulating a Flood Risk
[image:6.612.94.517.288.450.2]A video supplement showing this demonstration in action is also available at:
http://www.comp.lancs.ac.uk/computing/users/hughesdr/DemoVideo_Final.wmv
TECHNICAL
REQUIREMENTS
S
PACE
The demonstration will require a table with a minimum size of 80cm wide, 60cm deep and preferably not more than 80cm high. An additional few meters around the front and sides of the table would be required to allow people to watch and interact with the demonstration. A second table of similar height will also be required to accommodate the projector.
A
COUSTICAL
The demonstration has no special acoustical requirements and should not generate a great deal of noise aside from the demonstrator guiding attendees through their interactions with the installation.
L
IGHTING
The motion detection used by the camera is vulnerable to reflections from the table’s clear plastic coating in very bright light conditions such as bright sunlight; however, this is not an issue in normal indoor lighting conditions.
T
IME
The demonstration may run throughout the conference, though a demonstrator is required to be present to guide attendees through their interactions with the installation. The demonstration works best with small groups of up to 15 people, from which two people will typically be asked to perform the interactions described above. The complete demonstration sequence, including each of the interactions described above, takes between 5 and 10 minutes excluding questions. Ideally, another 2 – 5 minutes is required between demonstrations to re-initialise the system.
C
OMPUTATIONAL
E
QUIPMENT
The demonstration involves custom embedded hardware and sensors, all of which we will provide. Additionally, two standard PCs are required to drive the visualizations. We can provide both PCs; however, if one is available at the conference site, this would be useful in reducing the amount of hardware we need to transport. We only require that this PC be of a reasonably modern specification and have a java-enabled web browser installed. We can provide our own projector; however, if one could be provided for us, this would again be useful.
N
ETWORKING
The demonstration installation maintains its own ad-hoc Bluetooth and 802.11b wireless network infrastructures and we do not need connection to the Internet.