Activity Monitoring:
Continuous Recognition
and Performance
Evaluation
A dissertation submitted to the
SWISS FEDERAL INSTITUTE OF TECHNOLOGY ZURICH
for the degree of Doctor of Sciences
presented by Jamie A. Ward
BEng CS&E (hons.) Edinburgh born 24th March 1979 citizen of United Kingdom
accepted on the recommendation of Prof. Dr. Gerhard Tr¨oster, examiner
Prof. Dr. Hans W. Gellersen and Prof. Dr. Paul Lukowicz, co-examiner
First edition 2006
Published by the Swiss Federal Institue of Technology (ETH), Z¨urich, Switzerland ( Diss. No. 16520)
ISBN 3-909386-63-6 Printed by Lulu.com
offered by my adviser Prof. Gerhard Tr¨oster and the ETH Wearable Comput-ing Group which he heads. I thank him for the opportunity he has given me to work at ETH in such an interesting research field. I would also like to offer warm thanks to Paul Lukowicz. His presence in and around the Lab through the years has been an invaluable source of both support and inspiration.
I wish to thank all those other colleagues at ETH who, either through direct assistance or in discussion, have helped with this work in some way. Oliver Amft, Nagendra Bhargava, Thomas Stiefmeier, Holger Junker, Mathias St¨ager, Urs Anliker, T¨unde Kirstein, Patrick de la Hamette, Stijn Ossevoort and Fabrizio Macaluso all deserve credit. As do my test subjects Thomas von B¨uren, Roberto Barbieri, David Bannach and Veronica Housen (not forgetting of course - though I wasn’t aware of him at the time - Veronica’s little boy Teo).
Special thanks go to the most important person at ETH: Ruth Z¨ahringer, our institute secretary. On that note, a special thanks to Mrs N. Banergee of Partho Stores, without whose daily portions of quality Indian food I would surely have starved.
Outside ETH, I thank Thad Starner (whose encouragement over the years has been most supportive) and Amin Atrash of Georgia Tech., and Kai Kunze and Georg Ogris of UMIT, Austria.
Most importantly, I thank my family - my mum and dad, gran and pappa - for all the love and support they have given me over the years. Marina, too, deserves a thankyou for putting up with me over the last few months of thesis write-up (and Michaela, my flatmate, for the four chaotic years of ‘work-in-progress’).
I dedicate this work to the memory of my late grandfather Thomas Ward (senior). It was under his guidance, almost twenty years ago, that I first picked up a soldering iron and began tinkering with bits of wire and transistors. Some-where along the line that tinkering got me onto computers. Where it’ll get me next I do not know.
Abstract ix
Zusammenfassung x
1. Introduction 1
1.1. The need for activity monitoring . . . 2
1.1.1. A wearable solution . . . 2
1.2. Aims of the thesis . . . 3
1.2.1. Continuous activity recognition . . . 3
1.2.2. Performance evaluation (and optimisation) . . . 4
1.3. Related work . . . 5
1.4. Outline of the thesis . . . 9
2. Choice of test scenario 11 2.1. Problem analysis . . . 12
2.2. Experimental setup . . . 12
2.2.1. Procedure . . . 14
2.2.2. Data collection system . . . 15
2.3. Analysis of the data . . . 17
2.3.1. Acceleration analysis . . . 18
2.3.2. Sound analysis . . . 22
2.4. Conclusion . . . 24
3. Activity recognition using sound and acceleration 25 3.1. Introduction . . . 26
3.2. Recognition method . . . 27
3.2.1. Recognition using sound . . . 27
3.2.2. Recognition using acceleration . . . 29
3.3. Experiment . . . 34
3.3.1. Setting parameters . . . 34
3.3.2. Evaluation method . . . 34
3.4. Isolation results . . . 35
3.5. Conclusion . . . 35
4. Segmentation using two microphones 37 4.1. The segmentation problem . . . 38
4.2. Two microphone sound segmentation . . . 38
4.4. Results . . . 41
4.4.1. Analysis of results . . . 42
4.5. Conclusion . . . 45
5. Continuous recognition using classifier fusion 47 5.1. Introduction . . . 48
5.2. Recognition method . . . 49
5.2.1. Frame-by-frame sound classification using LDA . . . 49
5.2.2. Sound-based segmentation . . . 50
5.2.3. Sound classification . . . 51
5.2.4. Acceleration recognition . . . 52
5.2.5. Comparison of top choices (COMP) . . . 52
5.2.6. Fusion using class rankings . . . 53
5.3. Experimental setup . . . 55
5.3.1. Training and testing . . . 55
5.4. Recognition in isolation . . . 56
5.5. Continuous recognition . . . 58
5.5.1. Segmentation evaluation method . . . 59
5.5.2. Segmentation results . . . 60
5.5.3. Segmentation and classification results . . . 60
5.5.4. Frame-by-frame results . . . 63
5.5.5. Analysis of frame-by-frame results . . . 67
5.5.6. Event results . . . 67
5.5.7. Analysis of event results . . . 68
5.5.8. Combined time and event evaluation . . . 68
5.5.9. Analysis of combined time and event evaluation . . . 70
5.6. Lessons learnt . . . 73
5.6.1. Concluding remarks . . . 74
6. Recognition using wrist-worn sensors 75 6.1. Introduction . . . 76
6.2. Recognition methods . . . 76
6.2.1. Sliding window segmentation . . . 77
6.2.2. Sound recognition using LDA . . . 77
6.2.3. Acceleration recognition . . . 77
6.2.4. Fusion of classifiers: COMP and LR . . . 78
6.3. Experiment . . . 79
6.3.1. Setting parameters . . . 79
6.4. Results . . . 80
6.4.1. Preliminary study (using 40Hz LDA and HMM) . . . . 80
6.4.2. Frame-by-frame results (using 40Hz LDA and HMM) . 80 6.4.3. Selecting a lower frequency LDA . . . 82
6.4.5. Analysis of computation times . . . 85
6.5. Discusion . . . 85
6.5.1. COMP versus. LR . . . 88
6.5.2. Conclusion . . . 89
7. Evaluation and optimization of performance 91 7.1. Introduction . . . 92
7.1.1. Chapter contributions and organisation . . . 92
7.2. Motivation . . . 93
7.2.1. Frame based analysis . . . 93
7.2.2. Event analysis . . . 95
7.3. Problem specification and existing methods . . . 95
7.3.1. Definition of performance evaluation . . . 96
7.3.2. General considerations . . . 97
7.3.3. Requirements for activity recognition . . . 97
7.4. Error characterisation and representation . . . 99
7.4.1. Event analysis . . . 100
7.4.2. Segment analysis . . . 102
7.5. Discussion . . . 107
7.5.1. Application of method to worked example . . . 107
7.5.2. Significance and Limitations . . . 110
7.5.3. Work in related fields . . . 111
7.6. Conclusion . . . 112
8. SET optimization for continuous activity recognition 113 8.1. SET analysis of the wood workshop . . . 114
8.1.1. (Re-)analysis of results . . . 115
8.2. Parameter optimisation with SET . . . 118
8.3. Conclusion . . . 120
9. Conclusion 121 9.1. Continuous activity recognition . . . 122
9.2. Performance evaluation (and optimisation) . . . 125
Glossary 127
Bibliography 131
Abstract
Wearable computers promise the ability to access information and com-puting resources directly from miniature devices embedded in our clothing. The problem lies in how to access the most relevant information without dis-rupting whatever task it is we are doing. Most existing interfaces, such as keyboards and touch pads, require direct interaction. This is both a physical and cognitive distraction. The problem is particularly acute for the mobile maintenance worker who must access information, such as on-line manuals or schematics, quickly and with minimal distraction.
One solution is a wearable computer that monitors the user’s ‘context’ -information such as activity, location and environment. Being ‘context aware’, the wearable would be better placed to offer relevant information to the user as and when it is needed.
In this work we focus on recognising one of the most important parts of context: user activity. The contributions of the thesis are twofold. First, we present a method for recognising hand activities from a sequence using body worn sensors. Second, in evaluating this method, we present a generalised strategy for characterising the performance of activity recognition systems.
We define a set of typical hand and tool activities in a woodwork assem-bly scenario. We evaluate two methods for detecting and recognising these activities using a combination of body-worn microphones and accelerometers. The first method uses two separately placed microphones on the user’s arm to locate the source of an activity. Whenever a sound is made close to the wrist, an interesting activity is assumed and classification is carried out using both acceleration and sound. The second method requires only wrist-worn sensors. It recognises activities by classifying sound and acceleration over a sliding window. The classifications from each of the sensor types are then compared, and a final result is given depending on how well they agree.
In the second part of the thesis we introduce a strategy for evaluating the performance of continuous activity recognition systems. Like any area of sci-entific research, activity recognition requires standard methods and measures of performance. These are the tools with which researchers can compare and evaluate different systems, thus allowing the field to advance. Continuous ac-tivity recognition, however, has a number of performance issues which existing evaluation strategies - borrowed from related fields such as speech recognition - fail to capture. We explore these issues in depth and propose a new strat-egy of performance evaluation based on the complete characterisation of error types common to the activity recognition problem.
Zusammenfassung
’Wearable Systems’ - am K¨orper tragbare Systeme - zeigen einen Weg auf, die N¨utzlichkeit von Computern weit ¨uber die vertraute Rolle als Hilfsmittel in B¨uros hinaus zu erh¨ohen. Gegenw¨artige Technologien wie PDAs (Personal Digital Assistants) erm¨oglichen beispielsweise mobilen Technikern den Zu-gang zu einem grossen Spektrum an Informationen ¨uber ihre zu verrichtende T¨atigkeit. Ein entscheidender Nachteil dieser Technologie ist allerdings, dass keine ad¨aquate Schnittstelle f¨ur die Interaktion zwischen Techniker und PDA existiert, die nicht von der eigentlichen T¨atigkeit ablenkt. Das Gebiet ’Con-text Awareness’ versucht dieses Problem zu l¨osen, indem Computer in die Lage versetzt werden, Informationen ¨uber den Nutzer und dessen Status in eine automatische, proaktive Interaktion zu ¨uberf¨uhren. Ein wichtiges Teilge-biet dieser Bestrebung ist das ’Activity Monitoring’ - die Aktivit¨atserkennung. Im Vergleich zu benachbarten Gebieten, wie der Spracherkennung, in der es neben W¨ortern Unterteilungen wie Silben und Phoneme gibt, existiert auf dem Gebiet der menschlichen Aktivit¨atserkennung keine solche ausgepr¨agte Taxonomie. Dies gilt im Besonderen f¨ur Aktivit¨aten der Hand. Sie sind in der Regel sehr facettenreich bez¨uglich ihrer Ausf¨uhrung, haben eine vari-able Ausf¨uhrungsdauer und sind oft durchsetzt mit anderen irrelevanten Ak-tivit¨aten.
Der Beitrag der vorliegenden Arbeit ist zweigeteilt. Zun¨achst pr¨asentieren wir eine Methode zur Erkennung von kontinuierlichen Sequenzen von Han-daktivit¨aten unter Verwendung von am K¨orper getragenen Sensoren. Weit-erhin beschreiben wir eine generalisierbare Strategie, um die Leistung von Aktivit¨atserkennungssystemen zu charakterisieren.
F¨ur den ersten Teil der Arbeit definieren wir eine Untermenge von typ-ischen Handaktivit¨aten, die sich w¨ahrend der Arbeit in einer Werkstatt bei der Holz- bzw. Metallverarbeitung ergeben. Diese Aktivit¨aten umfassen, wie auch andere Interaktionen mit der Hand, sowohl Bewegungs- als auch Au-diocharakteristika. Daher st¨utzt sich unsere Erkennungsmethode auf Daten, die mit Mikrofonen und Beschleunigungssensoren aufgenommen werden. Wir pr¨asentieren zwei Methoden, um f¨ur uns relevante Aktivit¨aten in einem kon-tinuierlichen Datenstrom zu erkennen. Die erste Methode basiert auf zwei Mikrofonen, die am Oberarm und am Handgelenk des Benutzers bestigt sind, um die akustische Quelle der jeweiligen Aktivit¨at zu lokalisieren. Wenn ak-tivit¨atsbezogene Ger¨ausche in der N¨ahe des Handgelenks erkannt werden, so wird die Aktivit¨atserkennung auf Beschleunigungs- und Audiodaten gestartet. Eine zweite Methode der Aktivit¨atserkennung benutzt eine einfache Fenster-funktion auf den Daten. Die Klassifizierungen beider Sensordom¨anen wird innerhalb eines Fensters verglichen und bei entsprechend wahrscheinlicher
¨
zu niedrigen ¨Ubereinstimmung ergibt sich die Klassifizierung NULL bzw. keine Aktivit¨at wird als erkannt zur¨uckgegeben. Die letztere Methode hat gegen¨uber der ersten den Vorteil, dass sie nur Sensoren am Handgelenk ben¨otigt und damit mehr Komfort w¨ahrend des Tragens f¨ur den Nutzer bietet.
Im zweiten Teil der vorliegenden Arbeit f¨uhren wir eine Strategie zur Be-wertung der Leistung von Aktivit¨atserkennungssystemen ein. Wie ein jedes Gebiet der wissenschaftlichen Forschung, so braucht auch die Aktivit¨ atserken-nung standardisierte Methoden und Masse f¨ur deren Leistungsf¨ahigkeit. Dadurch erst werden Forscher in die Lage versetzt, Systeme zu vergleichen und diese zu optimieren, um die Arbeit auf dem jeweiligen Gebiet insge-samt voranzutreiben. Kontinuierliche Aktivit¨atserkennung allerdings weist einige Defizite diesbez¨uglich auf. Existierende Bewertungsans¨atze - zumeist an solche in benachbarten Gebieten wie der Spracherkennung angelehnt - sind nicht m¨achtig genug. Wir untersuchen die zugrundeliegenden Schwierigkeiten tiefgr¨undig und stellen eine neue Strategie der Leistungsbewertung vor. Diese umfasst eine solide Charakterisierung der Fehlertypen, die bei Ak-tivit¨atserkennungssystemen gel¨aufig sind.
1
Introduction
1.1. The need for activity monitoring
For the office worker, computers have become the primary tool for informa-tion access. The on-site maintenance worker, however, has greater difficulty in accessing this resource. Manuals, schematics, system status, and updated instructions may be readily available on-line via wireless networks. This in-formation can be accessed using a laptop, or a Personal Digital Assistants (PDA), but in order to do so, the worker must shift attention away from the task at hand. For example, to access a specific schematic through a PDA, an aircraft repair technician needs to interrupt his work, retrieve his PDA from a pocket or bag, navigate the PDA’s interface, read the desired information, and finally stow it away again before resuming work. Equipping the worker with a head-up display, speech input, or one-handed keyboard, helps reduce distraction from the physical task. However, to navigate the interface and find the required information, a potentially distracting amount of cognitive effort is still required.
1.1.1. A wearable solution
Wearable computing researchers have come up with body mounted computers and novel user interfaces to address the physical distractions involved in this problem. From the cognitive side, pro-active systems that automatically re-trieve the right information at the right time have been proposed [1]. The core of such systems is the ability to follow the progress of the task and automat-ically recognisewhatis being done andwhen. Thus, a manual on performing the removal of a turbine blade from an engine can be automatically brought up to the head mounted display of an aircraft maintenance worker as soon as he begins with this specific part of the repair procedure.
The key to the success of this is the monitoring of specific activies as they happen. Three main approaches for this have been investigated:
1. Augmenting the environment (e.g the aircraft engine) with sensors which can tell the system which part is being accessed by the user and what is happening to it. This has the advantage of being computationally inex-pensive, and potentially very reliable. For extensive and detailed recog-nition however, such a system would require a large number of parts to be augmented, something which is either infeasible or too expensive. Recently, however, this approach has seen growing interest with the ad-vent of Radio Frequency Identification (RFID) tags. These are cheap to manufacture, and have been already widely deployed as product identi-fication tags by some well known high street stores.
the three approaches a video system with appropriately placed cameras provides the most information, and in principle could facilitate the most detailed analysis. However, the signal processing involved in extracting this information can be computationally intensive and, in the general case, remains an open problem. This is particularly true for setups with varying, dynamic lighting conditions and occlusions.
3. Body worn sensors to monitor user activity. This is a relative new ap-proach that has emerged as a key research focus in wearable computing. The most popular variant relies on motion sensors (accelerometers and gyroscopes) attached to relevant parts of the body, in particular hands and arms, to provide information about user motions. Other sensors which are commonly used include microphones, GPS (Global Position-ing System), and light sensors. These provide additional information about the user’s environment or location which might help with the activity recognition task. By augmenting the user rather then the en-vironment, the cost of augmentation can often be reduced (there are more engines then maintenance workers). When a small number of sim-ple sensors are used, the signal processing and extraction of information is potentially less complex than in the case of vision. (This is not nec-essarily so when a large number of sensors, with high data rates, are used.)
The choice of which approach to use depends on the specific application and its associated requirements. In many cases a combination of two, or even all three, of the above might be appropriate. In this work we focus on the use of body worn sensors. Specifically, we look at the combination of accelerometers and microphones mounted on the wrist and upper arm.
1.2. Aims of the thesis
We deal with the problem of developing an activity monitoring system using body-worn sensors. Despite the growing research interest in this area, many problems remain unsolved. This is particularly true for the continuous, real-world recognition case. The first problem this thesis deals with is how to recognise useful activities from a continuous sequence of mostly unwanted motions. The second problem, once we have a solution to the recognition problem, is how to tell how good this solution is - how do we measure its performance.
1.2.1. Continuous activity recognition
-recognising all possible activities - is a clearly intractable task: there are just too many possibilities. If we constrain the problem space, however, the prob-lem becomes more manageable.
In this work we restrict the activities of interest to those performed in an assembly scenario - specifically a wood workshop. These all involve the inter-action of the hand with some tool: a hammer, a saw, a drill, etc. Such activities usually involve characteristic motion sequences and have distinct sounds. We therefore base our study on microphones and accelerometers mounted on two locations: the wrist and upper arm.
The recognition problem is then dealt with in two steps: (1) segmentation of the interesting activities from a continuous sequence (when do they occur, and for how long?); and (2) classification of the selected segments (which activities have been detected?).
The main questions on this topic that are addressed in this thesis are: 1. How do we detect interesting activities from a stream of (mostly)
unin-teresting activities using microphones and accelerometers?
2. How accurately can we recognise specific activities using these sensors -is performance improved by combining them?
3. If the recognition system is to be used in a working environment, the wearability of its implementation becomes an important issue. It must be small and unobtrusive. A single body-worn device would meet these requirements - similar, for example, to a wristwatch. But would the limitations of such a device allow adequate recognition performance?
1.2.2. Performance evaluation (and optimisation)
Once we have developed a potential solution to the recognition problem, how do we then evaluate how good it is? If we have several solutions, how do we compare them? These questions are important not only for helping developers fine-tune or optimise their systems to a given application, but also to allow different researchers to compare and contrast their approaches - a necessity, it might be argued, if the field is to mature. To-date, no standard method exists for the specific problem of activity recognition - nor indeed for the more general topic of context recognition.
There are three main requirements for any performance evaluation strat-egy. The first is the establishment of open datasets to be used as benchmarks.1 The second is in finding appropriate measure(s) for capturing the most crit-ical information about the problem domain. And the third, perhaps most important requirement, is the acceptance of both of these as standard by the research community.
This thesis deals with the the second requirement. Specifically, we address the following questions:
1. What is the most relevant performance information for continuous ac-tivity recognition?
2. If existing measures fail to capture this information, is there scope for a new proposal specific to the problem of activity recognition?
1.3. Related work
Many wearable systems explore context awareness and pro-active involvement as means of reducing the cognitive load on the user, an early example this being the work of Abowdet al.[3].
Vision Much work has been devoted to motion and activity recognition us-ing computer vision. For an extensive survey on the visual analysis of human motion, see Moeslund and Granum [4]. Full body recognition has been stud-ied by Kale et al. [5], by Aggarwal and Ali [6], and by Rittscher and Blake [7]. Torralba et al [8], among others, have used wearable vision to recognise location and objects. The thesis of Clarkson [9] investigated the long term use of wearable vision to track user location and situation. A topic which has been extensively studied in the wearable domain is that of gesture and hand recognition. Over the years many works have appeared in this direction, for example Starner [10], Vogler [11], Wilson and Bobick [12], Schlenzig [13] and Rehg [14]. Though powerful vision can suffer in the mobile and wearable do-mains from drawbacks such as occlusion and changes in lighting conditions as users move around. For many recognition tasks the computation complex-ity - and the associated power consumption - is often beyond what current wearable hardware can support.
Body-fixed accelerometers Non-visual, body fixed sensors (BFS), in
par-ticular accelerometers, have been employed for many years in the analysis of body posture and activity, such as in the work of Bussmann et al.[15]. The primary area of application has been ambulatory monitoring in a clinical set-ting, collecting data to assist in assessment of patients with a wide range of conditions, such as Parkinson’s disease, or injury rehabilitation (for example, see Bonato [16], or Salarianet al[17]). Several works have been proposed to monitor the walking patterns of elderly people (Najafi et al. [18], or Sekine
et al.[19]) . They have also been used to study working environments.
Uiter-waalet al. [20] performed a feasibility study on the long term monitoring of
Using two uniaxal accelerometers - one radial at the chest, the other tan-gential at the thigh - Veltink et al. [21] were able to evaluate the feasibility of distinguishing postures, such as standing, sitting and lying; they also at-tempted to distinguish these from the dynamic activities of walking, using stairs and cycling. Developments on this, all with the goal of ambulatory ac-tivity recognition, have since been carried out by Aminian et al. [22], and more recently by Wetzler et al.[23]. For an overview on the use of different BFSs (particularly for clinical applications) see the report by Aminian and Najafi [24].
In the wearable domain recognition of ambulatory activities has been dealt with by a number of researchers. This is usually part of an attempt at recog-nising user context (for example, Mantyjarviet al.[25], Randell and Muller [26], Van-Laerhoven and Cakmakci [27]).
Vildjiounaite et al. [28] used a combination of accelerometers, magnetic sensors and maps to detect user location and walking behaviour inside a build-ing.
Recently, Westeynet al.[29] used wearable accelerometers to spot certain behavioural activities in autistic children, and Bao and Intille [30] to recognise multiple full-body activities. Chamberset al.[31] investigated the recognition of certain Kung Fu moves by augmenting visual recordings with wrist-worn accelerometer data.
Of more intricate hand activities, such as interaction with objects, or ges-ticulation, there have been several works using accelerometers - generally involving sensors either on the objects being manipulated, as presented by Antifakoset al.[32], or embedded in special gloves, as shown by Fang et al.
[33].
In the thesis of Junker[34], the topic of continuous activity recognition using body-worn accelerometers is dealt with in depth. Of particular interest in this work is the introduction of a method for segmenting interesting activ-ities (specifically, closed motions with a clear start and stop points) from a continuous stream.
Sound and sensor combination Peltonet al.[35] investigated the use of
sound for analysing situations, such as detecting which location the user is in - bedroom, street, church, etc. B¨uchler [36] presented a method of using sound analysis to improve the performance of hearing aids. Recently, Scott
et al. [37] used sound for fine grained location detection within a building.
And in [38], Chenet al.used sound - rather distastefully for some - to detect activities in a bathroom.
This combination has also been used by Chibelushiet al.for people recognition [40].
Using body-worn accelerometers to estimate user posture and sound for speaker detection, Kern et al. [41] was able to build a system that helped annotate video recordings in a meeting scenario. In a more general setting, Kern [42] went on to annotate long term recordings of daily life. Physical activity ‘cues’ were provided by acceleration, social environment ‘cues’ by sound, and location information using GPS. The focus of this work, however, was to infer information about a user’s interuptability rather than specific recognition of activities.
Wu and Siegel [43] used a combination of accelerometers and microphones to provide complementary information about defects in material surfaces.
Other approaches Van Laerhoven and Gellersen [44] presented a
cost-effective and low-power alternative to accelerometers that used multiple tilt-switches. This setup was used in [45] for observing and logging human activity. From the same group, Schmidt et al. [46] used sensors built into surfaces -such as table tops - to detect loads placed on them. This was part of a general work to augment the user’s environment with ‘smart’ devices [47].
As already noted RFID tags, as they shrink in size and cost, are growing in popularity. One instance of their use in the wearables domain is that by Philipose et al.[48]. In this work an RFID reader is integrated into a glove, allowing context to be infered from the interactions the user has with different tagged objects.
Fusion Fusion of multiple information sources is a well studied and diverse field covering many different disciplines. Within the domain of activity recog-nition, fusion of multiple sensors stems largely from the intuitive notion that two well placed sensors say more about an activity than merely one alone. Just as sensors can be anything from real hardware, such as the microphones and accelerometers used in this work, to virtual sensors existing only as an abstraction in software. So too ’fusion’ can be anything from the concatena-tion of different feature vectors from a single sensor, to some probabilistic inference from a diverse set of independent sensors.
Two commonly used approaches for fusing the data from two or more sensors are ‘feature fusion’ and ‘classifier fusion’.
like Hidden Markov Models (HMM), a specific type of Dynamic Bayesian Net-work (DBN), can be used (Rabiner [51] gives the ‘classic’ text on HMMs, but for a more recent overview of DBNs, see Murphy [52]). Variants on these, such as Coupled HMMs, allow for a greater modeling power for different features. These have been used to combine audio and video for speech recognition by Nefianet al.[53, 54] and by Potamianos et al. [55].
Classifier fusion This approach involves fusing the results from several, in-dependent classifiers. Often classifiers perform best when they are specialised for a specific subset of classes. The approach taken in classifier fusion is to gather the results of several such ’specialist’ classifiers and pool their resources to provide a more accurate overall result (see Kittleret al. [56] or Xu et al.
[57]). There are three basic approaches to classifier fusion: ‘hard’ fusion using comparison of top classifier results, ‘soft’ fusion using class likelihood esti-mates, and, somewhere in between, fusion using class rankings. Each of these are discussed below.
The simplest classifier combination is to compare the top decisions of each classifier, throwing out any results where there is disagreement. The problem with this is that it disregards any specialisation that one classifier might have over another.
The second approach at classifier fusion is to make use of the class prob-abilities. Assuming the classifiers are able to provide a continuous output, such as likelihood values, or class distances, the fusion step will have a far richer source of information with which to make an overall decision. Variants of HMMs can been used to do this (again, see Murphy [52]). One stochastic approach which is particularly suited to this problem is Dempster-Shafer (DS) combination. DS has been used in a variety of work, for example, by Denoeux [58], Le Hgarat-Mascle [59]. Of particular interest is the use of DS for sensor fusion in the thesis of Huadong Wu [60] and by Wu and Siegel in [61, 62]. A good overview is also provided by Sentz and Ferson [63]. One drawback of these methods is the high computation cost. It can also be difficult to find sufficient data for training.
The third approach at classifier fusion is to combine the classifier rankings. Rather than incorporate the specific class probability or likelihood values from each classifier, this approach just uses the rankings of these values. An advantage of this is the reduced computation required. Several alternative methods for doing this were explored in the works of Ho [64, 65].
Performance evaluation While working on different recognition problems and looking at related publications we have found that existing evaluation measures, mostly taken from related fields such as automatic speech recogni-tion (ASR), informarecogni-tion retrieval (IR), and vision related fields such as optical character recognition (OCR), often fail to adequately reflect the specific prob-lems of the context recognition task, in particular with the non segmented, continuous case - e.g. continuous recognition of activities.
Even within some of the well-established domains there is a lack of consen-sus on standard methods of evaluating performance. Often the methods used tend to vary from researcher to researcher. In the vision domain, for exam-ple, Hooveret al.[66] commented that “the comparative framework is itself a research issue,” a notion echoed by M¨uller in 1999 [67], and again by Zhang in 2001[68]. In ASR the problem of finding a proper scientific evaluation has been mulled over since Pierce’s 1969 paper “Wither Speech Recognition”[69], through Moore in 1977[70], to Greenberg in 2001[71]. In the general topic of time series data mining, Keogh & Kassetty[72] make similar criticisms. Today, researchers in these fields continue to develop new or adapt existing measures to suit the particular problems which they face. It is true that no single eval-uation measure can capture all of the different facets relevant to each domain, but generally the combined use of several well-chosen standard measures is desirable - and is recommended by nearly all of the above commentries.
This has prompted us to investigate the particular problems of evalua-tion measures in continuous context recognievalua-tion, and to propose an alterna-tive strategy for evaluation which combines the strengths of several existing methods without throwing away critical information relevant to the context problem.
1.4. Outline of the thesis
The thesis is structured into two main parts: Chapters 2 to 6 deal with the continuous activity recognition problem; and Chapter 7 and 8 with perfor-mance evaluation. The outline of each chapter is as follows:
Chapter 2 introduces the testbench scenario, the use of tools in a wood
workshop, upon which the remainder of the work presented in this the-sis is based. The scenario - and the method of using body-worn micro-phones and accelerometers to monitor it - is justified by analysing the different activities, and highlighting their diversity as representative of more general activities involving interaction of the hand with tools.
using LDA-based classification on the sound, and HMM classification on features extracted from the accelerometers.
Chapter 4 presents a method for segmenting activities from a continuous
sequence using two separately placed microphones. We investigate the use of this method for different types of activity, and for different test subjects.
Chapter 5 takes the ideas of the previous chapters and brings them together in a multi-subject analysis of the continuous activity recognition prob-lem. This uses a variant of the sound based segmentation introduced in Chapter 4. A key contribution of this chapter is the use of fusion methods to combine the sound and acceleration classifiers for improved performance.
Chapter 6 wraps up the topic of continuous recognition by adapting the
methods from Chapter 5 to show how they might be used on a single wrist-worn device.
Chapter 7 analyses the problem of evaluating performance in continuous
activity recognition. The key contribution of this chapter is in the de-velopment of a more thorough method for assessing performance in con-tinuous activity recognition systems. We identify four categories of error
-fragmenting,merge,overfill andunderfill- which we argue are
impor-tant for activity recognition tasks, but which existing methods fail to capture. We introduce a method of performance characterisation based on the notion of segments, and show how this can be tabulated using the so-calledSegment Error Table (SET).
Chapter 8 brings the two main parts of the thesis together. We apply the evaluation strategy of Chapter 7 to the earlier results of chapters 5 and 6. We discuss the significance of these findings, and show how the evaluation strategy can also be used for system optimisation.
2
Choice of test scenario
2.1. Problem analysis
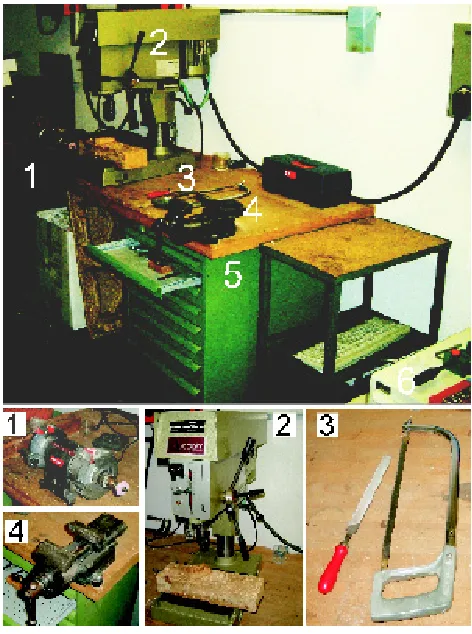
We wish to explore the use of on-body sensors to recognise a user’s activities. To ground our work we have chosen to examine the activities performed during an assembly task in a wood workshop. Specifically, this involves the use of five different hand tools (hammer, saw, sanding paper, file and screwdriver), the use of two machine tools (grinder and drill), and the use of fixed bench apparatus (vise and drawer).
These activities, though limited here to a specific scenario, are fairly di-verse. In some respects they can be said to provide insight into a wide range of activities using the hand and some object or tool. Common to many ac-tivities they produce both a variety of different sound signatures and a range of characteristic motions. Hammering, for example, is characterised by the rise and fall of the arm, accompanied on impact by a loud bang. Use of the saw produces a more regular sound, directly correlated with the back and forth movements of the arm. The hand twists associated with using a screw-driver are generally accompanied by correlated, but much quieter sounds. In contrast, the use of a drilling machine produces a loud, continuous sound re-gardless of what the user does with his or her arm. The arm motion associated with drill use is itself well-defined, but is more or less independent from the sound being made. Even more extreme, the opening and closing of a drawer produces a characterstic sound, while its corresponding motion can vary from a well-defined push, to a simple nudge of the elbow or leg.
Following from the observation that hand motions and accompanying sounds can provide characteristic information on certain activities, micro-phones and accelerometers were chosen as the system sensors. These were used to record a multi-subject dataset based on a wood workshop scenario, which shall be described further in the following section.
2.2. Experimental setup
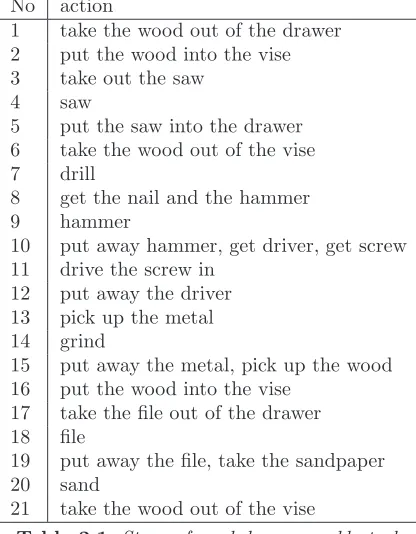
No action
1 take the wood out of the drawer 2 put the wood into the vise 3 take out the saw
4 saw
5 put the saw into the drawer 6 take the wood out of the vise 7 drill
8 get the nail and the hammer
9 hammer
10 put away hammer, get driver, get screw 11 drive the screw in
12 put away the driver 13 pick up the metal 14 grind
15 put away the metal, pick up the wood 16 put the wood into the vise
17 take the file out of the drawer 18 file
19 put away the file, take the sandpaper 20 sand
[image:25.432.118.326.192.459.2]21 take the wood out of the vise
Figure 2.1:The wood workshop (top) with closeups of (1)grinder, (2)drill,
(3)file and saw,(4) vise, and(5) cabinet with drawers.
2.2.1. Procedure
The exact sequence of actions is listed in Table 2.1. The task was to recognise nine selected actions: use of hand tools such as hammer, saw, sandpaper, file and screwdriver; use of fixed machine tools such as grinder, drill and vise; and finally the use of two different types of drawer. To be ignored, or assigned to the garbage class, are instances of the user moving between activities and of interactions with other people in the shop.
completely sawn), allowing us to complete the experiment in a reasonable amount of time. However this protocol influenced only the duration of each activity and not the manner in which it was performed.
Five subjects were employed: one female, four male; all of normal build and in the range of 25-35 years old. All were right handed. Each subject performed the sequence in repetition between three and six times producing a total of (3+3+4+4+6)=20 recordings. Some subjects performed more repetitions than others because of a combination of technical problems in recording data and the availability of subjects. Each sequence lasted five minutes on average. The total experiment time, therefore, was around 1 hour and 40 minutes (6014 seconds).
For each recording the activity to be performed was prompted automati-cally by a computer, which an observer read out voautomati-cally to the subject. The exact timing of each activity was recorded by the computer when the observer pressed a key at the beginning and end of the activity. Any errors in these semi-automatic annotations were later corrected by visual inspection of the data and listening to the recorded audio. This provided the ground truth from which all subsequent training and evaluations were based.
No labelling scheme of a continuous system can be perfect. The definitions of activity start and stop during ground truth annotation might be judged differently by different observers. Differences again arise depending on which sources are used (visual, sound, or even acceleration signals). For these exper-iments, therefore, a set of criteria on what constitutes each particular activity class - when it starts and stops - was used during the labelling process. The in-tention was not to provide the definitive definitions on the classes, but rather to help maintain consistency in the labelling between each of the different recordings.
2.2.2. Data collection system
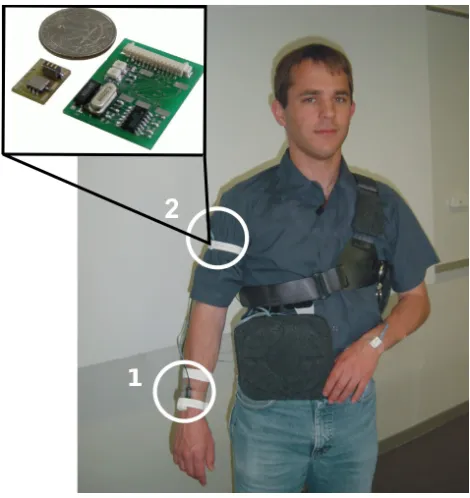
Data collection was carried out using the ETH PadNET sensor network [73] equipped with two 3-axis accelerometers connected to a body-worn computer, and two Sony mono microphones connected to a MiniDisk recorder. The sen-sors were positioned on the dominant wrist and upper arm of each subject, with both an accelerometer node and microphone at each location, as shown in Figure 2.2 (further details on these sensors and their placements are given below.) These recordings were later ported to a desktop PC for processing.
3-axis accelerometers
Figure 2.2:The sensor type and placement on a test subject: (1,2) micro-phone and 3-axis acceleration sensors. Inset shows one of the PadNET sensor nodes used for collecting acceleration data. Sound collection is done using two mono microphones mounted alongside the PadNET nodes (only the wrist mic
can be seen on this image(1)).
was felt to reveal useful additional information on the posture and dynamics of certain hand activities, thus motivating selection of the upper arm location. The reason for choosing 3-axis accelerometers was based on the observation that the arm and wrist tend to have more degrees of freedom than, say, the torso, where standard 2-axis sensors are traditionally used (for example, in ambulatory monitoring work [21, 22, 23]).
The x-axis on the wrist is defined by drawing a line along the forearm towards the index finger. The y-axis follows the direction of the extended thumb. When the arms are straight, flush with the torso, and with palms facing inwards, the x-axis of the upper arm follows the same line along the arm as the wrist x-axis. For this same position, the y-axis on the upper arm faces forward and stands perpendicular to the body.
incor-porates a MSP430149 low power, 16-bit mixed signal microprocessor (MPU) from Texas Instruments running at 6MHz maximum clock speed. The current version reads up to three analog sensor signals including amplification and filtering and handles the communication between modules through dedicated I/O pins. The sensors themselves (see inset on Figure 2.2) are hosted on an even smaller “sensor-module” that can be either placed directly on the main module or connected through wires. The sensor modules were based on a 3-axis accelerometer package consisting of two ADXL202E devices from Analog Devices. The analog signals from the sensor were lowpass filtered in hardware with a fcutof f = 50Hz, 2nd-order, Sallen Key filter and digitised at 12-bit resolution using a sample rate of 100Hz (as used previously in [73]).1
Microphones
The wrist was chosen as a convenient location to detect sounds made by hand activities, and so this was where the first microphone was placed. Based on the hypothesis that two separately placed microphones can give a rough indication of sound source location (elaborated further in Chapter 4), a second microphone was also used. This was placed, during an initial study [74], on the user’s chest. Unfortunately this location meant that the distance between mics would change as the user performed the tasks. Instead, a microphone on the upper arm, just above the elbow, and a fixed distance from the wrist, was used.
The two channels of recorded sound - wrist and arm - were initially sampled at 48kHz, but were then downsampled to 2kHz (with appropriate filtering in software) for use by the sound processing algorithms. In an earlier work on sound classification of activities [75], a sample rate of 4.8kHz was shown to be sufficient in capturing the most distinguishing frequencies of interest for common non-speech sounds. On further analysis of the sounds produced by the woodshop activities, we found that the most dominant signal frequencies were to be found below 1kHz. Thus a 2kHz sample rate was deemed to be sufficient.
2.3. Analysis of the data
The purpose of the following section is to investigate both the usefulness of the proposed method and the suitability of the chosen scenario. By looking at the recorded data, we categorise the different signals into more general activity, and sound,types.
−1g 1g −1g 1g −1g 1g −1g 1g
0 1 2 3 4 5 6 7 8 9 10 Snd x1 y1 z1 x2 Time(seconds) drill raise handle lower handle −1g 1g −1g 1g −1g 1g −1g 1g
0 1 2 3 4 5 6 7 8 9 10 Snd x1 y1 z1 x2 Time(seconds) vise
(remove wood) close vise open vise
Figure 2.3: Example data from drilling (left) and vise (right), both 10
sec-onds long. The signals shown are the x-axis arm acceleration (x2), 3-axis
of wrist acceleration (x1, y1, z1), and sound (Snd - wrist in black, arm in
grey). The acceleration signals, though offset from one another for
readabil-ity, are each shown relative to gravity (±1g). Note the smooth acceleration
signals as the drill is lowered, and then, after about 7s, raised again. The corresponding sound signal, mostly from the machine motor, remains fairly constant throughout. Starting from the jammed shut position, the vise is force-fully opened (note the peaks at 0.5 seconds), the wood is removed, and the vise is then slowly wound back to the closed position. Most of the sounds from each turn are a result of ‘clunks’ produced whenever the handle is loosened.
2.3.1. Acceleration analysis
The maintenance activities that we are concerned with all involve the in-teraction of a subject’s hand with an object or tool. When analysing these interactions, a human observer might note certain characterstics of motion that are representative of that type of activity. If activity types can be dis-tinguished visually, using plots of signal data, then any attempt at machine recognition is likely to be more successful.
The following analysis of the wood workshop data is conducted using visual inspection of the accelerometer signals. Of the nine activities at least seven types of motion involving hand-tool interaction were found:
1. Well-defined, smooth motion - as observed in the use of a drilling
leaves very little room for variations other than the speed at which it is executed. This is also true for the rise of the handle at the end of a drilling sequence. The time length of a single sequence is usually in the order of a few seconds.
2. (Almost) well-defined, continuous motion -as observed in the tightening
and loosening of a vise, an example of which is shown in the right plot of Figure 2.3. Though such activities have a well-defined motion dictated by the physical mechanics of the tool, there exists scope for a user to manipulate the tool in a variety of ways. With tightening the vise, for example, the user might lightly turn the handle with their finger at first, but move on to using their whole hand as the movement becomes tighter. Such activities are generally continuous, with a change in direction only at the beginning and end of the sequence - where the user tightens or releases the vise, for example.
3. Steady hold (with possible vibration) -such as observed with the use of a
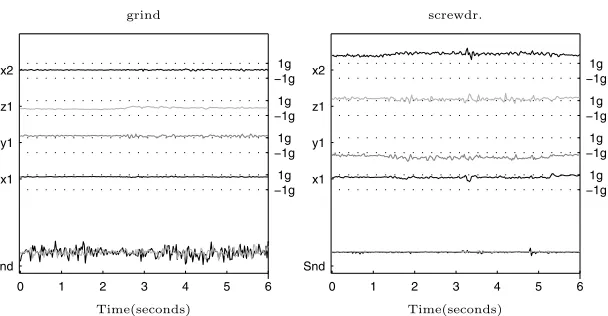
grinding machine while the user holds a piece of metal to the grindstone. Almost no movement is observed, as the signals in the left plot of Figure 2.4 show, and the hand is held in a fairly steady position, with only very occasional movement.
4. Well-defined, repetitive twisting motion - as observed in the use of a
screwdriver. The user’s hand and arm move the tool in a specific twist-ing manner. For any screw position one of the wrist axis always remain still while the other two show small notches in acceleration as the driver is twisted. In all of the examples in this dataset the screw is driven down-wards, with respect to gravity. Consequently, the x-axis shows fewer, and less pronounced, notches than y and z.
5. Well-defined, repetitive linear motion. These activities can involve a
steady back-and-forth motion, such as is observed with the use of a saw; or a steady rise of the arm, followed by a sharp fall, ending in an abrupt halt, as observed during hammering (Figure 2.5). Both of these activities are characterised by repetitive motions. Sawing, for example, usually involves more than one back-and-forth movement; hammering generally involves more than one strike, etc.
6. Ill-defined, repetitive linear motion.Such as is observed in the use of a
−1g 1g −1g 1g −1g 1g −1g 1g
0 1 2 3 4 5 6
Snd x1 y1 z1 x2
Time(seconds) grind
−1g 1g −1g 1g −1g 1g −1g 1g
0 1 2 3 4 5 6
Snd x1 y1 z1 x2
[image:32.432.59.363.79.237.2]Time(seconds) screwdr.
Figure 2.4: Example data from grinder (left) and screwing (right).
(Sig-nals shown are the x-axis arm acceleration (x2), 3-axis of wrist acceleration
(x1, y1, z1), and sound (Snd- wrist in black, arm in grey). Acceleration
sig-nals shown with respect to gravity (±1g).) Note the lack of hand movement,
and the continual sound (from the machine), when using the grinder. The notches of sound shown in the grinder example correspond to whenever the metal makes contact with the grindstone. The screwdriver example, in com-parison, is almost silent. The small notches in the z1 and y1 axis reflect the twists of the driver. The x1 axis shows slightly fewer notches than z1 and y1, reflecting the fact that this is the axis pointing into the screw. More pro-nounced with this activity, however, is the effect of gravity on each of the axis - this reflects the specific position of the wrist and arm.
model than the well-defined ones such as hammering. In many of the experiments here, these activities are carried out in a way which can be regarded as very similar to that of sawing. Some confusion between recognition of these classes is therefore to be expected.
7. Ill-defined, one-off motion - as observed in the opening and closing of
−1g 1g −1g 1g −1g 1g −1g 1g
0 1 2 3 4 5 6
Snd x1 y1 z1 x2
Time(seconds) saw
−1g 1g −1g 1g −1g 1g −1g 1g
0 1 2 3 4 5 6
Snd x1 y1 z1 x2
[image:33.432.69.375.81.235.2]Time(seconds) hammer
Figure 2.5: Example data from sawing (left) and hammering (right).
(Sig-nals shown are the x-axis arm acceleration (x2), 3-axis of wrist acceleration
(x1, y1, z1), and sound (Snd- wrist in black, arm in grey). Acceleration
sig-nals shown with respect to gravity (±1g).) The sawing action produces a loud,
regular sound and highly correlated, slightly serrated, acceleration signals. The hammer action is also very regular and well-correlated with sound: the smooth raise and quick fall; then, on striking the surface, a sudden halt and a loud peak in sound.
reflected in the acceleration examples of Figure 2.7 by a ’dip’ (a change in the 1g influence of gravity) at the beginning and end of each open and close sequence.
A further category is the non-interesting, or NULL activities. These in-clude everything from walking between activities, scratching one’s nose, to picking up something from the floor. This category is the most difficult to model - especially if using only acceleration signals. This is because of the huge variety of activities consigned to NULL. We cannot model all possible activities - at least not using any method that requires real data for training. The required dataset, though a pattern recognition researcher’s dream, would be extremely large and consequently difficult, if not infeasible, to collect.
−1g 1g −1g 1g −1g 1g −1g 1g
0 1 2 3 4 5 6
Snd x1 y1 z1 x2
Time(seconds) file
−1g 1g −1g 1g −1g 1g −1g 1g
0 1 2 3 4 5 6
Snd x1 y1 z1 x2
[image:34.432.53.364.79.237.2]Time(seconds) sand
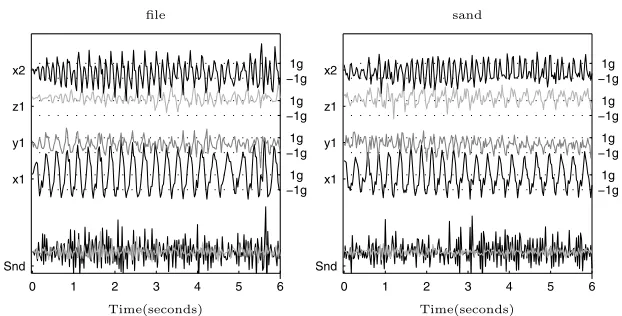
Figure 2.6:Example data from filing (left) and sanding (right), both with a similar back-and-forth motion. (Signals shown are the x-axis arm acceleration
(x2), 3-axis of wrist acceleration (x1, y1, z1), and sound (Snd- wrist in black,
arm in grey). Acceleration signals shown with respect to gravity (±1g).) Note,
these signals might look regular, but are in fact potentially very variable -particularly with sanding. For example, the dominant wrist axis might change from x to y at any one time depending on the positioning of the object being worked on
2.3.2. Sound analysis
Considering that many of the motions relevant to assembly and maintenance scenarios are associated with distinct sounds, it makes intuitive sense to use sound analysis as a complementary method for recognition. Looking at the plots of data, we distinguish four different types of sound:
1. Sounds made by a hand-tool -these sounds are directly correlated with
−1g 1g −1g 1g −1g 1g −1g 1g
0 1 2 3 4 5 6 7 8 9
Snd x1 y1 z1 x2 Time(seconds) drawer open close open −1g 1g −1g 1g −1g 1g −1g 1g
0 1 2 3 4 5 6 7 8 9
[image:35.432.70.375.81.237.2]Snd x1 y1 z1 x2 Time(seconds) small drawer open close
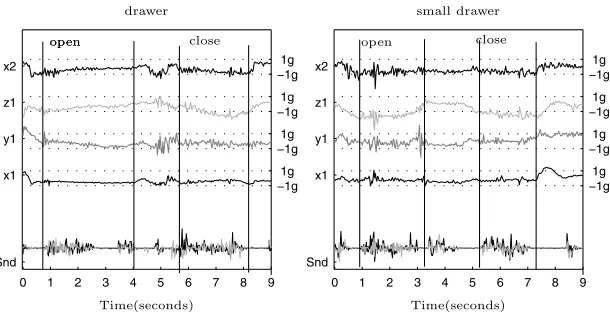
Figure 2.7: Example data from the open and close sequences of two
differ-ent drawers. (Signals shown are the x-axis arm acceleration (x2), 3-axis of
wrist acceleration (x1, y1, z1), and sound (Snd- wrist in black, arm in grey).
Acceleration signals shown with respect to gravity (±1g).) The only notable
difference between these two drawer types is their location - below the desk (for tools), or above (for screws and nails). This is reflected in the differing effects of gravity on the signals. Otherwise, the sequences follow a similar pat-tern: a dip (in acceleration) as the subject turns their hand to manipulate the drawer handle; a steady motion as the drawer is opened (with a corresponding ‘rolling’ sound); a flip of the wrist again as they manipulate objects within the drawer; and the same in reverse for drawer closing.
2. Semi-autonomous -these sounds, though not directly correlated to hand
motion, are caused by machines or tools which the hand might come close to. This includes sound produced by a machine, such as the drill or grinder. Although ideal quasi-stationary sounds, sounds in this class may not necessarily be dominant and tend to have a less distinct intensity difference between the hand and the upper arm (for example, when a user moves their hand away from the machine during operation). The sound of a drawer opening and closing might also be included in this category.
3. Quiet sounds -these are generated by activities which are almost silent,
whenever the handle drops.
4. Autonomous sounds.These are sounds generated by activities not driven
by the user’s hands (e.g loud background noises or the user speaking). These sounds are classed in this work asNULL.
The vast majority of relevant actions in assembly and maintenance are associated with handtool sounds and semi–autonomous sounds. In principle, these sounds should be easy to identify by utilising the differences in signal strength between the wrist and the arm microphones - this idea shall be treated in greater detail in Chapter 4. In addition, If extracted appropriately the sounds may be treated as quasi-stationary and can be reliably classified using simple spectrum pattern matching techniques.
2.4. Conclusion
3
Activity recognition
using sound and
acceleration
3.1. Introduction
The previous chapter highlighted the feasibility of using sound and accelera-tion from body worn sensors to recognise activities in an assembly scenario. We now present a concrete method for performing this recognition.
For sound, a spectral pattern matching classifier is used - specifically, a minimum distance classifier based on linear discriminant analysis (LDA). This follows from the recommendation of Chapter 2 that most of the sounds in-volved in an assembly scenario may be treated as quasi-stationary.
A standard method of classifying quasi-stationary sounds is to perform pattern matching on the frequency spectrum using a fast fourier transform (FFT). FFTs have high a dimension output though, so some means of re-ducing this is often required - particularly for a system aiming towards a low power implementation. St¨ageret al.[75] compared two such feature reduction techniques - Principle Component Analysis (PCA) and Linear Discriminant Analysis (LDA) (see Dudaet al [76]). Of these, LDA performed favourably for the everyday sound recognition tasks dealt with in that work. Because we have a similar recognition task here, the same approach - using LDA - is also used.
For acceleration, a time series classifier is used - specifically, Hidden Markov Models (HMM). The acceleration data, as shown in Chapter 2, is less characterised by frequency and more by particular sequences of motions. In the wood workshop scenario introduced in the last chapter, the ‘activity’ of hammering is defined by a repetitive sequence of smaller motions - lifting the hammer, then falling to strike. Such a sequence is an ideal candidate for HMM based classification.
HMMs are often used in pattern matching topics for modeling sequences. An advantage of HMMs, being probabilistic, is their resilience to noise caused by imperfect training and innacurate sensors. They are capable of modelling important properties of activities such as time variance (the same activity can be repeated at varying speeds) and repetition (an activity containing some motion which can be repeated any number of times).1
Most commonly used in speech recognition, HMMs are gaining ground in other fields too. In the work of Starner [78] HMMs were used to recognise communication gestures, in Cohen et al. [79] for emotion recognition from facial expressions. In Potamianoset al.[55] they were used to assist with the automatic speechreading of impaired speech. HMMs have also been used by 1There have been many tutorials on HMMs, the most cited being the 1986 work by
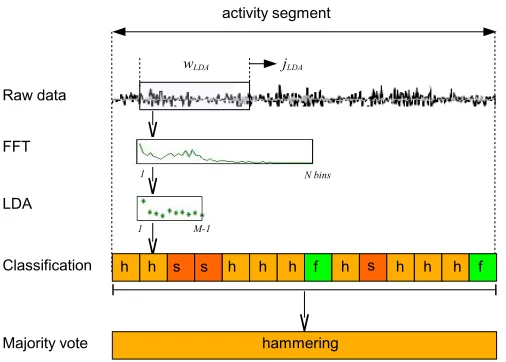
Figure 3.1:Steps of LDA classification on sliding window. FFT features with
high N dimension are reduced by LDA toM−1 dimension (where M is the
number of classes in the system). The reduced vectors are then classified. Ma-jority vote is taken over all the classifications within a given segment of data. Note: the ‘activity segment’ refered to here is any (variable length) section of data taken from, for example, the annotated ground truth.
various researchers in the topic of activity recognition. Recently, for example, Westeyn et al.[29] used HMMs for their work with wearable accelerometers. The implementation of the two classifiers - LDA and HMM - are described in more detail in the following sections. These are then evaluated on isolated data from the wood workshop scenario introduced in Chapter 2.
3.2. Recognition method
Recognition of both sound and acceleration data is carried out in two main steps: feature extraction, where the data is represented in a suitable form for distinguishing different classes; and classification, where a decision is made as to which class the data belongs.
3.2.1. Recognition using sound
The sound recognition process is illustrated in the example of Figure 3.1. The basic scheme operates on individual sound segments (orframes) of lengthwlda
Figure 3.2:LDA minimum distance classification for aM = 3class example
(reduced here to#M−1 = 2dimensions). Incoming LDA vector (marked with
‘?’) is shown with distances to the means of the training data clusters for each of the three classes. The minimum distance for the example shown here is to class ‘drill’.
in increments ofjlda. At each step, an LDA vector is generated and classified. The classification for an entire data segment is then generated from majority vote of all constituent frame classifications. These steps are given in detail below.
Feature extraction using FFT & LDA
The features used are the spectral components of eachwldaobtained by Fast Fourier Transformation (FFT). This producesN= fs
2·wldadimension feature
vectors. Rather than attempting to classify such largeN-dimension vectors directly, Linear Discriminant Analysis (LDA) is employed to derive an optimal projection of the data into a smaller,M−1 dimensional feature space (where
M is the number of classes).
Transformation of eachN-dimension FFT vector to anM−1 LDA vector is done by a single (NxM−1) matrix multiplication. This matrix is calculated from training data.
LDA classification
feature vector2. As an example of this, Figure 3.2 shows possible training data clusterings and their means for a simple 3 class system.
Finally, for classification of an entire segment, a majority vote is taken over all the constituent frame classifications.
3.2.2. Recognition using acceleration
Acceleration is processed by first extracting suitable features. The sequence of features for each segment of data is then ‘run’ through each of the class HMMs. These, in turn, return the likelihood of whether the sequence might have been ‘generated’ by that model. Classification is carried out by choosing the class of the model with the highest likelihood.
Feature extraction
In Chapter 2 it was shown that many of the different activities can be recog-nised by simply looking at plots of their data. These activities are often tem-poral in nature, with sequences of specific ‘sub-motions’: hammering, for ex-ample, was highlighted in the introduction as being a particular case of this. Drilling, too, involves a sequence of clear sub activities. These are enacted over a longer time period than hammering: the slow change in acceleration as the drill is lowered then raised again (see Figure 2.3).
A time-series modeling method, such as HMM, should have no problem identifying activities like these. In fact, for many of the activities only a small number of features is actually required. In this work the x-axis from both wrist and arm provide enough information to resolve most ambiguities between classes. For an example of this, refer to the grinder versus screwdriver plots in Figure 2.4 from the previous chapter.
Peak based features Some of the activities, however, are not so easily
characterised. Consider the similarity of signals for use of the saw, file and sandpaper in Figure 2.5 and Figure 2.6 from the previous chapter. These classes do have subtle differences, but not ones that are easily recognised by a time series analysis.
The use of sandpaper, for example, involves many subtle motions in the z-axis which are not as frequent as those during filing. This corresponds to the more ‘circular’ motion often employed during sanding, compared to the regular back and forth motion of using a file. To capture this effect, an ap-proximation of a frequency based feature is used.
This is achieved using absolute counts on the number of peaks within a sliding window. Specifically, a wacc window is slid across the data (sample 2A nearest neighbour (NN) approach might also be used. For this study both NN and
0 1 2 3 4 −1g
1g −1g 1g 0 1 2 3 4 5
Time(seconds) features for file
wrist-x
wrist-z
pkCnt(wrist-z)
0 1 2 3 4
−1g 1g −1g 1g 0 1 2 3 4 5
Time(seconds) features for sand
wrist-x
wrist-z
pkCnt(wrist-z)
Figure 3.3:Filing versus sanding: (top) peak count feature for the z axis from wrist; (middle and bottom) the raw acceleration shown for the z and x axis. Note that, despite the similarities of the raw signals for the two activities, the peak count of z records a higher value for sanding than it does for filing.
by sample). At each step the number of peaks found is returned. Figure 3.3 shows an example of this peak count feature for the z-axis (from the wrist sensor) for filing and sanding. Also shown, for comparison, is the raw x and z-axis signals. The actualwacc used here is 100ms.
Gravity invariance One concern with using only ‘raw’ accelerometer data
is the influence of gravity. Gravity is useful for characterising particular pos-tures (such as the case with drilling using a fixed machine), but this also means that it constrains the characterisation of hand held tools. Hammering, for example, might be misleadingly characterised by the particular orientation used in training (striking downwards).
To combat this, a ‘gravity independent’ feature is desirable. Such a feature is approximated using the mean amplitude of all the peaks within a wacc
sliding window. Signal peaks are again used because they often represent the most important parts of a sequence - sudden changes in acceleration. For activities involving strong acceleration changes (the end motions of the saw, for example) the amplitude of these peaks will be much larger than the±1g effect of gravity. Thus the mean over the short wacc window will give an indication of large changes in acceleration with only minimal influence from gravity.
• raw x-axis signals from wrist and arm
• count of peaks within wacc = 100mssliding window (on x,y and z for both wrist and arm)
• mean of peak amplitudes withinwacc = 100mssliding window (on x,y and z for both wrist and arm)
These features are additionally downsampled from 100Hz to 40Hz. To avoid complications with large variances in the learning algorithms, they are also standardized across each experiment set. This effectively means that each test feature is subject to both an offset and a scaling factor obtained from training data.
HMM classification
An HMM is defined for each activity class. Because the features used are continuous, the HMM observations are modeled using Gaussian probability distributions. For most class models, a mixtures of Gaussians are used. This provides a more expressive method of modeling the features.
Defining an HMM involves setting three sets of parameters : the number of states each model is to have, how many gaussian mixtures it uses to represent each feature, and the prior probabilities for the transition matices. The final setting of parameters - state transition probabilities, observation likelihoods and gaussian mixture settings - is done by training on data using the Baum Welch (forwards-backwards) algorithm (see Rabiner [51] for details).
Deciding on the number of states and the number of gaussians to use can be a tricky problem. Often the decision is made on a ‘rule of thumb’ basis: so long as there are sufficient states to describe the data - but not too many so as to avoid overfitting - the training step will usually take care of the details. This is the approach taken here.
The models used in this work were all tailored on the motion analysis presented in Chapter 2. The states (and possible state transitions) are shown together with the number of gaussian mixtures, for each of the class models, in Figures 3.4, 3.5 and 3.6. Also shown are example transition and mixture probabilities (obtained from one of the training sets).
The implementation of the HMM learning and inference routines for this experiment was provided courtesy of Kevin P. Murphy’s HMM Toolbox for Matlab [80].
Figure 3.4:HMM states and gaussian mixtures for hammer (left) and screw-driving (right). Both are 2 class ergodic models.
3.3. Experiment
Data from the five-subject wood workshop scenario, as introduced in Chapter 2, is used to evaluate the methods. To recapitulate, this involves nine activities performed in a well-defined sequence, including use of: hammer, saw, file, vise, grinder, drill, sandpaper, screwdriver and drawer.
The sound data used here was recorded from a microphone mounted on each subject’s wrist. The accelerometer data was taken from both the 3-axis accelerometers on each subject’s wrist and upper arm.
3.3.1. Setting parameters
In the work by St¨ageret al.[75] the LDA algorithm was found to perform well using a sample rate offs= 4.8kHzand a window size of roughlywlda= 50ms. This produced an FFT ofN = 2562 = 128 bins.
In the current work, it was found that fs could be reduced to as low as 2kHz without loosing performance. This was obtained by increasing the sliding window size towlda= 100ms. To allow a suitable overlap, the window jump distance was set atjlda= 25ms.
Because the results presented here are evaluated in isolation, the segments over which the classification is applied vary depending on the length of each event in the annotated ground truth.
3.3.2. Evaluation method
The recognition methods are evaluated in isolation. That is, wherever the ground truth denotes a positive activity segment, a result is returned for HMM classification, and a result is returned for LDA. Because neither classifier can return aNULLor non-positive classification, there are only two possible outcomes: correct, or substitution (incorrect).
The metric used to summarise the results is class relative isolation accu-racy, defined for each classc as:
isolation accuracy(c) = correctc
totalc (3.1)
with the number ofcorrectc andtotalc isolated segments in the dataset. Both the LDA and HMMs require prior training from data. Throughout this work, the data from the five subjects was divided and evaluated using the leave-one-out method for each of the user-dependent, user-independent, and user-adapted cases. These are implemented as follows:
1. User-dependent, where one set is put aside for testing, and the remaining