A Back Propagation Artificial Neural Network based
Model for Detecting and Predicting Fraudulent Financial
Reporting
Ahmed S. Salama
Computer and Information Systems Department Sadat Academy for Management Sciences (SAMS)
Cairo, Egypt
Amany A. Omar
Accounting Department Mansoura University
Mansoura, Egypt
ABSTRACT
Fraudulent financial reporting has become an important issue in accounting profession, the implementation of self-assessment system appears as incentives to companies to misstate their financial reports to reduce tax obligation. Fraudulent financial reporting may cause fast losses to government income, as well as losses to the users of financial reports; several recent Studies have examined the feasibility of using various machine learning techniques in business and industrial applications. The purpose of this research is to propose a back propagation based artificial neural network model for Fraudulent Financial Reporting detection and prediction. Another main objective for this proposed model is using it in measuring the financial performance assessment by detecting the positive and negative deviations in certain important accounts balances such as net sales, and accounts receivable, which will support top managers in taking important strategic financial decisions for their companies. The proposed model was implemented using NeuronsSolution ANN software and has been applied on two large Egyptian companies managing electricity distribution in Egypt. The implementation results of this proposed model showed that the model is successful, efficient and reliable in detecting and predicting fraudulent financial reporting, and also the assessment of any company's financial performance.
General Terms
Machine Learning, Artificial Neural Networks
Keywords
Machine Learning, Multilayer Perceptron (MLP) Artificial Neural Networks, Fraudulent Financial Reporting Prediction.
1.
INTRODUCTION
ANNs are computer software that simulates the way of human brain functions. The basic building blocks of human brains are neurons which process a number of inputs to produce output. ANN consists of simulated neurons in the format of layers and nodes. The main advantage of an ANN over other traditional programming methods is its ability to learn. Through a trial and error process, neurons adjust their weights of input variables to model the behavior or patterns of output variables. Financial fraud detection is one the important applications for ANNs. Financial statements fraud is one of the biggest challenges in the modern business world, this is when corporations engage in certain practices designed to hide or maneuver the accounts of a corporation to help it continue to remain attractive to investors, and it costs the world’s economies billions of dollars a year, in the US alone the cost of corporate fraud is estimated at $600 billion
performance, the Bayesian Belief Network model achieved the best performance managing to correctly classify 90.3% of the validation sample in a 10-foldcross validation procedure. [11] Nonyelum, et al. presented an automated credit card fraud (CCF) detection system based on neural network technology and rule-based component. The Self-Organizing Map (SOM) algorithm had used to create a model of a typical cardholder's behavior and analyze the features of transactions, thus detecting fraudulent transactions. [12] Hsueh-Ju Chen et al. presented a model aims to predict fraud Gap on internal control, which leads to reduce the auditor's ability to make sure that the data contained in the books and records. [13] Gupta et al. presented a data mining framework for prevention and detection of financial statement fraud. This framework used association rules, a descriptive data mining technique, for preventing fraudulent financial reporting along with the use of predictive data mining techniques such as classification for successful identification and detection of financial statement fraud. [14]
2.
THE
PROPOSED
ANN
BASED
MODEL
FOR
PREDICTING
FRAUDULENT
FINANCIAL
REPORTS ARCHITECTURE
This paper proposes a supervised learning back propagation artificial neural network based model for detecting and predicting fraudulent financial reporting. Supervised learning incorporates an external teacher, so that each output unit had told what its desired response to input signals ought to be. During the learning process, global information may be required; Paradigms of supervised learning include error-correction learning, reinforcement learning and stochastic learning, an important issue concerning supervised learning is the problem of error convergence, i.e. the minimization of error between the desired and computed unit values. The aim is to determine a set of weights, which minimizes the error. One well-known method, which is common to many learning paradigms, is the least mean square (LMS) convergence.
2.1
The Proposed Model Architecture
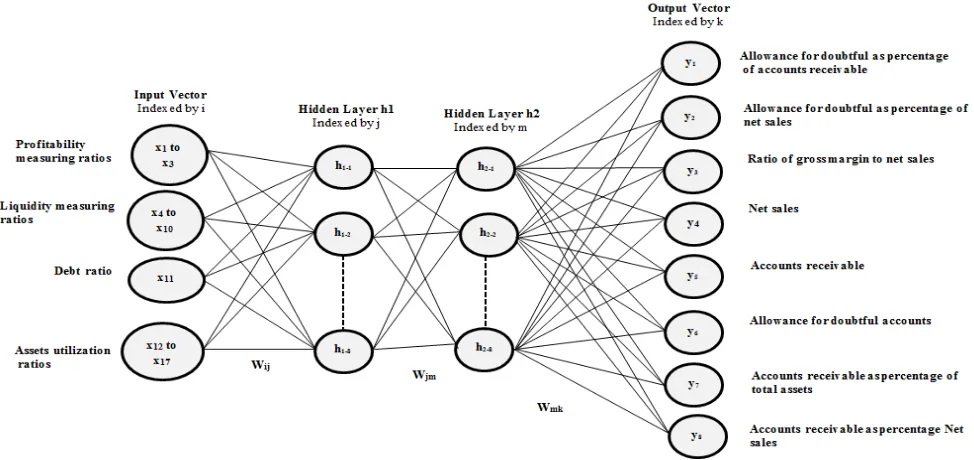
The architecture of the proposed Artificial Neural Networks Based Model for Predicting Fraudulent Financial Reports is shown in Figure 1. The proposed ANN model is a Multilayer Perceptron (MLP) network which is a layered feed forward network typically trained with static back propagation as the most used supervised learning scheme. The architecture of the proposed ANN consists of the input layer which contains a vector of seventeen PEs (input parameters), two hidden layers with a vector of eight PEs each, and output layer with eight PEs (output parameters). Listing of the input and output parameters of the proposed ANN model is explained in section 2.2. Where x1 .. x17 represent the input parameters for
the ANN classified into 4 categories, h1-1 .. h1-8 represent the
eight processing elements PEs in the first hidden layer (h1),
h2-1 ..h2-8 represent the eight processing elements of the
second hidden layer (h2), and y1.. y8 are the processing
elements of the output vector. Wij represent weights of
connections between PEs in the input layer and the PEs in the hidden layer (h1), wjm represent weights of connections
between PEs in the hidden layer (h1) and the PEs in the hidden
layer (h2), and wmk represent weights of connections between
PEs in the hidden layer (h2) and the PEs in the output layer. Each PE in the hidden layers or the output layer will do summation to combine and modify the inputs from the previous layer using the following equation:
𝑚𝑖= 𝑖𝑗 =1𝑥𝑖𝑤𝑖𝑗+ 𝑏𝑗 (1)
where mi is the net input to PE j in hidden or output layer,
xi are the inputs to PE j (or outputs of previous layer), i is the
[image:2.595.58.545.504.734.2]number of PEs in previous layer and bj is the bias associated with PE j. The activation (transfer) function used in the two hidden layers, and the output layer is the TanhAxon function. Each axon represents a layer, or vector, of PEs. All axons will also be equipped with a summing junction at their input and a splitting node at their output. This allows multiple components to feed an axon, which then processes their accumulated activity.
The TanhAxon applies a bias and tanh function to each neuron in the layer. This will squash the range of each neuron in the layer to between -1 and 1. Such nonlinear elements provide a network with the ability to make soft decisions. The used TanhAxon function in each hidden layer h1, h2, and the
output layer is as follows:
𝑓(ℎ𝑖𝑗, 𝑤𝑖𝑗) = tanh[ ℎ𝑖𝑗𝑙𝑖𝑛] (2)
Where ℎ𝑖𝑗𝑙𝑖𝑛 = 𝛽 ℎ
𝑖𝑗 is the scaled and offset activity
inherited from the LinearAxon.
2.2
The Proposed ANN Model Input and
Output Parameters
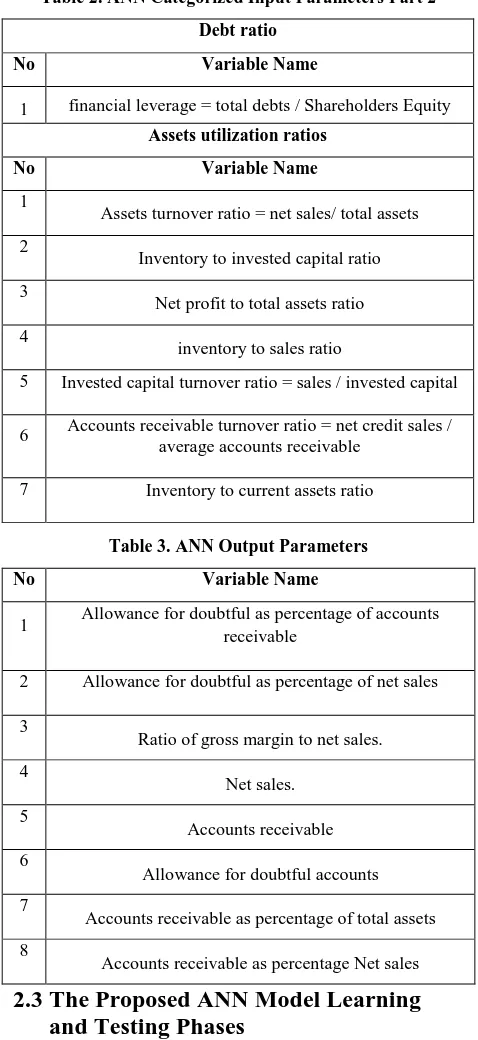
[image:3.595.309.548.79.599.2]Based on a review of practice and empirical literature, the proposed model uses four categories of input parameters for the ANN: profitability measuring ratios, liquidity measuring ratios, debt ratios, and assets utilization ratios. These categorized input parameters are shown in Table 1, and Table 2. In addition eight important related financial ratios were selected thoroughly based on a review of practice and empirical literature to be considered as the main output parameters for the ANN. These output parameters are shown in Table 3. All financial ratios that were used are related rather to revenue recognition and measurement or to the use of accounting estimates in the sales and accounts receivable cycle. It is no surprise that accounts affected by transactions in the revenue cycle were presented in fraudulent financial reports because revenue recognition and measurements and the use of accounting estimates are among the most difficult auditing issues. These financial parameters were measured as percentage changes in respective to financial ratios and account balances between the year the fraud was first committed and the preceding year.
Table 1. ANN Categorized Input Parameters Part 1
Profitability measuring ratios
No Variable Name
1
Gross profit ratio = (gross profit/net sales) 2
operating profit margin = operating income/ net sales 3
Return on invested capital = net profit / invested capital
Liquidity measuring ratios
No Variable Name
1 Quick ratio = (current assets – inventory)/ current liabilities
2
Working capital to total assets ratio 3
Current ratio = current assets/ current liabilities 4
cash to total assets ratio 5
Receivables to current assets ratio 6
Current assets / total assets ratio
Table 2. ANN Categorized Input Parameters Part 2
Debt ratio
No Variable Name
1 financial leverage = total debts / Shareholders Equity
Assets utilization ratios
No Variable Name
1
Assets turnover ratio = net sales/ total assets 2
Inventory to invested capital ratio 3
Net profit to total assets ratio 4
inventory to sales ratio
5 Invested capital turnover ratio = sales / invested capital
6 Accounts receivable turnover ratio = net credit sales / average accounts receivable
7 Inventory to current assets ratio
Table 3. ANN Output Parameters
No Variable Name
1 Allowance for doubtful as percentage of accounts receivable
2 Allowance for doubtful as percentage of net sales 3
Ratio of gross margin to net sales. 4
Net sales. 5
Accounts receivable 6
Allowance for doubtful accounts 7
Accounts receivable as percentage of total assets 8
Accounts receivable as percentage Net sales
2.3
The Proposed ANN Model Learning
and Testing Phases
[image:3.595.47.288.449.725.2]their output, BackAxon function must calculate gradient information for all adaptive weights. Second, they must derive the relative error at their input to be back propagated to any components which precedes them. The general learning equation used in the proposed model is as follows:
∆𝑤𝑖𝑗 𝑘 = 𝛾∆𝑤𝑖𝑗 𝑘 − 1 − 𝜇𝛻𝑤𝑖𝑗𝐸 𝑘
(3)
where γ is a constant (normally set between 0.5 and 0.9), and μ is the learning rate, and E(k) is the error (the difference between the desired response and the actual system response) at iteration step k. A momentum value used in this model in the hidden layers, and the output layer = 0.7.
The learning process of the proposed ANN model will be terminated based on two conditions:
- Mean Square Error (MSE) with threshold = 0.01 Where the Mean Square Error is defined as:
𝑀𝑆𝐸 = 1
𝑛 (𝑦𝑖− 𝑦𝑑𝑖) 𝑛
𝑖=1 2 (4)
where n is the number of PEs, yi is the predicted value
obtained from the neural network model, ydi is the actual
value.
- Cross validation
Also maximum epochs (iterations) = 1000 is specified and is applied if other termination conditions are not matched. Network testing is completely similar to the learning process, but the network at this phase do not adjust their weights. Only the processes of summation, transfer and comparing the output produced by the network with the target output are performed in this phase. Testing data set contain a set of inputs and outputs associated with each input. If the network was able to pass and give the correct answers, the Learning of the network is successful, and the network is ready for use. The neural network give us the result in the form of prediction using the input data to detect if there is fraud in the financial reporting or not.
3.
MODEL IMPLEMENTATION AND
RESULTS DISCUSSION
For implementing the proposed model, an ANN software called NeuroSolutions was used which is considered one of the leading software available for implementing neural networks. The proposed model was applied on the financial reporting of two large Egyptian companies for electricity distribution which are the North Delta Electricity Distribution company, and the South Delta Electricity Distribution company. The collected dataset was divided into three data subsets: first data subset (60% of the whole dataset) was used as inputs for the ANN training phase, and second data subset (30% of the dataset) was used as inputs for the ANN validation and testing phase. The last data subset (10% of the dataset) represent the target years that the system will predict for them whether a financial reporting fraud has happened or
not, and this data subset was divided into two sets of parameters: the seventeen input parameters, and the eight output parameters which were used as the actual output values that are going to be compared with the predicted output eight values from the implemented ANN model. If there is a big gap (deviation) between the output parameters actual values and the predicted values, there is a high probability of fraud in the financial reporting, otherwise there is not. In the following two subsections, results of applying the proposed model on the two companies are presented and discussed.
3.1
Case One Experiment
After running the implemented ANN using NeuroSolutions on the data of the first company the North Delta Electricity Distribution company, the result of the training phase is shown in table 4, result of testing phase is presented in table 5, and finally the result of the prediction phase is shown in table 6, and figure 2. Table 4 shows that the max number of iterations for training and cross validation was 1000. The assessment and measurement of the proposed back propagation based ANN is done with the minimum and final mean square error (MSE) during training and validation phases. The value of the final mean square error MSE for the training phase in the output is 0.00017, and the value of mean square error MSE for the cross validation in the output is 0.2574.
Table 4. Result of training phase for case one
Best Networks Training
Cross Validation
Epoch # 1000 1000
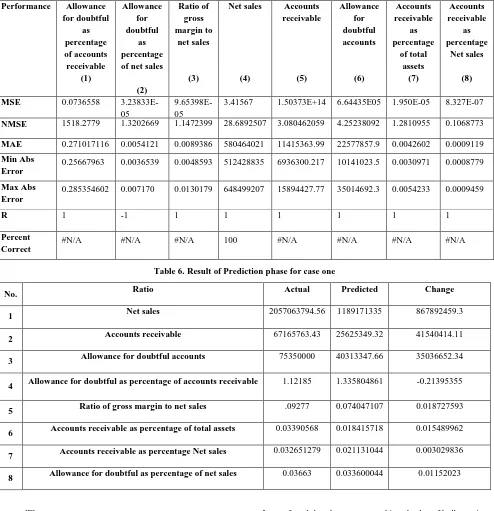
Table 5. Result of testing phase for case one
Performance Allowance for doubtful
as percentage of accounts receivable
(1)
Allowance for doubtful
as percentage of net sales
(2)
Ratio of gross margin to
net sales
(3)
Net sales
(4)
Accounts receivable
(5)
Allowance for doubtful accounts
(6)
Accounts receivable
as percentage
of total assets
(7)
Accounts receivable
as percentage
Net sales
(8)
MSE 0.0736558
3.23833E-05
9.65398E-05
3.41567 1.50373E+14 6.64435E05 1.950E-05 8.327E-07
NMSE 1518.2779 1.3202669 1.1472399 28.6892507 3.080462059 4.25238092 1.2810955 0.1068773
MAE 0.271017116 0.0054121 0.0089386 580464021 11415363.99 22577857.9 0.0042602 0.0009119
Min Abs Error
0.25667963 0.0036539 0.0048593 512428835 6936300.217 10141023.5 0.0030971 0.0008779
Max Abs Error
0.285354602 0.007170 0.0130179 648499207 15894427.77 35014692.3 0.0054233 0.0009459
R 1 -1 1 1 1 1 1 1
Percent Correct
[image:5.595.53.547.88.599.2]#N/A #N/A #N/A 100 #N/A #N/A #N/A #N/A
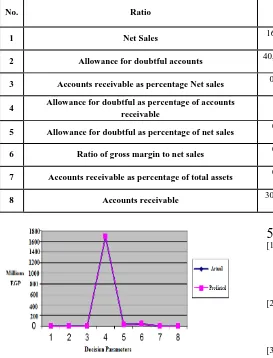
Table 6. Result of Prediction phase for case one
No. Ratio Actual Predicted Change
1 Net sales 2057063794.56 1189171335 867892459.3
2 Accounts receivable 67165763.43 25625349.32 41540414.11
3 Allowance for doubtful accounts 75350000 40313347.66 35036652.34
4 Allowance for doubtful as percentage of accounts receivable 1.12185 1.335804861 -0.21395355
5 Ratio of gross margin to net sales .09277 0.074047107 0.018727593
6 Accounts receivable as percentage of total assets 0.03390568 0.018415718 0.015489962
7 Accounts receivable as percentage Net sales 0.032651279 0.021131044 0.003029836
8 Allowance for doubtful as percentage of net sales 0.03663 0.033600044 0.01152023
Fig 2: Relationship between the predicted and actual values for case one
debts from other people; in this case the debts are called bad debts. The company should take into consideration at the end of the next financial Cycle that there is Allowance for doubtful accounts will be collected. The increase in this account has an effect on the achieved revenue in Income statement and cash flow statement.
The gap between the values of allowance for doubtful accounts (the difference between actual and predicted) may be caused by fraudulent reporting by increasing allowance for doubtful accounts to increase expenses and this will decrease the revenue of the period as a result. This gap may be also resulted from the probability that the used input data subset in training phase will lead to more efficient training if they covered the financial statements of more years. As a result, if the used input data subset for the training phase covered more number of years, the probability of that the gap in accounts like net sales, and allowance for doubtful accounts between actual values and predicted values by the ANN is caused by fraud in financial reporting is very high.
3.2
Experiment on Case Two
After running the implemented ANN on the data of the second company the South Delta Electricity Distribution company,
[image:6.595.319.540.119.209.2]the result of the training phase is shown in table 7, result of testing phase is presented in table 8, and finally the result of the prediction phase is shown in table 9, and figure 3.
Table 7. Result of training phase for case two
Best Networks Training
Cross Validation
Epoch # 1000 1000
[image:6.595.37.562.358.611.2]Minimum MSE 7.15933E-06 0.91516433 Final MSE 7.15933E-06 0.91516433 Table 7 shows that the max number of iterations for training and cross validation was 1000. The assessment and measurement of the proposed back propagation based ANN is done with the minimum and final mean square error (MSE) during training and validation phases. The value of the final mean square error MSE for the training phase in the output is 7.15933E-06, and the value of mean square error MSE for the cross validation in the output is 0.91516433.
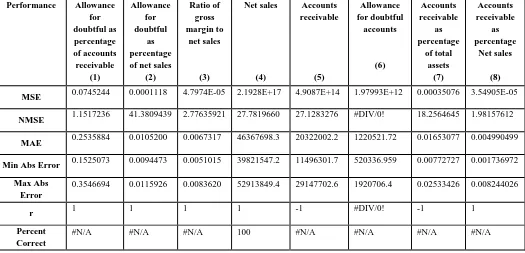
Table 8. Result of testing phase for case two
Performance Allowance
for doubtful as percentage of accounts receivable
(1)
Allowance for doubtful
as percentage of net sales
(2)
Ratio of gross margin to
net sales
(3)
Net sales
(4)
Accounts receivable
(5)
Allowance for doubtful
accounts
(6)
Accounts receivable
as percentage
of total assets
(7)
Accounts receivable
as percentage
Net sales
(8)
MSE 0.0745244 0.0001118 4.7974E-05 2.1928E+17 4.9087E+14 1.97993E+12 0.00035076 3.54905E-05
NMSE 1.1517236 41.3809439 2.77635921 27.7819660 27.1283276 #DIV/0! 18.2564645 1.98157612
MAE 0.2535884 0.0105200 0.0067317 46367698.3 20322002.2 1220521.72 0.01653077 0.004990499
Min Abs Error 0.1525073 0.0094473 0.0051015 39821547.2 11496301.7 520336.959 0.00772727 0.001736972
Max Abs Error
0.3546694 0.0115926 0.0083620 52913849.4 29147702.6 1920706.4 0.02533426 0.008244026
r 1 1 1 1 -1 #DIV/0! -1 1
Percent Correct
#N/A #N/A #N/A 100 #N/A #N/A #N/A #N/A
From the presented results of prediction phase in table 9, and figure 3, the gap that was found between the actual values and the predicted values by the implemented ANN model is so small for the South Delta Electricity Distribution company, and this means that the company had succeeded to achieve the
Table 9. Result of Prediction phase for case two
No. Ratio Actual Predicted Change
1 Net Sales 1697718436 1696889347.49565 829088.50435
2 Allowance for doubtful accounts 40,000,000.00 39970315.45 29,684.55
3 Accounts receivable as percentage Net sales 0.0177478 0.0188637 -0.00111589
4 Allowance for doubtful as percentage of accounts receivable
1.327539 1.33005 -0.00251
5 Allowance for doubtful as percentage of net sales 0.023561 0.02753 -0.00397
6 Ratio of gross margin to net sales 0.067444 0.07392 -0.00648
7 Accounts receivable as percentage of total assets 0.020063 0.0272154 -0.00715236
8 Accounts receivable 30130927.36 30223983.85 -93056.4921
Fig 3: Relationship between the estimated and actual values for case two
4.
CONCLUSIONS
The purpose of this research was to develop a Multilayer Perceptron (MLP) Artificial Neural Network model that is capable of detecting and predicting the risk of fraudulent financial reporting. The proposed model used the Tanhaxon as a nonlinear activation function to provide the network the ability to make soft decisions, and the Momentum learning rule due its simplicity and efficiency with respect to the standard gradient. It is proven in this work that the proposed back propagation based artificial neural networks model can be used in the discovery of manipulation and fraud prediction in the accounts balances by comparing the predicted values and the actual values. In addition, it is proven that the proposed ANN based model can be used in exploring the advances that are implemented in certain accounts balances if the probability of fraud is excluded, and this will support the auditors and companies' top managers in doing financial performance assessment. It is recommended to take advantage of the artificial neural networks - as one of the important techniques of machine learning – with other intelligent techniques to build hybrid models that can be used effectively in the analysis and treatment of various accounting problems, especially those related to financial fraud and financial performance appraisal.
5.
REFERENCES
[1] Beasley, M. S., Carcello, J. V., Hermanson, D. R. and Lapidos, P. D. 2000 Fraudlent Financial Reporting: Consideration of Industry Traits and Corporate Goverance Mechanisms. Accountig Horizons. Vol.14. No. 4, 441-454.
[2] Bemardi, R.A. 1994 Fraud Detection : The effect of Client integrity and competence and Auditor Cognitive Style. Auditing:Journal of Practice & Theory. Vol. 13, 68-94.
[3] Eining, M. M., Jones, D.R. and Loebbecke, J. K. 1997 Reliance on decision aids : An examination of Auditors Assessment of management Fraud. Auditing:Journal of Practice & Theory. 16(2), 1-18.
[4] Kaminski, K.A., Wetzel, T.S., and Guan, L. 2004 Can financial ratios detect fraudulent financial reporting?. Managerial Auditing Journal. 19 (1), 15-28.
[5] Siegel, P.H., Omar, K., Korvin, A. 1998 Applications of Fuzzy sets and the Theory of Evidence to Accounting. JAI Press Inc., London England.
[6] Khormuji, M. K., Bazrafkan, M., Sharifian, M. 2014 Credit Card Fraud Detection with a Cascade Artificial Neural Network and Imperialist Competitive Algorithm. International Journal of Computer Applications. Vol. 96. No. 25, 1-9.
[7] Green, B.P., and Choi, J.H. 1997 Assessing the risk of management fraud through neural network technology. Auditing: Journal of Practice & Theory. 16 (1), 14-28. [8] Bell, T.B., and Carcello, J.V. 2000 A decision aid for
assessing the likelihood of fraudulent financial reporting. Auditing: Journal of Practice & Theory. 19 (1), 169-184. [9] Lin, J.W., Hwang, M.I., and Becker, J.D. 2003 A fuzzy
neural network for assessing the risk of fraudulent financial reporting. Managerial Auditing Journal. 18 (8), 657-665.
Networks : two case studies in Greece. Artificial Neural Networks- ICANN 2006. Vol. 4132, 672-681.
[11]Kirkos S., Spathis, C. and Manolopoulos, Y. 2007 Data Mining techniques for the detection of fraudulent financial statements. Expert Systems with Applications. Vol. 32. Issue 4, 995-1003.
[12]Nonyelum, O.F. and Chibueze, I.H. 2009 Credit Card Fraud Detection using Artificial Neural Networks with a Rule–Based Component. The ICFAI University. Journal of science & Technology. Vol. 5. No.1, 40-47.
[13]Chen, H,J., Huang, S, Y., and Kuo, C, L. 2009 Using the Artificial Neural Network to predict Fraud Litigation: Some empirical evidence from emerging Markets. Department of accounting National Chung Hsing University. Taichung. Taiwan ,KPMG CPA Firms. Tainan. Taiwan, Science Direct. pp 1478:1484.