Hyperspectral Remote Sensing For Agricultural
Management: A Survey
B. D. Jadhav
Ph.D Research Scholar,
Department of Electronics and Telecommunication Sinhagad College of Engineering,
Pune-411041, India.
P. M. Patil
Department of Electronics and Telecommunication RMD Sinhagad Technical Campus,
Warje,Pune-411058, India.
ABSTRACT
Hyperspectral sensors are devices that acquire images with narrow bands (less than 20nm) with continuous measurement. It extracts spectral signatures of objects or materials to be observed. Hyperspectral have more than 200 bands. Hyperspectral remote sensing has been used over a wide range of applications, such as agriculture, forestry, geology, ecological monitoring, atmospheric compositions and disaster monitoring. This review details concept of hyperspectral remote sensing; processing of hyperspectral data. It also focuses on the application of hyperspectral imagery in agricultural development. For example, hyperspectral image processing is used in the monitoring of plant diseases, insect pests and invasive plant species; the estimation of crop yield; and the fine classification of crop distributions.
Keywords
Hyperspectral, Multispectral, Remote sensing, Spectrometer
1.
INTRODUCTION
Due to the successful launch and deployment of various satellites, satellite systems have been used for various applications. The various applications include surveillance systems, navigation, communication, remote sensing and earth observation systems. Further, the various applications related to remote sensing are meteorology, agriculture, mining, geology, mapping, city planning, ecological monitoring and disaster monitoring. The applications in remote sensing can also be increased with the development of various sensors. In order to improve the resolution in remote sensing various sensors such as electro-optical visible sensor, thermal imagers, SAR, LIDAR have proposed in the literature. However, due to the improvement number of bands for sensing, hyperspectral imagers have attracted the attention of various researchers. In hyperspectral remote sensing many narrow, contiguous spectral bands have been acquired simultaneously [1].Relatively broad wavelength band images are produced by Multispectral remote sensors such as the Landsat Thematic Mapper and SPOT XS [2]. However Hyperspectral remote sensors, collect image data simultaneously in dozens or hundreds of narrow, adjacent spectral bands. Due to which a continuous spectrum for each image cell is derived. Atmospheric correction, sensor adjustment and terrain effects are applied to the raw image. These image spectra can be compared with field or laboratory reflectance spectra in order to recognize and map surface materials such as particular types of vegetation or diagnostic minerals associated with ore deposits [3].
Typically, hyperspectral sensors capture light in the range of 400 nm – 2500 nm. It covers the visible, NIR and SWIR frequency bands. However multispectral data is acquired over a relatively small number (<10) of broad spectral bands (≈ 100 nm band width), hyperspectral imagers acquire data over the range tens to hundreds narrow (< 20 nm) spectral bands.
Spaceborne systems tend to have a lower spatial resolution (30-150 m) in comparison to their airborne counterparts (35 cm – 4 m) [4].As many applications of hyperspectal imaging are available, however precision agriculture is the one of the important application. Precision agriculture can be broadly defined as the use of observations to optimize the use of resources and management of farming practices [5] [6]. Satellite data acquired with the combination of a GPS and GIS is used to monitor the crops, manage the use of resources, and make decisions on farming practices. The soil characteristics, such as texture, structure, physical character, humidity, and nutrient level can be determined by using this technique. This paper gives the overview of hyperspectral sensors, it also extend the significance of hyperspectral imagers for precision agricultural.
2.
HYPERSPECTRAL SENSORS AND
IMAGE PROCESSING
Hyperspectral images are produced by instruments called imaging spectrometers. Combination of two related but distinct technologies: spectroscopy and the remote imaging of Earth and planetary surfaces have been involved in these imagers. Spectrometer is device (or spectroradiometers) which is measures the light reflected from a test material. An optical dispersing element such as a grating or prism in the spectrometer splits this light into many narrow, adjacent wavelength bands and the energy in each band is measured by a separate detector [1].
2.1
Plant Spectra
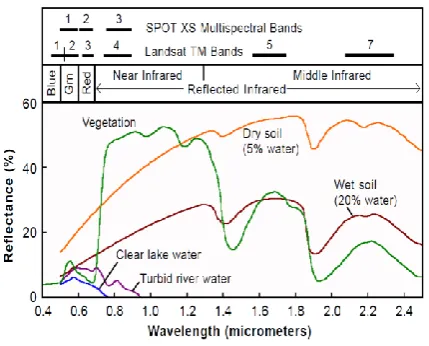
Figure 1.Plant Spectral curve [32]
3.
DATA PROCESSING AND
ANALYZING METHOD
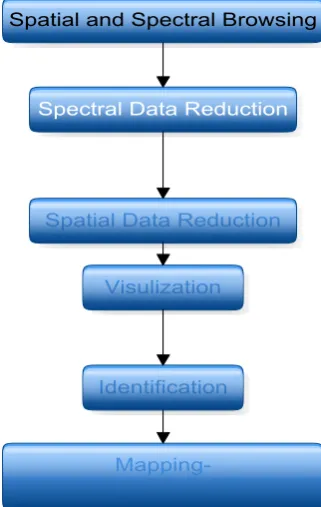
Data processing and analysis method of hyperspectral is different than the Multispectral because these two technologies have different features which is shown in Figure 2 [11]. Steps for the hyperspectral data processing are as given below:
3.1
Radiometric Correction
Hyper spectral remote sensing information may be influenced by external factors such as remote sensor aging, bidirectional reflectance distribution and terrain factors. In the complex urban terrain in natural disaster zones, will weaken the sensitivity of distinguishing terrain by hyper spectral remote sensing data. Therefore, like ordinary RS, hyper spectral remote sensing information needs for radiometric correction to eliminate the influence of these factors. The atmospheric correction can be done using the software such as “ACORN” [33] [34].
3.2
Image Enhancement
Image enhancement technique improves the overall quality of image. Spectral image enhancement technology can enhance the differences between pixels and spectrum. The main purposes of image enhancement are to change the gray scale of images, to improve image contrast, to eliminate the edge and noise, highlight the changes in crop conditions.
3.3
Spectral Reduction and Dimension
Reduction
Hyperspectral has more no. of band; these bands are highly correlated to each others. They captures the redundant data, it increases the data size. General dimension reduction methods are to get low spectral resolution data by convolution operation. The narrow band information of hyper spectral remote sensing images is transformed into the broadband information of conventional remote sensing images by convolution operation to make comparative analysis. Spectral compression, noise suppression, and dimensionality reduction can be done using the MNF transformation [12] [13].
Table 1. Current and Recent Hyperspectral Sensors and Data Providers
Satellite Sensors
Manufact-urer Number of Bands
Spectral Range in µm FTHSI on
MightySat II
Air force
Research Lab
256 0.35 to
1.05
Hyperion on EO-1
NASA Goddard Space Flight Center
220 0.4 to 2.5
Airborne Sensors
Manufact-urer Number of Bands
Spectral Range
AVIRIS NASA Jet
Propulsion Lab
224 0.4 to 2.4
HYDICE Naval Research Lab
210 0.4 to 2.5
PROBE-1 Earth Search Sciences Inc.
128 0.4 to 2.5
CASI ITRES Research Limited
228 0.4 to 1.0
HyMap 00 to 200 Visible to thermal Infrared
Integrated Spectronics
100 to 200
Visible to thermal infrared
AISA Spectral Imaging Up to 288
0.43to 1.0 um
3.4
Determination of End Members
End members are detected using the PPI. Based on MNF higher order bands are selected for further processing.PPI locates the most spectrally extreme (unique or pure) pixels [13].A PPI image is created in which the digital number of each pixel corresponds to the number of times that pixel was recorded as extreme. A histogram of these images shows the distribution of “hits” by the PPI. An adaptive threshold is selected using the histogram which selects only the purest pixels. This method will reduce the number of pixels to be analyzed. These pixels are used as input to an interactive visualization procedure for separation of specific end members.
3.5
Extraction of end member Spectra
End members are extracted using n-dimensional scatter plots [14]. The coordinates of the points in n-space consist of “n” values which gives the spectral reflectance values in each band for a given pixel. The distribution of these points in n-space can be used to estimate the number of spectral end members and their pure spectral signatures. It provides an intuitive means to understand the spectral characteristics of materials.
3.6
Identification of end member spectra
[image:2.595.315.542.95.402.2]3.7
Spectral Information Matching and
Classifications
[image:3.595.85.246.197.451.2]The SAM produces maps of the spectrally predominant minerals and plants for each pixel by comparing the angle between the image spectra and reference spectra in n-dimensional vector space [15]. MTMF is basically a partial linear spectral unmixing procedure [14]. MF based on well-known signal processing methodologies, maximizes the response of a known end member and suppresses the response of the composite unknown background [18][19][20].
Figure 2. Hyperspectral Analysis Scheme
4.
AGRICULTURAL MANAGEMENT
Hyperspectral remote sensing provides information across numerous contiguous spectral bands; however, most applications typically require data from only a select set of frequencies determined according to the absorption and reflection properties of the matter being observed. The spectral absorption characteristics of matter are influenced by a variety of factors relating to structure. The spectral signatures of vegetation in general exhibits several characteristic features, namely, the green peak, the chlorophyll well, the red-edge, the NIR plateau, and water absorption features [7]. Hyperspectral remote sensing has also helped enhance more detailed analysis of crop classification. performed rigorous analysis of hyperspectral sensors (from 400 to 2500 nm) for crop classification based on data mining techniques consisting of PCA , lambda–lambda models, stepwise Discriminate Analysis and derivative greenness vegetation indices. Through these analyses they established 22 optimal bands that best characterize the agricultural crops.
Agricultural applications also benefit from the definition of such indices, which can be used to assess a variety of information about the health of crops or estimation of crop yield. For example, NDVI and SAVI are used for estimation of green LAI using hyperspectral data [8].Precision agriculture is a technique which can highly benefit from hyperspectral remote sensing. In the next sections, the use of hyperspectral imaging in key precision agriculture
requirements, such as the monitoring of plants and pests, the estimation of crop yield, and crop classification is discussed.
4.1
Monitoring Plant Diseases, Insect Pests
and Invasive Plant Species
Early detection of plant diseases and insect infestation is crucial for farmers and agricultural managers who want to reduce economic loss due to these threats. For instance, to detect tree stress caused by the Douglas-fir beetle, Lawrence and Labus [6] examined methods that performed well on multispectral and hyperspectral imagery; namely, stepwise discriminate analysis, classification and regression tree analysis. The Probe-1 sensor was flown aboard a helicopter and data over 128 continuous spectral bands between 0.4 μm and 2.5 μm with a 1 m spatial resolution was collected.
Furthermore, remote sensing techniques have the potential to monitor and detect invasive plant species as well as weeds in agriculture and forest ecosystems. Studies show that invasive plants represent a severe threat to the forest environment and other plant species [21] [22]. For instance, Tamarix (salt cedar) is one of the most threatening invasive species in U.S.A because it increases soil salinity by absorbing limited sources of moisture and water. A resolution and multi-source approach was successfully applied by Wang [22], who used five mosaicked AISA images of 1 m spatial resolution, Quick Bird and Landsat TM data to estimate and classify images according to the abundance of tamarix. However, in work by [21], hyperspectral remote sensing was shown to be a powerful and economical option for learning the spatial distribution tamarisk and other invasive species. More specifically, six Landsat8 ETM+ satellite images collected at differing times during the growing season were used to compute a variety of vegetation indices, whose values changed over time, which were then used in conjunction with the Maximum Entropy Model to detect and map the tamarisk distribution.
4.2
Estimation of Crop Yield
Crop yield estimation is one of the most significant issues for agricultural management, and one of the areas that precision farming techniques can offer the greatest benefit. Remote sensing technologies, together with the use of GPS receivers and GIS, have been shown to be effective in monitoring crop yield, improving land management, and facilitating the implementation of precision farming techniques [22]. In particular, crop yield is strongly related with the electrical conductivity of soil, which determines the soil texture and soil salinity characteristics [23].
Soil nutrient content, Nitrogen (N) concentration, soil properties, water and existence insect pests are some of the key parameters that affect crop yield directly. The total yield of a field can be estimated by building a crop yield estimation model, using information such as weather related factors, soil parameters, diseases, pest insect infestation, and crop properties. With the help of GPS and GIS, this model can map the distribution of different plants.
the Shafter Airborne Multispectral Remote Sensing System, a yield map was produced from yield monitor data to identify those areas of low and high yields. Both sensors showed that 1) remote sensing techniques are powerful tools to predict sugar beet fields, and 2) temporal variations within the fields, such as growth of a crop, could be monitored. The sufficiently frequent acquisition of hyperspectral data is critical for determining the temporal relationship between remote sensing estimates and the actual crop yield. The spectral reflectance of plants indicates the speed of the growing process, and thus aids scientists and farmers in estimating the yield prior to harvesting. Yang [26] evaluated airborne hyperspectral imagery to assess crop variability within a field. Both airborne multispectral and hyperspectral images can be used to determine the spatial patterns in plant growth and yield before harvest. Satellite imagers have a coarser spatial resolution that is sufficient for estimating crop yields over large fields; however, airborne imagers are better for evaluating in-field yield variability due to their finer spatial resolution.
4.3
Classification of Agricultural Crops
Traditionally, mapping the vegetation of an entire field requires time intensive field surveys; however, with remotely sensed data, especially hyperspectral data, the classification and mapping of vegetation can be accomplished with in a more cost-effective manner with more detail in less time [24]. Several studies [30], [27] show that the classification accuracies of agricultural crops acquired from narrowband hyperspectral data are considerably higher than that achieved with multispectral data [4]. To observe changes within the field, data should be gathered before seeding, during planting and harvesting. Data acquisition prior to seeding provides information relating to soil productivity, soil fertility, soil physical properties-texture, density, mechanical strength, moisture content, soil chemical properties organic matter, salinity, soil plant-available water-holding capacity [31].
Mid- season crop monitoring and classification allows farm producers to detect invasive plant species, diseases and insect infestations, which aides in making decisions on herbicide/pesticide application. To maximize the cost-benefit ratio, determining and applying the appropriate pesticide at the right time and right place is crucial for precision agriculture. Thus, hyperspectral remote sensing is a dynamic technique that can evaluate potential problems and provide effective management solutions [30]. Although the processing of hyperspectral data is particularly complex both from a theoretical and computational perspective, hyperspectral sensors are important and powerful instruments for classification problems.
4.4
Estimation of Vegetation Water
Content
Assessment of vegetation water content is critical for monitoring vegetation condition, detecting plant water stress, assessing the risk of forest fires and evaluating water status for irrigation(Yen-Ben Cheng et al.,2006).VWC was measured by calculating wet/dry weight difference per unit of ground area (g/m2) of each plant canopy (n = 95) [28]. Various mono- and multivariate statistical methods are available for estimating VWC from hyper-spectral data [30],[31].Different multivariate statistical methods available are partial least square regression, artificial neural network and principal component regression. Where monovariate technique includes narrow band RWI, NDWI, (SAVI2) and TSAVI. After estimation of both the methods based on cross validation procedure and statistical indicators such as R2,
RMSE and relative RMSE it is highly recommended for use with multi-collinear datasets. Principal component regression exhibited the lowest accuracy among the multivariate models.
4.5
Quantifying Soil Property Variability
Soil electrical conductivity (ECa) and soil fertility levels can be estimate by using hyperspectral imaging. Acquired data were converted to reflectance using chemically-treated reference tarps with eight known reflectance levels. Geometric distortions of the push broom sensor images were corrected with a rubber sheeting transformation. Statistical analyses, including simple correlation, multiple regressions, and PCA were used to relate HSI data and derived Landsat-like bands to field-measured soil properties [29].
5.
CONCLUSION
In this short survey, we have discussed about hyperspectral imaging background, imaging systems, applications in precision agriculture and techniques to process hyperspectral data. Hyperspectral imaging systems enables researchers to obtain information required to perform precision agriculture practices. The overall accuracy of Hyperspectrural imagery is better than the multispectral image processing. However the data the complexity and space complexity for the Hyperspectral image processing is more. Using hyperspectral imagery and GIS land management system the precision agriculture could be implemented in developing countries. As the population is increasing and resources such as water and agricultural land is being limited, hyperspectral precision agriculture becomes an important research area for the future development. This short survey will serve as a starting point for professionals in both agriculture and image processing to understand usage of hyperspectral image processing in agriculture.
6.
ACKNOWLEDGMENTS
The author B.D. Jadhav is working as an Assistant Professor at JSPM’s Rajarshi Shahu College of Engineering, Pune, India. Also we would like to thank the institute authorities for their kind support without which this work could not have been conducted.
7.
ABBREVIATIONS
ACRON Atmospheric Correction
AIS Airborne Imaging Spectrometer
AISA Airborne Imaging Spectrometer
AISA Airborne Imaging Spectroradiometer for Applications
AVIRIS Airborne Visible Infra red Imaging Spectrometer
BLB Bacterial Leaf Bright
BRDF Bidirectional Reflection Distribution Function
CASI Compact Airborne Spectrographic Imager
EPS Environmental Protection System
GIS Geographical Information System
GPS Ground Positioning System
HSI Hyperspectral imaging
HYDICE Hyperspectral Digital Imagery Collection Experiment
LIDAR Light Detection and Ranging
MF Matched filtering
MNF Minimum Noise Fraction
MTMF Mixture-Tuned- Matched Filtering
MR Multiple Regression
NDVI Normalized Difference Vegetation Index
NDWI Normalized Difference Water Index
NIR Near Infrared
PCA Principal Component Analysis
PPI Pixel Purity Index
RMSE Root Mean Square Error
RWI Ratio Water Index
SAR Synthetic Aperture Radar
SAM Spectral Angle Mapper
SAVI Soil Adjusted Vegetation Index
SMLR Stepwise Multiple Linear Regressions
SWIR Short Wave Infrared
VWC Vegetation Water Content
8.
REFERENCES
[1] Goetz J. A. H. F.,G. Vane, J.E. Solomon, B.N. Rock,“Imaging Spectrometry for Earth Remote Sensing”, Science, 1985, vol. 228, pp. 1147-1153.
[2] Charez Jr, P. S. Kwartenz “ Extracting spectral contrast in Landsat Thematic Mapper image data using selective component analysis”, International Journal of Photogrammetric Engineering and Remote sensing, 1989, Vol.55,3 pp 339-348.
[3] Xian –Zhong shi, Mehrooz Aspandia David, “Using Hyperspectral data PLSR modeling to acess acid Sulphate Soil in subsurface”, Journal of Soils and Sediments , Springer, 2014.
[4] Thenkabail P.S., J.G. Lyon, A. Huete, "Hyperspectral Remote Sensing of Vegetation", CRC Press, 2012.
[5] Haboudane, D.; Miller, J. R.; Pattey, E.; Zarco-Tejada, P. J. & Strachan, I. B., “Hyperspectral vegetation indices and novel algorithms for redicting green LAI of crop canopies: Modeling and validation in the context of precision agriculture,” Remote Sensing of Environment, 2004, vol. 90, pp337-352.
[6] Clark, Roger N. ,“Spectroscopy of Rocks and Minerals, and Principles of Spectroscopy”. In Renz, Andrew N. (ed), Remote Sensing for the Earth Sciences: Manual of Remote Sensing (3rd ed.), 1999 . Vol 3. New York: John Wiley & Sons, pp. 3-58.
[7] Zhang N., M. Wang, N. Wang, “Precision agriculture-a worldwide overview”, Computers and Electronics in Agriculture, 2002,vol. 36, pp. 113-132.
[8] Kaufmann H., K. Segl, L. Guanter, S. Hofer, K.-P. Foerster, T. Stuffler, A. Mueller, R. Richter, H. Bach, P. Hostert, C. Chlebek,“Environmental Mapping and Analysis Program (EnMAP) - Recent Advances and
Status”, IEEE Geoscience and Remote Sensing Symposium, IGARSS 2008, vol. 4, pp. 109-112
[9] Ben-Dor, E., Irons, J.R., and Epema, G.F. Soil Reflectance. In Renz, Andrew N. (ed), “Remote Sensing for the Earth Sciences” Manual of Remote Sensing (3rd ed.), Vol 3. New York: John Wiley & Sons, . 1999, pp. 111-188.
[10]Richter R, “Hyperspectral Sensors for Military Applications. In Emerging EO Phenomenology”, Meeting Proceedings RTO-MP-SET-094,2005.
[11]Varshney P. K., M.K. Arora, , “Advanced Image Processing Techniques for Remotely Sensed Hyperspectral Data”, Springer, 2004.
[12]Green, A. A., Berman, M., Switzer, B., and Craig, M. D., “A transformation for ordering multispectral data in terms of image quality with implications for noise removal”, IEEE Transactions on Geoscience and Remote Sensing, 1988, v. 26, no. 1, p. 65 - 74.
[13]Boardman, J. W., Kruse, F. A., and Green, R. O., “Mapping target signatures via partial unmixing of AVIRIS data: in Summaries”, Fifth JPL Airborne Earth Science Workshop, JPL Publication 95-1, v. 1, p. 23-26. Boardman, J. W., 1993, “Automated spectral unmixing of AVIRIS data using convex geometry concepts” in Summaries, Fourth JPL Airborne Geoscience Workshop, JPL Publication 93-26, 1995, v. 1, p. 11 - 14.
[14]Boardman, J. W., “Leveraging the high dimensionality of AVIRIS data for improved sub-pixel target unmixing and rejection of false positives: mixture tuned matched filtering”, in Summaries of the Seventh Annual JPL Airborne Geoscience Workshop, Pasadena, CA, 1998, p. 55
[15]Kruse, F. A., and Lefkoff, A. B., Knowledge-based geologic mapping with imaging spectrometers: Remote Sensing Reviews, Special Issue on NASA Innovative Research Program (IRP) results, 1993, v. 8, p. 3 - 28.
[16]Kruse, F. A., Lefkoff, A. B., and Dietz, J. B., Expert System-Based Mineral Mapping in northern DeathValley, California/Nevada using the Airborne Visible/Infrared Imaging Spectrometer (AVIRIS): Remote Sensing of Environment, Special issue on AVIRIS, May-June 1993, v. 44, p. 309 - 336.
[17]Kruse, F. A., Lefkoff, A. B., Boardman, J. B., Heidebrecht, K. B., Shapiro, A. T., Barloon, P. J., and Goetz, A. F. H., The Spectral Image Processing System (SIPS) - Interactive Visualization and Analysis of Imaging Spectrometer Data: Remote Sensing of Environment, Special issue on AVIRIS, May-June 1993, v. 44, p. 145- 163.
[18]Chen, J. Y., and Reed, I. S., “A detection algorithm for optical targets in clutter”, IEEE Trans. on Aerosp. Electron. Syst., 1987,v. AES-23, no. 1.
[19]Stocker, A. D., Reed, I. S., and Yu, X., “Multidimensional signal processing for electro optical target detection”, Proc, SPIE Int. Soc. Opt. Eng., 1990, v. 1305.
[21]Evangelista P.H., T.J. Stohlgren, J.T. Morisette, S. Kumar, “Mapping Invasive Tamarisk (Tamarix): A Comparison of Single-Scene and Time-Series Analyses of Remotely Sensed Data”, Remote Sensing, 2009, vol. 1, issue 3, pp. 519-533.
[22]Wang L., “Invasive species spread mapping using multi-resolution remote sensing data”, The International Archives of the Photogrammetry, Remote Sensing and Spatial Information Sciences, Vol. XXXVII. Part B2. Beijing 2008
[23]Bajcsy P., P. Groves, “Methodology For Hyperspectral Band Selection”, Photogrammetric Engineering and Remote Sensing, 2004, Vol. 70, no. 7, pp. 793-802.
[24]Govender M, , K. Chetty, H. Bulcock, , “A review of hyperspectral remote sensing and its application in vegetation and water resource studies”, Water SA, 2007,vol. 33.
[25]Gat N., H. Erives, G. J. Fitzgerald, S. R. Kaffka, S. J. Maas, “Estimating sugar beet yield using AVIRIS-derived indices” In Summaries of the 9th JPL Airborne Earth Science Workshop. unpaginated CD. Jet Propulsion Laboratory, Pasadena, 2000.
[26]Yang C., “Airborne Hyperspectral Imagery for Mapping Crop Yield Variability”, Geography Compass. Vol. 3/5, pp. 1717-1731, 2009.
[27]Dalponte M. , M., L. Bruzzone, D. Gianelle, 2009, “The role of spectral resolution and classifier complexity in the
analysis of hyperspectral images of forest areas”, Remote Sensing of Environment, vol. 113, pp. 2345-2355.
[28]Yen-Ben Cheng et al., “Estimating vegetation water content with hyperspectral data for different canopy scenarios Relationships between AVIRIS and MODIS indexes”, Remote sensing environment, 2006, vol.105, pp.354-366.
[29]Naveen J.P. Anne et al., “Modeling soil parameters using hyperspectral image reflectance in subtropical coastal wetlands” International Journal of Applied Earth Observation and Geoinformation, 2014, pp. 47-56.
[30]Bannari A., A. Pacheco, K. Staenz, H. McNairn, K. Omari, “Estimating and mapping crop residues cover on agricultural lands using hyperspectral and IKONOS data,” Remote Sensing of Environment, 2006, vol. 104, 447-459.
[31]Zhang N., M. Wang, N. Wang, “Precision agriculture-a worldwide overview”, Computers and Electronics in Agriculture, 2002, vol. 36, pp. 113-132
[32]http://speclab.cr.usgs.gov/spectral-lib.htmlAccess date: 25.03.2013.
[33]Atmospheric CoRection (ACRON)
http://www.aigllc.com/pdf/acorn4_ume.pdf,Accces date:25/3/13.