International Journal of Emerging Technology and Advanced Engineering
Website: www.ijetae.com (ISSN 2250-2459,ISO 9001:2008 Certified Journal, Volume 5, Issue 8, August 2015)
40
Design and Analysis of Flexible Pavement: A Case of Kochi
Port Area
Saladi SV Subbarao
1, Akhil
2, Tarak
31Associate Professor, SMBS, VIT University, Vellore – 632014 2,3Student, SMBS, VIT University, Vellore – 632014 Abstract— Design of flexible pavement depends on the
strength of subgrade soil (CBR value) and the design traffic in terms of cumulative number of standard axles. The ongoing Kochi Metro Rail project has created an onslaught of traffic related worries for the general population living in Kochi. It has redirected some of the major portions of traffic coming into the city through the Vallarpadam Port Road. A thorough analysis of the existing pavement is greatly required at this point of time, as an excessive amount of vehicle loads is passing through the project site and it is unknown whether or not the road pavement might sustain its structural integrity.
Keywords— Flexible pavement, Traffic growth, Kochi port, Design, Overlay thickness
I. INTRODUCTION
Pavement is the actual travel surface especially made durable and serviceable to withstand the traffic load commuting upon it. Pavement grants friction for the vehicles thus providing comfort to the driver and transfers the traffic load from the upper surface to the natural soil. All hard road pavements usually fall into two broad categories namely: Flexible and rigid pavements. The government is increasingly shifting its focus from constructing new highways to rehabilitating and reconstructing existing facilities. Since highway rehabilitation projects often cause congestion, safety problems, and limited access for road users, the government faces a challenge in finding economical ways to rehabilitate deteriorating roadways in metropolitan areas while keeping the travelling public as safe as possible and minimizing disruptions for local communities and surrounding businesses.
The area selected for this study was the Vallarpadam Port Road, which is a part of the International Container Transhipment Terminal (ICTT), Kochi. This is one of the largest container transhipment facilities in India. The on-going Kochi Metro Rail Project has redirected huge section of traffic from the city towards the bypass roads which leads to the port area, through which the city could be accessed.
This has caused lot of strain on the port roads through which not just container trucks but now commercial vehicles also pass through, thus worsening the existing conditions of the facility and there is a need for examining the performance of the facility. Also, an influx of traffic from the city and away from it passes through the relatively less reinforced road pavement which may lead to its steady deterioration. If a thorough analysis is not done and suitable rehabilitation measures aren’t provided, there shall be increased frequency of vehicular related accidents and other undesirable effects. Keeping these issues in mind, the aim of this study is to analyze the capacity of existing carriageway and also the design methodology adopted for the strengthening and rehabilitation of the same.
II. BACKGROUND AND METHODOLOGY
Initial cost is generally the major factor in deciding the type of the pavement in design. It is often considered that flexible pavements are cheaper than the rigid pavements. In fact this is not always the case. In the last decade the price of bitumen, the main ingredient of flexible pavement, has increased because of the increase in crude oil prices.
Goliya et. al. (2013) suggested that flexible pavements are preferred over cement concrete roads as they have a great advantage that these can be strengthened and improved in stages with the growth of traffic and also their surfaces can be milled and recycled for rehabilitation. Bruhaspathi (2012) says that if non-conventional pavement design is adopted in the construction of pavement, there will be improved performance of the pavements thus increasing the life and leading to financial savings. Nantung et. al. (2008) suggested that the traffic data includes average annual daily traffic, average monthly and hourly traffic, adjustment factors, axle load spectra, and axle weight and spacing values. Various steps involved in the present study are:
1.Axle load survey which involves survey of types and number of vehicles entering the port road.
International Journal of Emerging Technology and Advanced Engineering
Website: www.ijetae.com (ISSN 2250-2459,ISO 9001:2008 Certified Journal, Volume 5, Issue 8, August 2015)
41
3. Design of flexible pavement according to IRC 37: 2001.
4. Forecasting the traffic data and design of flexible pavement for the horizon year.
5. Analyzing the existing pavement and checking its suitability for the horizon year.
6. Design of overlay thickness.
III. DESCRIPTION OF STUDY AREA
Road Owner National Highway Authority of India
Road Length 17.10 km
No of lanes: 4 lanes (Divided with centered verge)
Road Width 7.25m on each side
Right of way Island portion 0 to 8.4km - 45m, Change over portion 8.4 to 8.5km -45m to 60m, Land portion- 8.5km to 17.10km- 60m
Availability of Shoulder
1.5m paved on each side and 1m kutcha gravel
Material of Construction
Gravel, sand, aggregate, borrow material, bitumen, high yield strength steel, cement
Availability of Storm water drain
For the portion running parallel to Bolgatty island and on the periphery of Mullanpillay island, drain has been proposed on land side. It will capture water from road and will drain into bay through various culverts shown on the plan. Similar arrangements have been provided in the Kothadu Island. The section of the drain trapezoidal as shown in the drawing. It will have a brick pitching on side and bottom.
• For the portion passing through built-up area, drain has been provided on both sides. The section of the drain is same as indicated above. This will also drain into the bay through various culverts as shown in drawing.
• For the portion from NH-17 to chainage Km 2.70, drain has also been provided on both sides, which will be drained into the
branch of periyar river through various culverts
• The drainage plan chainage 0 to 270 will drain into the branch of pariyar river at chainage 0.38.
Road Lighting facility
Provided with the help of panchayath authorities
Availability of Bus shelter
Provided at suitable intervals considering the habitat area
Availability of Parking bay
Separate parking bays were provided for container lorries
Other Amenities
Service roads with foot paths provided in habitat area
Road safety measures such as road marking, traffic sign boards, crash barriers, etc are provided.
IV. DESIGN APPROACH AND DETAILS
The pavement designs are given for subgrade CBR values ranging from 2% to 10% and design traffic ranging from 1 msa to 150 msa for an average annual pavement temperature of 35 degree Celsius. Using the following input parameters, appropriate designs were chosen for the given traffic and soil strength: 1.) Design traffic in terms of cumulative number of standard axles; and2.) California Bearing Ratio value of subgrade.
A. Design Traffic
International Journal of Emerging Technology and Advanced Engineering
Website: www.ijetae.com (ISSN 2250-2459,ISO 9001:2008 Certified Journal, Volume 5, Issue 8, August 2015)
42
1. Initial traffic in terms of CVPD:Initial traffic is determined in terms of commercial vehicles per day (CVPD). For the structural design of the pavement only commercial vehicles are considered assuming laden weight of three tons or more and their axle loading will be considered. Estimate of the initial daily average traffic flow for any road should normally be based on 7-day 24-hour classified traffic counts.
2. Traffic growth rate during the design life: Traffic growth rates can be estimated (i) by studying the past trends of traffic growth, and (ii) by establishing econometric models. If adequate data is not available, it is recommended that an average annual growth rate of 7.5 percent may be adopted.
3. Design life in number of years: For the purpose of the pavement design, the design life is designed in terms of the cumulative number of standard axles that can be carried before strengthening of the pavement is necessary. It is recommended that pavements for arterial roads like NH, SH should be designed for a life of 15 years, EH and urban roads for 20 years and other categories of roads for 10 to 15 years.
4. Vehicle damage factor (VDF): The vehicle damage factor (VDF) is a multiplier for converting the number of commercial vehicles of different axle loads and axle configurations to the number of standard axle-load repetitions. It is defined as equivalent number of standard axles per commercial vehicle. The VDF varies with the axle configuration, axle loading, terrain, type of road, and from region to region. The axle load equivalency factors are used to convert different axle load repetitions into equivalent standard axle load repetitions. For these equivalency factors refer IRC 37: 2001. The exact VDF values are arrived after extensive field surveys.
5. Distribution of commercial traffic over the carriage way:
A realistic assessment of distribution of commercial traffic by direction and by lane is necessary as it directly affects the total equivalent standard axle load application used in the design. Until reliable data is available, the following distribution may be assumed.
i. Single lane roads: Traffic tends to be more channelized on single roads than two lane roads and to allow for this concentration of wheel load repetitions, the design should be based on total number of commercial vehicles in both directions.
ii. Two-lane single carriageway roads: The design should be based on 75 % of the commercial vehiclesin both directions.
iii. Four-lane single carriageway roads: The design should be based on 40 % of the total number ofcommercial vehicles in both directions.
iv. Dual carriageway roads: For the design of dual two-lane carriageway roads should be based on 75 % ofthe number of commercial vehicles in each direction. For dual three-lane carriageway and dual four-lanecarriageway the distribution factor will be 60 % and 45 % respectively.
B. Subgrade Strength Evaluation
California Bearing Ratio (CBR) is the ratio of force per unit area required to penetrate a soil mass with standard circular piston at the rate of 1.25 mm/min. to that required for the corresponding penetration of a standard material. This test is a penetration test meant for the evaluation of subgrade strength of roads and pavements. The results obtained by these tests are used with the empirical curves to determine the thickness of pavement and its component layers. This is the most widely used method for the design of flexible pavement.
C.B.R. = Test load/Standard load * 100
The following table gives the standard loads adopted for different penetrations for the standard material with a C.B.R. value of 100%.
TABLE 1 STANDARD LOAD VALUES
Penetration of plunger (mm)
Standard load (kg)
2.5
5.0
7.5
10.0
12.5
1370
2055
2630
3180
3600
International Journal of Emerging Technology and Advanced Engineering
Website: www.ijetae.com (ISSN 2250-2459,ISO 9001:2008 Certified Journal, Volume 5, Issue 8, August 2015)
43
This test method covers the determination of the California Bearing Ratio (CBR) of pavement subgrade, sub-base, and base course materials from laboratory compacted specimens. The test method is primarily intended for, but not limited to, evaluating the strength of materials having maximum particle size less than 3/4 in. (19
mm).A large experience database has been developed using this test method for materials for which the gradation has been modified, and satisfactory design methods are in use based on the results of tests using this procedure. Past practice has shown that CBR results for those materials having substantial percentages of particles retained on the 4.75 mm sieve are more variable than for finer materials. Consequently, more trials may be required for these materials to establish a reliable CBR.
The C.B.R. values are usually calculated for penetration of 2.5 mm and 5 mm. Generally the C.B.R. value at 2.5 mm will be greater that at 5 mm and in such a case/the former shall be taken as C.B.R. for design purpose. If C.B.R. for 5 mm exceeds that for 2.5 mm, the test should be repeated. If identical results follow, the C.B.R. corresponding to 5 mm penetration should be taken for design.
C. Projection of normal traffic based on elasticity of transport demand
In this method the passenger vehicle and goods vehicles were separately treated. For deriving the growth rates of passenger vehicles, population growth and real per capita income growth were used as parameters. In the case of goods vehicles, the growth rate was considered to be dependent upon the growth in agriculture, industrial, mining and trade and commerce sectors. From the point of view of the study, even though Ernakulam district was considered as the immediate influence area, it should be borne in mind that interactions exist among all districts of the state as well as other states. The passenger traffic on the project road was mainly confined to Ernakulam district while the inter-state goods traffic was found to have maximum interaction with the neighboring states of Tamil Nadu and Karnataka.
The state level data is moderated to reflect conditions in the road influence area by comparison with district-wise factors, there by accounting for the impact of the following:
Macro-economic scenario growth rates and composition of NSDP; Road influence area economy, sectoral production and potential; Spatial distribution of economic activities along the corridor; Road influence area, population size and urbanization; Reduction in truck overloading and changes in trucking fleet; Increase in vehicle productivity due to improved road condition; Shift in personalized travel modes over time; and Changes in the inter-modal share of passenger and freight demand. The above mentioned factors are utilized to generate the
transport demand elasticity coefficients presented in Table 2.
TABLE 2
TRANSPORT DEMAND ELASTICITY COEFFICIENT BASED ON NSDP
Mode 2005 2010 2015 2020 2025
Car 1.8 1.7 1.6 1.5 1.4
Buses 1.5 1.4 1.3 1.2 1.2
Trucks 1.6 1.5 1.4 1.1 1.1
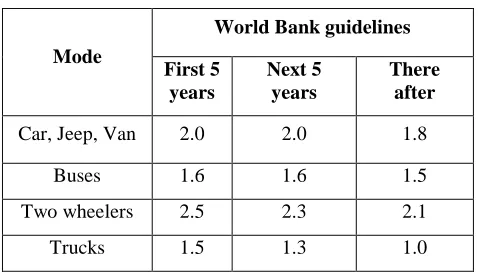
The elasticity coefficients recommended by World Bank are summarized in Table 3.
TABLE 3
TRANSPORT DEMAND ELASTICITY COEFFICIENT
Mode
World Bank guidelines
First 5 years
Next 5 years
There after
Car, Jeep, Van 2.0 2.0 1.8
Buses 1.6 1.6 1.5
Two wheelers 2.5 2.3 2.1
Trucks 1.5 1.3 1.0
[image:4.612.325.564.439.575.2]International Journal of Emerging Technology and Advanced Engineering
Website: www.ijetae.com (ISSN 2250-2459,ISO 9001:2008 Certified Journal, Volume 5, Issue 8, August 2015)
44
However, the growth rate of goods vehicles were calculated by taking weighted average of the growth rates of important sections, such as agriculture, mining, industry and trade and commerce for the neighboring states of Tamil Nadu and Karnataka as well as that of Kerala state, which was found to be 7.225%.
For the calculation of growth rates of passenger vehicles, the projected growth rates of population and per-capita income of Kerala state were used. Based on population growth rates, per-capita income growth rate and also including the elasticity values of transport demand, the growth rates of passenger vehicles for different time intervals were worked out using the formula: Annual Growth Rate of Passenger Traffic :
Where:
P = Annual population growth rate
I = Annual per capita income rate
E = Elasticity coefficient
In the case of goods vehicles the projected growth rates in the four major sections, eg, agricultural, mining, industry and trade and commerce were determined separately for the state as well as the neighboring states. The weighed annual growth rate of the four sectors was calculated for the state and the neighboring states, based on their traffic distributions. Future patterns of change in population, NSDP, primary and secondary sectors of economy, etc., can only be estimated with limited accuracy. Considering the uncertainty associated with these variables, three scenarios related to future socio-economic trends in the form of most probable, pessimistic and optimistic growth rates were adopted for comparisons with the growth rates determined from the analysis of time series traffic volume and vehicle registration data.
The growth rates developed for each of these scenarios are summarized in Table 4.
TABLE 4
PROJECTED TRAFFIC GROWTH RATES (%) BASED ON TRANSPORT DEMAND ELASTICITY
Mode
Years
2005 2010 2015 2020 2025
Cars 7.7 8.1 8.2 6.4 5.7
Buses 6.4 6.6 6.6 5.1 4.9
Trucks 6.8 7.2 7.2 4.7 4.5
Source: Public works department, Government of Kerala (2012)
Based on growth arrived at for each type of vehicles, the future volume of normal traffic for different category of vehicles under this scenario was obtained for all homogenous sections and is presented in Table 5.
TABLE 5
TOTAL NORMAL TRAFFIC AS PROJECTED BY ELASTICITY OF TRANSPORT DEMAND APPROACH
Year Traffic Demand
2015 3964
2020 5071
2025 6322
As noted previously, the elasticity technique takes account of many of the socio-economic factors which influence traffic growth which may serve to reduce the uncertainty of the results.
D. Overlay design
The structural strength of pavement is assessed by measuring surface deflections under a standard axle load. Larger pavement deflections imply weaker pavement and subgrade. The overlay must be thick enough to reduce the deflection to a tolerable amount. Rebound deflections are measured with the help of a Benkelman Beam.
Condition survey and deflection data are used to establish sections of uniform performance. At least 10 deflection measurements should be made for each section per lane subject to a minimum of 20 measurements per km. If the highest or the lowest deflection values for the section differ from the mean by more than one-third of the mean, then extra deflection measurement should be made at 25 m on either side of point where high or low values are observed. Measurement of pavement temperature, field moisture content of subgrade soil and other data like annual rain fall and traffic data are to be collected.
Measurement of pavement temperature, field moisture content of subgrade soil and other data like annual rain fall and traffic data are to be collected. Suitable corrections are to be made like:
International Journal of Emerging Technology and Advanced Engineering
Website: www.ijetae.com (ISSN 2250-2459,ISO 9001:2008 Certified Journal, Volume 5, Issue 8, August 2015)
45
2.Correction for Seasonal Variation: Deflection depends upon the change in the climate. The worst climate (after monsoon season) is considered the best time for design. It also depends on subgrade soil and moisture content as well. Correction for seasonal variation depends on type of soil subgrade (sandy/gravelly or Clayey with PI<15 or Clayey with PI>15), field moisture content, average annual rain fall (<1300 mm or >1300 mm).
V. DATA COLLECTION AND ANALYSIS
A.Axle Load Survey
A survey of the number and types of vehicles passing through the Vallarpadam Port Road for a period of three days was recorded, as a part of the axle load survey. After the traffic data has been collected, Passenger Car Units were developed based on standard load calculations (Chandra, 2000). Data is tabulated in Table 6.
TABLE 6 PASSENGER CAR UNIT
Vehicle Type 2015 2020 2025
Cars 360 490 627
SUV/MUV 292 398 508
Buses 765 981 1234
1-Axle Truck 300 377 466
2-Axle Truck 432 543 670
3-Axle Truck 960 1207 1490
4-Axle Truck 855 1075 1327
Total CVPD 3964 5071 6322
B. Design of Pavement (for the base year)
1.Design Traffic Calculations: The design traffic is considered in terms of cumulative number of standard axles (in the lane carrying max. load) to be carried out during the design life of the road. This is expressed in terms of million standard axles (msa).
The cumulative ESAL (equivalent number of standard axles per commercial vehicles) applications (N) over the design life can be computed using the following formula:
and
where,
A = Traffic in the year of completion of construction CV/ Day
N = Cumulative no. of standard axles
D = lane distribution factor
F = vehicle damage factor.
N = design life of road
r = annual growth
x = no. of year between the last count and year completion of construction
P = no. of commercial vehicle as per last count
From the tabulated data, the number of commercial vehicles per day has been found to be 3964. Consider 5.4% annual growth. A design life of 10 years is recommended for purposes of pavement design for gravel roads for flexible pavements. Lane distribution factor is given as 1 for single lane roads. Vehicle damage factor for an initial traffic of 3964 cvpd on a rolling terrain is given as 4.5
Year of last volume count - 2015
Year of completion – 2019
Now,
A = 3964 x (1+0.054)4 = 4892
International Journal of Emerging Technology and Advanced Engineering
Website: www.ijetae.com (ISSN 2250-2459,ISO 9001:2008 Certified Journal, Volume 5, Issue 8, August 2015)
46
2.CBR Test: Calculations for the CBR Test is tabulated in Table 7.
TABLE 7 CBRREADINGS
S.No Penetration (mm) Dial Gauge Reading
Load (N)
1. 0.0 0 0
2. 0.5 5 51.55
3. 1.0 7 72.17
4. 1.5 10 103.1
5. 2.0 12 123.72
6. 2.5 14 144.34
7. 3.0 17 175.27
8. 4.0 23 237.13
9. 5.0 32.5 335.08
10. 7.5 52.5 541.27
11. 10.0 73 752.63
12. 12.5 96 989.76
Weight of mould + compacted soil = 8.547 kg Weight of mould = 3.802 kg
Weight of compacted soil = 4.745 kg
CBR (2.5 mm) = (Corrected Load at 2.5 mm x 100) ÷ 13.44 = 1.073
CBR (5.0 mm) = (Corrected Load at 5.0 mm x 100) ÷ 20.16 = 1.662
Therefore CBR value = 1.662 ~ 2 %
3. Pavement thickness: Now, the total pavement thickness for CBR 2% and traffic 103 msa from IRC: 37 2001 chart 2 is 956.2 mm. Pavement composition can be obtained by interpolation from Pavement Design Catalogue (IRC37: 2001) :
(a) Bituminous surfacing = 50 mm BC + 195 mm DBM
(b) Road-base = 250 mm WBM
(c) Sub-base = 460 mm granular material of CBR not less than 30 %
C. Design of Pavement (for the horizon Year)
Using the growth rate for the next ten years, the number of vehicles per day on the Vallarpadam Port Road during the year 2025 was projected to be 6322 per day. Using this, we are able to find out the design traffic according to the formula used above. According to the studies, the annual growth is taken as 5.03%. A design life of 10 years is recommended for purposes of pavement design for gravel roads for flexible pavements. Lane distribution factor is given as 1 for single lane roads. Vehicle damage factor for an initial traffic of 6322 cvpd on a rolling terrain is given as 4.5.
N = (365 x [(1+0.0503)10 - 1] x 6322 x 1 x 4.5) ÷ 0.0503 = 130,790,419 = 131msa
Now, the total pavement thickness for CBR 2% and traffic 131msa from IRC: 37 2001 chart 2 is 967.4 mm.
Pavement composition obtained by interpolation from Pavement Design Catalogue (IRC:37 2001) is:
(a) Bituminous surfacing = 50 mm SDBC + 210 mm DBM
(b) Road-base = 250 mm WBM
(c) Sub-base = 460 mm granular material of CBR not less than 30 %
D. Analysis of Existing Pavement
Now that we have the pavement requirements for the year 2025, analysis of the existing thickness and the various layers have been provided. It is found to have a thickness of 940 mm with the different layers to be: a) 40 mm thick Asphaltic Concrete
b) 100 mm thick DBM
c) Two layers of 150 mm thick WMM
d) 500 mm granular material filled of CBR not less than 10%
It is clear from the data that the existing thickness of pavement is lower than the required one and thus, may not remain safe to traverse on. There is a need to design an overlay for smooth and safe travel.
E. Overlay Design
International Journal of Emerging Technology and Advanced Engineering
Website: www.ijetae.com (ISSN 2250-2459,ISO 9001:2008 Certified Journal, Volume 5, Issue 8, August 2015)
47
The thickness obtained from the curves is in terms of Bituminous Macadam construction. If other compositions are to be laid then:
1 mm of Bituminous Macadam = 1.5 mm of WBM/Wet Mix Macadam/BUSG
1 mm of Bituminous Macadam = 0.7 mm of DBM/AC/SDBC
Deflection values:
1.328, 0.765, 1.388, 1.524, 0.858, 1.175, 0.772, 1.421, 0.772, 0.864, 0.528, 1.434, 0.753, 1.357, 1.534, 1.091, 2.156, 1.398, 1.577, 1.812, 1.536, 1.319, 1.056.
Pavement temperature = 25oc
Subgrade moisture content = 12.5%
Average annual rainfall =1500 mm; Mean deflection = 1.315 mm
Standard deviation = 0.429 mm; Characteristic deflection = 1.315 + (2 x 0.429) =2.174 mm
Correction for temperature = 0.01 * (35-25) = 0.1 mm
Characteristic deflection after temperature correction = 2.174 + 0.1 = 2.274 mm
Seasonal correction factor = 1.2%
Corrected characteristic deflection = 1.2 * (2.274) = 2.7288 mm
Design traffic = 131msa
Using design traffic and the characteristic deflection values, we refer the overlay design curves prescribed by IRC to get the thickness of the overlay.
Thickness of overlay in terms of BM from the chart = 260 mm
Thickness of overlay in terms of DBM/AC = 260 * 0.7 = 182 mm ~ 185 mm
Provide an overlay of 185 mm thickness with 55 mm AC and 130 mm DBM as its composition.
VI. SUMMARY AND CONCLUSIONS
The redirection of traffic through the port road has resulted in its own deterioration as not just commercial vehicles but heavily loaded trucks and containers too, commute through this route on an hourly basis.
Thorough analysis of the existing pavement is necessary to understand the existing conditions and estimate the futuristic scenario to maintain sustainability of the road pavement and safe travel. Keeping this in view, the study started with the axle load survey on existing pavement and design of pavement for the existing traffic. Further, the design traffic is projected for the horizon year using the available growth rates in the study area and identified the required pavement thickness for the horizon year. From this analysis, it was identified that the existing pavement thickness is insufficient for taking the traffic loads coming on to the pavement in horizon year. Hence in the next step, the existing pavement is designed for the overlay and identified the additional thickness required for the horizon year. Thus, the road pavement in the Kochi port area can be deemed safe and sustainable, once these rehabilitation measures are adopted.
REFERENCES
[1] Analysis and design of flexible pavements, Indian Road Congress, Code 37, 2001
[2] Bruhaspathi, KVRDN and NarasingaRao, BND. 2012. ―Pavement
Design of National Highway A Case Study on Reducing Pavement Thickness‖, International Journal of Engineering Research and Applications, Vol. 2, Issue 4, pp.1000-1003
[3] Chandra, S. and Sikdar, P.K. 2000. ―Factors Affecting PCU in
Mixed Traffic Situations in Urban Roads‖, Road Transport Research, Vol. 9, No. 3, Australian Road Research Board, pp. 40-50.
[4] Highway Capacity Manual. 2000. Transportation Research Board,
Special Report 209, fourth edition, Washington D.C.
[5] Methods of Test for Soils: Part 9 - Determination of Dry Density-Moisture Content Relation by Constant Mass of Soil Method, Indian standard code 2720.8, 1983.
[6] Methods of Test for Soils: Part 16 – Laboratory Determination of CBR, Indian standard code 2720.16,1987.
[7] A report on flexible pavement design, Public works department,
Government of Kerala, 2012.
[8] Rafiqul A. Tarefder, NayanSaha, Jerome W. Hall, and Percy, T.
2008. ―Evaluating weak subgrade for pavement design and performance prediction‖. Journal of Geo-Engineering, Vol. 3, No. 1. [9] Sarna, A.C., Jain, P.K. and Chandra, G. 1989. ―Capacity of Urban
Roads - A Case Study of Delhi and Bombay‖. Highway Research Bulletin, No. 4, Indian Roads Congress, New Delhi.
[10] Saurabh Jain, Joshi, Y.P. and Goliya, S. S. 2013. ―Design of Rigid and Flexible Pavements by Various Methods & Their Cost Analysis of Each Method‖. Int. Journal of Engineering Research and Applications, Vol. 3, Issue 5.
[11] Yagar, S. and Aerde, M.V. 1983. ―Geometric and Environmental