International Journal of Emerging Technology and Advanced Engineering
Website: www.ijetae.com (ISSN 2250-2459, ISO 9001:2008 Certified Journal, Volume 7, Issue 7, July 2017)
Proposed Tools and Techniques of Parallel Analytics of Big
Data in the Cloud Environment
Mahboob Alam
1, Mohammad Amjad
21,2Department of Computer Engineering Jamia Milia Islamia, New Delhi-110025, India Abstract-- Big data analytics can provide valuable vision
that will provide competitive advantage, give rise to new innovations, and provide increased return. We live in the data age as data storage devices, hardware and software, have evolved to a point at which it is very less in price to store voluminous data, both structured as well as unstructured. The increased popularity of social media has contributed to the buildup of large data volumes, mostly unstructured, which analyzed could yield valuable return. This paper gives an insight of how we can analysis of big data using cloud side by side. To retrieve meaningful, useful and accurate information on time from such big data sets is a daunting task that requires a careful selection of the right hardware, software and data model.
Keywords: Big data, Hadoop, Distributed, MapReduce, analytics, big data platforms, Large Dataset, Parallel, Storage, Cluster, Cloud.
I. INTRODUCTION
Big Data has given rise to major changes in traditional data analysis platforms which used to be relational only. To perform analysis on this big and complex data, hardware scaling including platforms becomes possible and choosing the right hardware as well as software platforms becomes an remarkable decision. Researchers have been working on building novel data analysis approaches for big data which has led to the continuous development algorithms of data mining . There are several big data platforms available with their properties and selecting the right platform requires a good understanding of the capabilities of all platforms [1]. The ability of the platform to adapt to enhance data processing demands plays a major role in deciding if it is proper to build the analytics based solutions on a particular platform. To provide a thorough understanding of all the famous big data approaches that are using these days and it also show the possitive and negative effect of them.
Hard disk drives were come to use in 1956, as data storage for an IBM real-time system and were developed for use with general-purpose mainframe and minicomputers. So the changes in hard disk drive are very high in every aspect like size, capacity and price.
We have much improvement in the characteristics of a hard disk drive over the time.
Improvement of HDD characteristics over time:
Parameter Started with (1956) Developed to (2017) Improveme nt Capacity (formatte d) 3.75 megabyte s 12 terabyte s 3.2-million-to-one Physical volume
68 cubic feet (1.9 m3)
2.1 cubic
inches (34 cm3)
56,000-to-one
Weight 2,000 pounds
(910 kg)
2.2 ounces (62 g) 15,000-to-one Average access time approx. 600 millisecon ds
2.5 ms to 10 ms; RW RAM dependant
about 200-to-one
Price US$9,200 per
megabyte (1961) US$0.032 per gigabyte by 2015 300-million-to-one Data density
2,000 bits per square inch
1.3 terabits per square
inch in
2015
650-million-to-one
Average lifespan
~2000 hrs
MTBF
~22500 hrs MTBF
International Journal of Emerging Technology and Advanced Engineering
[image:2.612.376.538.367.666.2]Website: www.ijetae.com (ISSN 2250-2459, ISO 9001:2008 Certified Journal, Volume 7, Issue 7, July 2017)
II.
BIG DATAFigure 1. 5V of big data
It can change our world completely and is not going to fade away with time. To recognize the concept of big data, it is often described using five Vs: Volume, Velocity, Variety, Veracity and Value.
III. CLOUD SERVICE TYPES
The basic cloud service for analytics include three things:
3.1 Infrastructure as a Service (IaaS)
It is used when third-party provider hosts software, hardware, servers, storage space and other infrastructure resources on behalf of its users.
3.2 Platform as a Service (PaaS)
When Cloud deploy the operating system which can be used as and when required to its customers, It becomes PaaS. It makes the developers having platforms according to their requirements and their need to pay either per hour or for a limited period and they do not need to make huge investments in purchasing it from vendor.
3.3 Software as a Service (SaaS)
Main applications for cloud-based big data analytics can be worked with SaaS. SaaS can work as a standalone application or part of a larger cloud provider solution. For example, google, twitter, facebook.
IV. BIG DATA ANALYTICS PROPOSED APPROACHES
There are certain frameworks which can store and process big datasets in proper manner.
4.1 Large Data set storage
In big data analytics we are going to access large data sets, so we need a large data set storage device.
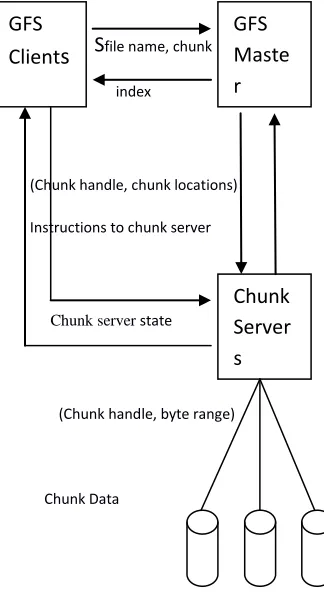
Google file system is large data storage file system in which we have GFS clusters. GFS clusters have many nodes. These nodes are are two types: one Master node in which we have large number of Chunk servers. Each file is divided into fixed-size of chunks.
GF S
file name, chunkindex
(Chunk handle, chunk locations)
Instructions to chunk server
Chunk server state
(Chunk handle, byte range)
Chunk Data
Figur 2. GFS architecture
5Vs of Big
International Journal of Emerging Technology and Advanced Engineering
Website: www.ijetae.com (ISSN 2250-2459, ISO 9001:2008 Certified Journal, Volume 7, Issue 7, July 2017) 4.2 MapReduce
The MapReduce library combines all these intermediate subsets that are associated together with the same intermediate key and sends them together to the Reduce function. Similarly the Reduce function, also accepts all intermediate keys and subsets. The function merges together these subsets with the key to form a smaller set of values
This model is used for web search engine, sorting and processing the data, in data mining, machine learning and many other systems. The whole framework manages the way in which data is split among nodes of cluster and how intermediary query results are aggregate.
[image:3.612.70.266.324.551.2]A basic concept of MapReduce framework can be shown as in Figure 2.
Figure 3. Map-Reduce architecture (based on [27])
For example: Consider the problem of counting how many times each word has occurred in a large collection of documents.
We can write code a simple pseudo-code:
Map Function: map(S k, Sv): // key: name of file // value: contents of file for each word x in value: Emit Intermediate(x, "1"); Reduce Function:
// key: a word // values: counts int result = 0; for each v in values: result += ParseInt(v); Emit(S(result));
[image:3.612.325.569.340.613.2]Hadoop is a distributed computing platform, which is an open source implementation of the MapReduce framework proposed by Google . It is implemented in java and uses the Hadoop Distributed File System (HDFS). HDFS is used by Hadoop applications, HDFC is a initial system for Hadoop applications. HDFC is uses to generate duplicate coppies data sets for reliability, distributing them around the nodes and divide the task into small blocks. The relationship between Hadoop, HBase and HDFS can be understand by Figure 3.
Figure 3. Relationsheep between Hadoop and HDFS
4.3 Parallel database systems
It can be deploy on computer in which there are more than one processor [27]. The parallel DBMS implements the concept of horizontal partitioning. [20] It distributes parts of a large relational table among multiple nodes which will be implemented in parallel.
HDFS
Hado
op
HBase
I/P
I/
P
O/P
o/p
O/P
I/P
O
/P
International Journal of Emerging Technology and Advanced Engineering
Website: www.ijetae.com (ISSN 2250-2459, ISO 9001:2008 Certified Journal, Volume 7, Issue 7, July 2017) This can be done through SQL operators running on
every partition. Some basic operations such as SELECT can be executed independently on all the nodes of the cluster. More complex operations are executed using a multiple operator pipeline.
The no-share approach distributes data across independent nodes and its implementation can be done, by many commercial systems as it provides extensibility and availability. Example of parallel databases is Te-radata, Aster Data, Netezza [27], DATAllegro, Vertica, Greenplum, IBM DB2 and Oracle Exadata.
These parallel databases have been proven successful because:
These allow linear scale-up, [24][26]; the system can work showing continues. well performance as the datasete size can be increased by combine more parallel system.
These allow linear speed-up, [24][26]; for a big datasets with a fix size.
They reduced implementation complexity.
They reduced administration management problem.
They provide more availability.
V. PROPOSED ARCHITECTURE
The design architecture is used to analysis big datasets. The results of the data analysis help to identify patterns in field of analysis.
The design architecture described in figure 4, has three layers:
Layer 1: The input layer implements data acquisition processes; it gets data from different sources which are managed by governmental and public structures.
Layer 2: The data layer stores big datasets on the cloud. In this layer all big datasets stores on cloud then implements distributed, parallel processing;
International Journal of Emerging Technology and Advanced Engineering
Website: www.ijetae.com (ISSN 2250-2459, ISO 9001:2008 Certified Journal, Volume 7, Issue 7, July 2017)
Govt Institution Public institutions & organization other sources Public databases
Data crawler & harvester
Transforms & Normalize data
ETL Server
Processing node
processing Node
Parallel DBMS
Hadoop & map reduce
processing node
Front end Application Server
International Journal of Emerging Technology and Advanced Engineering
Website: www.ijetae.com (ISSN 2250-2459, ISO 9001:2008 Certified Journal, Volume 7, Issue 7, July 2017) VI. CONCLUSION
The processing of big datasets which is unstructured and obtained from multiple sources is a complex task since it requires more storing and processing capacities. Also, processing and analyzing of big volumes of data is unfeasible using a traditional continuous approach. Distributing the big dataset among multiple processing units and parallel processing them provides improved processing speeds. Data storing and collecting on a cloud from different resources.
Big data processing provides a benefit to take big dataset and extract ordered meaning. When distribution of the data is very complex that each processing unit is provided with, the same number of datasets and all the same datasets store on the same processing unit.
REFERENCES
[1] Agneeswaran VS, Tonpay P, Tiwary J (2013) Paradigms for realizing machine learning algorithms. Big Data 1(4):207–214. [2] Xu R, Wunsch D. Clustering. Hoboken: Wiley-IEEE Press; 2009. [3] Ding C, He X. K-means clustering via principal component analysis.
In: Proceedings of the Twenty-first International Conference on Machine Learning, 2004, pp 1–9.
[4] Kollios G, Gunopulos D, Koudas N, Berchtold S. Efficient biased sampling for approximate clustering and outlier detection in large data sets. IEEE Trans Knowl Data Eng. 003;15(5):1170–87. [5] Ma C, Zhang HH, Wang X. Machine learning for big data analytics
in plants. Trends Plant Sci. 2014;19(12):798–808.
[6] Boyd D, Crawford K. Critical questions for big data. Inform Commun Soc. 2012;15(5):662–79.
[7] Katal A, Wazid M, Goudar R. Big data: issues, challenges, tools and good practices. In: Proceedings of the International Conference on Contemporary Computing, 2013. pp 404–409.
[8] Baraniuk RG. More is less: signal processing and the data deluge. Science. 2011;331(6018): 717–9.
[9] W. Dumey, A Generalized Lesson in ETL Architecture Durable Impact Con-sulting, Inc., June 11, 2007,
[10] A. Albrecht, METL: Managing and Inte-grating ETL Processes, VLDB „09, Au-gust 24-28, 2009
[11] R. Davenport, ETL vs ELT, June 2008, Insource IT Consultancy, Insource Data Academy,
[12] J. Dean, S. Ghemawat, “MapReduce: A Flexible Data Processing Tool,” Com-munications of the ACM, vol. 53, no. 1, 2010 [13] M. C. Chu-Carroll, Databases are ham-mers; SIGMOD International
Conference, 2009.
[14] Cisco, Cisco Visual Networking Index: Global Mobile Data Traffic Forecast Update, 2010–2015.
[15] J. Dean, S. Ghemawat, “MapReduce: simplified data processing on large clus-ters,” Commun. ACM, Vol. 51, No. 1, pp. 107–113, 2008. [16] S. Messenger, Meet the world's most powerful weather
supercomputer, 2009,
[17] A. Pavlo, E. Paulson, A. Rasin, D.J. Abadi, D.J. DeWitt, S. Madden and M Stonebraker, “A comparison of ap-proaches to large-scale data analysis,” In Proceedings of the 2009 ACM
[18] M. Stonebreaker et al., “MapReduce and Parallel DBMSs: Friends or Foes,” Communications of the ACM 53(1):64--71 2010.
[19] P. Helland, “If You Have Too Much Da-ta, then “Good Enough” Is Good Enough,” Vol. 9 No. 5, ACM Queue, 2011
[20] M. Tamer Özsu, P. Valduriez, “Distributed and Parallel Database System,” ACM Computing Surveys, vol. 28, 1996, pp. 125 – 128 . [21] S. Pukdesree, V. Lacharoj and P. Sirisang, “Performance Evaluation
of Distributed Database on PC Cluster Computers,” WSEAS Transactions on Computers, Issue 1, Vol. 10, January 2011, pp. 21 – 30, ISSN 1109-2750.
[22] Minelli, M., Chambers, M., & Dhiraj, A. (2013). Big data, big analytics: emerging business intelligence and analytic trends for today's businesses. John Wiley & Sons.
![Figure 3. Map-Reduce architecture (based on [27])](https://thumb-us.123doks.com/thumbv2/123dok_us/8685114.875684/3.612.70.266.324.551/figure-map-reduce-architecture-based-on.webp)
