The role of the free-response receiver
operating characteristic method for dose
and image quality optimisation
An evaluation of low-resolution computed tomography
John D. Thompson
Directorate of Radiography
University of Salford
Thesis for the Degree of Doctor of Philosophy in Radiography
PhD by Published Works
Directorate of Radiography
School of Health Sciences
University of Salford
Greater Manchester
For Kirsty, Harry and Olivia
Student Declaration
I hereby declare that John David Thompson has completed this thesis under the support
and guidance of a dedicated team of supervisors at the University of Salford for the award of
Doctor of Philosophy through the route of published works.
I have maintained confidentiality of participants throughout the research and I have correctly
and adequately acknowledged significant contribution and made reference to supporting
texts.
Contents
List of Tables ... iv
List of Figures ... v
Acknowledgements ... vi
Professor Peter Hogg ... vi
Professor David J. Manning ... vi
Katy Szczepura ... vi
Stephen Thompson ... vi
Professor Dev Chakraborty ...vii
Professor Richard Lawson ...vii
Dr Julie Nightingale ...vii
Abstract ... viii
Abbreviations and Definitions... ix
Publications ... xi
Preliminary Reports ... xii
Conference Proceedings ... xii
Substantiated Author Contributions ... xv
Citation Analysis ... xvi
Ethics in Observer Performance Research ... xvii
Ethical Principles in Medical Informatics ... xvii
Data Protection Act 1998 ... xvii
Ethical Considerations: Phantom versus Patient ... xviii
Acquiring Observer Performance Data at the University of Salford ... xviii
Introduction ... 1
Rationale ... 2
Objectives ... 5
Objective 1 ... 6
Examine the fundamental principles of measuring observer performance with a focus on the free-response paradigm. ... 6
Signal Detection Theory ... 6
The Limitations of a Binary Decision-Making Process ... 9
Receiver Operating Characteristic Analysis ... 10
Partial Area ... 12
ROC Plot Example ... 13
Free-response Receiver Operating Characteristic Analysis ... 15
‘Mark-Rating’ Pairs ... 16
Proximity Criterion ... 16
The FROC Curve ... 17
The Alternative FROC (AFROC) Curve ... 18
Constructing Curves from FROC data ... 19
Data Analysis ... 22
Multi-Reader Multi-Case (MRMC) Analysis ... 22
The Dorfman-Berbaum-Metz Method ... 22
Jackknife Alternative Free-Response Receiver Operating Characteristic (JAFROC) Method ... 24
Comparing Figures of Merit ... 25
Objective 2 ... 26
Develop a consistent and reliable method for image display and response capture in free-response studies. ... 26
Identifying the Task ... 26
Development of ROCView ... 27
Key Functionality of ROCView ... 27
Future Developments to ROCView ... 30
Other Studies and Future Work using ROCView ... 31
Objective 3 ... 32
Assess the potential for lesion detection and dose and image quality optimisation in a range of CT and SPECT/CT systems. ... 32
An Appropriate Test Tool ... 32
Method Outline ... 33
Testing the Method ... 33
Dose Optimisation in a Single Hybrid System ... 34
Comparing Multiple SPECT/CT Systems ... 35
Objective 4 ... 37
Assess the role of the novice observer for suitability in observer performance research. . 37
Wider Applications 1 ... 39
Low-dose Lung Cancer Screening and Incidental Findings ... 39
Wider Applications 2 ... 42
FROC and Radiographic Trauma Imaging ... 42
Reference List ... 44
Appendix A – Paper 1 ...
Appendix B – Paper 2 ...
Appendix C – Paper 3 ...
Appendix D – Paper 4 ...
Appendix E – Paper 5 ...
Appendix F – Paper 6 ...
List of Tables
Table 1: The contribution of each author to the papers included in the PhD by Published Works Thesis. ...xiv Table 2: Citation analysis collated from Google Scholar, Scopus and Research Gate. Note the
variation in the number of citations from different sources. Scopus also includes a social media output; in each case the publisher made the Tweet. Date of analysis: 16/12/2014. Self-citations in parentheses. ...xvi Table 3: Example data of 200 CXR images, with 50% containing a solitary pulmonary nodule.
Observer decisions are distributed across the scale in the expected manner, with the majority of diseased cases scored with high confidence and the majority of normal cases scored with low confidence. ... 14 Table 4: Raw FROC data is presented, listing the LL and NL ratings and also the highest rating,
regardless of classification. These values can now be binned to allow curve construction. ... 18 Table 5: The raw FROC data from Table 4 has been binned and operating points calculated for each
decision threshold. ... 19 Table 6: The FROC curve operating points calculated from the raw FROC data. Note that this
includes all ratings (LL and NL) and not just the highest rating. Therefore there are 35 ratings used in these calculations compared to 26 for the highest rating inferred ROC calculations. ... 20 Table 7: The unique operating points for the AFROC curve for the FROC data in Table 4. ... 20 Table 8: Two examples of discrete rating scale employed by ROCView. Statements were
accompanied by a rating of 1-5 once the localisation and rating had been completed and listed next to the image being evaluated. ... 29 Table 9: Characteristics of lesion size, location and density. ... 33 Table 10: Summary of observer experience in the empirical works completed for this PhD by PW. ... 37 Table 11: A comparison of CT acquisition parameters used in lung cancer screening (LCS) and for
List of Figures
Figure 1: Contrast detail images produced by a planar image acquisition on a gamma camera in nuclear medicine. The Rose model predicts the line of demarcation for object detection; a diagonal line from the lower left to upper right of each image – objects above this line are barely detectable The level of image noise dictates the position of the diagonal line. Image reproduced from Rzeszotarski (1999). ... 8 Figure 2: The contrast detail curves for different counting statistics, as illustrated in Figure 1. The
sizes of object above each line indicates those that can be detected. In this example, smaller and lower contrast objects can be seen with increasing image counts. Image reproduced from
Rzeszotarski (1999). ... 8 Figure 3: Typical ROC Curve appearances. ... 11 Figure 4: Two intersecting ROC curves. Despite having statistically similar summary indices (AUC)
the two curves have areas that outperform each other. The vertical grey band below the curves shows that Test A has better specificity. The horizontal grey band to the right of the curves shows that Test B has better sensitivity. ... 13 Figure 5: The ROC curve plotted from the operating points calculated in Table 3. ... 14 Figure 6: The fitted ROC curve from the rating data in Table 3. ... 15 Figure 7: The three curves produced from the raw FROC data in Table 4; A, the highest rating
inferred ROC curve; B, the FROC curve; and C, the AFROC curve. Operating points are marked on all curves. The area under the ROC curve is 0.853 and the area under the AFROC curve is 0.703. ... 21 Figure 8: The slider-bar quasi-continuous rating scale that appeared as a pop-up box following a
localisation. Moving the slider further to the right indicated a higher level of confidence. The marker containing 1 indicates that this is the first localisation on this case. ... 29 Figure 9: The anthropomorphic chest phantom used in the empirical works (Lungman N1
Multi-Purpose Chest Phantom; Kyoto Kagaku Company Limited Online,
Acknowledgements
Professor Peter Hogg
Lead PhD Supervisor; Professor of Radiography, University of Salford
Peter has provided unparalleled support, guidance and mentorship throughout my PhD by
Published Works. His dedication to my learning has had an immeasurable impact on the
development of my research skills.
Professor David J. Manning
PhD Co-Supervisor; Professor of Radiography, Lancaster University, University of Salford
David has been a mentor to me as I have been trying to establish myself in observer
performance. His expert advice and guidance in all aspects of observer performance and
visual perception has been invaluable to my development as an academic.
Katy Szczepura
PhD Co-Supervisor; Medical Physics Lecturer, University of Salford
Katy’s knowledge of imaging system characteristics and her technical understanding of
imaging systems has been a valuable influence. Katy has provided me with the necessary
support and encouragement required to complete the research projects for my PhD.
Stephen Thompson
Independent Software Developer; Bury St. Edmunds
Stephen has invested a vast amount of time in the development and programming of the
ROCView software that has been integral to this body of work; without these skills and
Professor Dev Chakraborty
Professor of Radiology; University of Pittsburgh, PA, USA
Dev has offered me expert advice and technical assistance with many aspects of performing
free-response studies. Dev has been integral in the development of my analytical skills while
also helping develop my academic writing style. Two periods of work with Professor
Chakraborty (in-person) have been invaluable to my development and consolidation of my
understanding of ROC/FROC methodology.
Professor Richard Lawson
Honorary Consultant Medical Physicist; Central Manchester Nuclear Medicine Centre. Honorary Professor; University of Salford. Honorary Senior Lecturer; University of Manchester.
Richard has been outstanding in providing me technical advice about the functionality of
hybrid imaging systems. Richard has also given me regular advice on statistics to aid my
understanding of data analysis and improve my reporting of results.
Dr Julie Nightingale
PhD Supervisor (Registration Period) Director of Radiography and Occupational Therapy, University of Salford
Julie has provided me with valuable guidance in the final stages of preparing this thesis. Her
Abstract
This thesis describes the value of the free-response receiver operating characteristic
(FROC) paradigm for dose and image quality optimisation in a niche area of imaging. The
empirical works discussed in this thesis focus on the diagnostic value of the low-resolution
computed tomography (CT) images acquired for attenuation correction (AC) – a process
primarily used to correct for photon attenuation with images produced merely as a
consequence of the exposure. The potential discovery of incidental findings on these images
was investigated.
The observers taking part in the empirical studies were generally lacking in significant
experience of interpreting CT images. As a consequence it was also deemed valuable to
investigate the value of the novice observer in free-response studies. A further
methodological consideration for studies of this kind is consistent and reliable image display
and FROC data collection. Prototype software, ROCView, was designed and developed to
make this an easy process and the key functionality and impact is analysed here.
In addition to the empirical works, two review papers, aimed at the technologists and
radiographers performing low-resolution CT for AC, are summarised. They explain the value
of the FROC paradigm and the jackkinfe alternative FROC (JAFROC) analysis method to a
Abbreviations and Definitions
AC Attenuation Correction
A method to correct for photon attenuation induced artefacts.
AFROC Alternative Free-response Receiver Operating Characteristic
A hybrid curve where the trapezoidal area beneath the curve is equivalent to the JAFROC figure-of-merit.
ALARP As Low As Reasonably Practicable
A principle often used to describe dose optimisation.
AR Acceptance Radius
A tool used to classify observer localisations as correct/incorrect.
AUC Area Under the ROC Curve
A summary index by which different diagnostic tests can be compared.
pAUC Partial Area Under the ROC Curve
A summary index useful for evaluations of high sensitivity or specificity.
CD Contrast Detail
(Phantom) Used to provide a simplified observer test using a signal known exactly/background known exactly method.
CT Computed Tomography
Imaging modality evaluated in this thesis.
CTDI Computed Tomography Dose Index
An estimate of the dose delivered in CT.
DICOM Digital Imaging and Communications in Medicine
Standard image format used in radiology.
FPF False Positive Fraction
1-specificity.
FROC Free-response Receiver Operating Characteristic
The method used to capture free-response data.
HU Hounsfield Unit
(Scale) A transformation of linear attenuation coefficient measurements where water is defined as zero (0) and air is defined as -1000.
i, j, k Modality, Reader, Case
Common denotation in ROC/FROC equations.
JAFROC Jackknife Alternative Free-response Receiver Operating Characteristic
The figure of merit most frequently associated with free-response methodology. It is the probability that a lesion rating exceeds any rating on normal cases.
LD-LCS Low-dose Lung Cancer Screening
Using low-dose CT acquisitions in a screening programme.
LL Lesion Localisation
LLF Lesion Localisation Fraction
The number of lesions correctly localised divided by the total number of lesions, at each threshold.
MPI Myocardial Perfusion Imaging
A tomographic imaging procedure to reveal coronary artery disease. Images are frequently corrected with CT-based attenuation correction to account for photon attenuation artefacts.
MRMC Multiple-reader Multiple-case
Defined as common set of observers interpreting a set of images common to all modalities being evaluated.
NL Non-lesion Localisation
An incorrect localisation on normal or abnormal cases.
NLF Non-lesion Localisation Fraction
The number of non-lesion localisations divided by the number of cases.
ROC Receiver Operating Characteristic
A method for measuring the performance of observers and imaging modalities.
SDT Signal Detection Theory
Used to analyse the detection and discrimination process of an observer seeing a signal.
SPECT/CT Single Photon Emission Computed Tomography/Computed Tomography
A hybrid imaging modality combining functional and anatomical imaging.
TPF True Positive Fraction
Publications
This thesis is based on the following published papers. Papers are listed in order of their
publication date:
1. Thompson JD, Hogg P, Thompson SM, Manning DJ, Szczepura K. ROCView:
prototype software for data collection in jackknife alternative free-response receiver
operating characteristic analysis. The British Journal of Radiology 2012;85:1320-1326.
2. Thompson J, Hogg P, Szczepura K, Manning D. Analysis of CT acquisition
parameters suitable for use in SPECT/CT: A free-response receiver operating
characteristic study. Radiography 2012;18:238-243.
3. Thompson J, Hogg P, Higham S, Manning D. Accurate localisation of incidental
findings on the computed tomography attenuation correction image: the influence of
tube current variation. Nuclear Medicine Communications 2013;34:180-184.
4. Thompson JD, Manning DJ, Hogg P. The value of observer performance studies in
dose optimisation: A focus on free-response receiver operating characteristic
methods. Journal of Nuclear Medicine Technology 2013;41:57-64.
5. Thompson JD, Hogg P, Manning DJ, Szczepura K, Chakraborty DP. A
Free-response Evaluation Determining Value in the Computed Tomography Attenuation
Correction Image for Revealing Pulmonary Incidental Findings: A Phantom Study.
Academic Radiology 2014;21:538-545.
6. Thompson JD, Manning DJ, Hogg P. Analysing data from observer studies in
medical imaging research: an introductory guide to free-response techniques.
Radiography 2014;20:295-299.
7. Buissink C, Thompson JD, Voet M, Sanderud A, Kamping LV, Savary L, Mughal M,
Rocha CS, Hart GE, Parreiral R, Martin G, Hogg P. The influence of observer training
in a group of novice observers: a jackknife alternative free-response receiver
operating characteristic analysis. Radiography 2014;20:300-305.
The papers will be referred to in the text using the numeric value (1-7). The full papers are
Preliminary Reports
In addition to the published articles listed above, the research undertaken as part of this PhD
by Published Works has been disseminated both orally and as poster presentations within
conference proceedings and research seminars.
Conference Proceedings
Szczepura, K. Thompson, J. Tootell, A. Driver, J. Manning, D. Hogg, P. An analysis of
phantom image data to determine optimal CT exposure factors for use in SPECT/CT. British
Nuclear Medicine Society: Harrogate. Nuclear Medicine Communications 2010;31:463.
Thompson, J. Szczepura, K. Tootell, A. Sil, J. Manning, D. Hogg, P. An analysis of phantom
image data to determine optimal CT exposure factors for use in SPECT/CT. World
Federation of Nuclear Medicine and Biology: Cape Town. World Journal of Nuclear Medicine
2010;9;1:S158.
Thompson, J. Hogg, P. Szczepura, K. Tootell, A. Sil, J. Manning, D. Determination of optimal
CT exposure factors for lung lesions using an anthropomorphic chest phantom for
SPECT-CT. European Association of Nuclear Medicine: Vienna. European Journal of Nuclear
Medicine and Molecular Imaging, 2010;37;Suppl 2:S494.
Thompson, J. Hogg, P. Thompson, S. ROCView: prototype software moving toward easier
data collection in JAFROC analysis. Proceedings of the UK Radiological Congress (UKRC):
Manchester. 2011:58 http://bjr.birjournals.org/site/misc/Proceed_2011.pdf
Thompson, J. Szczepura, K. Manning, D. Hogg, P. Lesion detection in the CT attenuation
correction image of 5 different low resolution SPECT/CT systems: a multi-centre study.
British Nuclear Medicine Society: Harrogate. Nuclear Medicine Communications
2012;33(5):548.
Thompson, J. Higham, S. Hogg, P. Manning, D. Szczepura, K. The impact of tube current
variation on lesion detection in the attenuation correction image co-incidentally acquired for
myocardial perfusion imaging in SPECT/CT: a phantom based study. Proceedings of the UK
Radiological Congress (UKRC) 2012, Manchester
Thompson, J. Szczepura, K. Manning, D. Hogg, P. Lesion detection in the CT attenuation
correction image of 5 different low resolution SPECT/CT systems: a multi-centre study.
Thompson, J. Hogg, P. Manning, D. Szczepura, K. Chakraborty, D. Lesion detection in the
CT attenuation correction image of 5 SPECT/CT systems: a multi-centre study. European
Association of Nuclear Medicine: Milan. European Journal of Nuclear Medicine and
Molecular Imaging 2012;39(Suppl 2):625.
Thompson, J. Hogg, P. Higham, S. Manning, D. The impact of tube current variation on
lesion detection in the attenuation correction image acquired for myocardial perfusion
SPECT/CT: a phantom based study. European Association of Nuclear Medicine: Milan.
European Journal of Nuclear Medicine and Molecular Imaging 2012;39(Suppl 2);625.
Buissink C, Thompson J, Voet M, Sanderud A, Kamping LV. Savary L, Mughal M, Rocha
CS, Hart GE, Parreiral R, Martin G, Hogg P. The influence of observer training in the
detection of pulmonary lesions in chest phantom single CT images: a JAFROC analysis.
Portuguese Association of Radiotherapy, Radiology and Nuclear Medicine (ATARP) 2013,
Lisbon.
Buissink C, Thompson JD, Voet M, Sanderud A, Kamping LV, Mughal M, Rocha CS, Hart
GE, Parreiral R, Martin G, Hogg P. The influence of experience and observer training for the
detection of simulated pulmonary lesions: a jackknife alternative free-response receiver
operating characteristic analysis: Proceedings of the UK Radiological Congress (UKRC)
Intellectual Ownership and Contribution
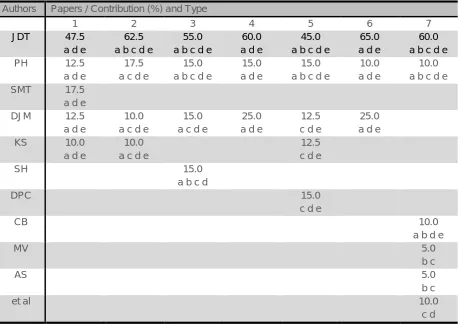
The intellectual ownership and type and percentage contribution of all co-authors for each
paper (1-7) included in this PhD thesis are displayed in Table 1. The type of contribution is
summarised as:
a) Concept and Design
b) Data Collection
c) Data Analysis
d) Drafting and Revision
e) Final Approval
This has been based on a subset of categories for authorship as recommended by the
International Committee of Medical Journal Editors (International Committee of Medical
Journal Editors, n.d.). However, contributors were not denied the opportunity to become
authors if they did not fulfil each of the criteria. All co-authors listed had the opportunity to
review the final submission.
Authors Papers / Contribution (%) and Type
1 2 3 4 5 6 7
JDT 47.5 a d e
62.5 a b c d e
55.0 a b c d e
60.0 a d e
45.0 a b c d e
65.0 a d e
60.0 a b c d e
PH 12.5
a d e
17.5 a c d e
15.0 a b c d e
15.0 a d e
15.0 a b c d e
10.0 a d e
10.0 a b c d e
SMT 17.5
a d e
DJM 12.5
a d e
10.0 a c d e
15.0 a c d e
25.0 a d e
12.5 c d e
25.0 a d e
KS 10.0
a d e
10.0 a c d e
12.5 c d e
SH 15.0
a b c d
DPC 15.0
c d e
CB 10.0
a b d e
MV 5.0
b c
AS 5.0
b c
et al 10.0
[image:18.595.70.533.391.717.2]c d
Substantiated Author Contributions
The contribution of all those eligible for authorship has been recognised by John David
Thompson in all the papers included in this PhD by Published Works Thesis.
• No eligible author has been denied authorship of the opportunity to contribute
• No ineligible author has been included on any publication
• Where appropriate, acknowledgements have been made to participants who do not
satisfy enough criteria to be considered a co-author
• The contribution and ownership displayed in Table 1 is accurate
I hereby declare that the above statements have been satisfied. I sign to acknowledge the
contribution of all authors1 in accordance with the University of Salford Code of Conduct:
Signed:
Professor Peter Hogg, Associate Head of Research, University of Salford
Lead PhD Supervisor and Co-author
1
It was no longer possible to make contact with all co-authors. Author contribution substantiated by the lead PhD supervisor who was a co-author on all papers.
Citation Analysis
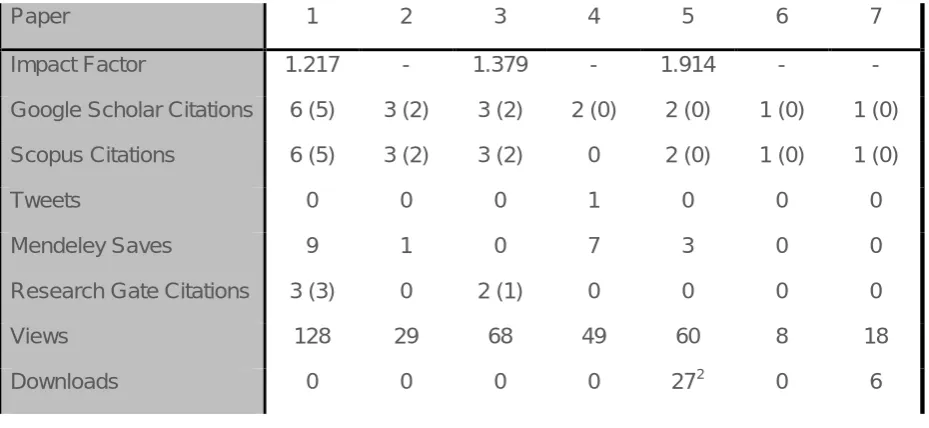
Citation analysis is a relevant activity for a thesis drawing on published work. The number of
citations per article can be a good indication of the impact of the work to other researchers
but it does not necessarily correlate with the quality of the paper (Nightingale & Marshall,
2012). Furthermore, the work discusses a niche area of imaging and prospective nature of
the work means that the work has not been in press long enough to generate a large number
of citations. Consequently it is also important to consider other relevant metrics, such as
abstract and full-text views and downloads. Citations are usually considered to originate from
journal articles but can appear in a wide range of sources (Nightingale & Marshall, 2012).
The impact of the published work is demonstrated in Table 2.
Paper 1 2 3 4 5 6 7
Impact Factor 1.217 - 1.379 - 1.914 - - Google Scholar Citations 6 (5) 3 (2) 3 (2) 2 (0) 2 (0) 1 (0) 1 (0) Scopus Citations 6 (5) 3 (2) 3 (2) 0 2 (0) 1 (0) 1 (0)
Tweets 0 0 0 1 0 0 0
Mendeley Saves 9 1 0 7 3 0 0 Research Gate Citations 3 (3) 0 2 (1) 0 0 0 0 Views 128 29 68 49 60 8 18 Downloads 0 0 0 0 272 0 6
Table 2: Citation analysis collated from Google Scholar, Scopus and Research Gate. Note the variation in the number of citations from different sources. Scopus also includes a social media output; in each case the publisher made the Tweet. Date of analysis: 16/12/2014. Self-citations in parentheses.
2
[image:20.595.67.532.323.537.2]Ethics in Observer Performance Research
Ethical Principles in Medical Informatics
For medical research the role of human participants in research is summarised by the
Declaration of Helsinki (World Medical Association, 2013). The interests and wellbeing of the
research participants must be the primary concern during the research, and while this
document refers to participants as patients, the same standards should be applied to those
who participate as observers.
In terms of medical informatics the systems in place should support research, protect from
harm and maintain confidentiality (Duquenoy, George, & Solomonides, 2008). This has
some application to the current body of work. Broadly speaking, ethical issues serve to
protect the interests and integrity of individuals and uphold standards. In the observer
studies completed for this PhD by PW it was essential to maintain the confidentiality of all
the research participants, making sure that any recorded data was not identifiable to them.
Ethical standards in relation to electronic data and records, based on the code of ethics,
have been proposed (Duquenoy et al., 2008):
• Security
• Integrity
• Material Quality
• Usability
• Accessibility
Data Protection Act 1998
The Data Protection Act (DPA) 1998 (Legislation.gov.uk, 1998) is applicable to all observer
studies. All data processing should be ‘adequate, relevant and not excessive’. It should
therefore not exceed what is required for a reliable result to be formed, unless there are
other components to the research. Participants must be given appropriate information to
enable them to make a reasoned decision about taking part in a study. Consent may be
required, but explicit (written) consent is only required for sensitive data.
All participants should also be made aware of the purpose of the data collection, how long
the data will be kept and what will be done with the data when it has been collected. For all
empirical works reported in this thesis, participants were told that their data would be used in
their data would be destroyed (electronic record deleted) if they decided to withdraw from the
study – which they could do at any time. Identifiable data was kept in a password-protected
file, to ensure that there was no unauthorised access of data.
Ethical Considerations: Phantom versus Patient
Working with an anthropomorphic chest phantom has many obvious benefits as well as
drawbacks in comparison to imaging patients. A recent editorial highlights the ethical issues
of reviewing a dose optimisation study that has been conducted on patients (Achenbach,
Chandrashekhar, & Narula, 2013). The main concern was the repeated exposure of patients
to illustrate that dose and image quality could be optimised in computed tomography. It is
clear in this example that the research team and institutional review board did not consider
non-maleficence (do no harm), and are in breach of one of the core ethical principles. While
this editorial’s main concern was the ethics in research in publishing, it also adds support to
the ethical justification of using an anthropomorphic chest phantom to investigate dose
optimisation. Knowledge of true disease status is required for observer studies. Although this
is not strictly an ethical issue, it is relevant to the argument between patient and phantom
based studies. Ascertaining this ‘truth’ can be problematic in patients and recent work cites
this as a problem in observer performance studies (Kundel, 2006). In phantom work, this is
much easier to control as the investigators are often responsible for the placements of
‘disease’.
Acquiring Observer Performance Data at the University of
Salford
The overwhelming majority of the observer studies were conducted within the University of
Salford medical imaging facility. All articles within this PhD by PW were subject to the same
high standards of ethical requirements, as they were constituted within the University of
Salford’s ethical framework. All participants were consented prior to participating; this
included giving a detailed explanation of what was required through use of an information
sheet and/or an explanatory PowerPoint presentation. Data were stored in an anonymous
fashion on a password-protected computer. Participants had the option to receive feedback
on their performance and most took up this opportunity. Observers received a data-sheet
that could be used in a CPD portfolio; identifying their individual and observer averaged
Introduction
Observer performance has been applied in radiology to assess the diagnostic performance
of imaging systems and techniques. This type of assessment method is useful for measuring
diagnostic performance when the observer is considered to be an integral component of the
imaging system. These methods have become popular and have particular value in
comparing the performance of existing and new imaging techniques, where the aim is to
establish if the new technique offers any statistically significant advantage over the current
gold-standard or best current alternative.
The receiver operating characteristic (ROC) method has been described extensively
(Chesters, 1992; Hanley & McNeil, 1983; Hanley, 1989; Kundel, 2006; Metz, 1978; Swets,
1996) and for many years was the method of choice for observer studies assessing a single
pathology. The ROC method was a natural successor to signal detection theory (SDT) and
the original application was in radio detection and ranging (radar) (Manning, 1998). The first
use of ROC in radiology occurred in the 1960’s (Lusted, 1960) and has since been used in a
large number of laboratory studies. However, the ROC method is limited by not taking into
account all the available information that an image contains – specifically it does not deal
well with multiple pathologies and does not discriminate on the basis of location, where only
a single rating of confidence can be obtained for each image.
The free-response ROC (FROC) paradigm was developed to overcome these problems.
This method is location sensitive and requires observers to localise all suspicious areas of
an image with precision, and provide a confidence rating for each localisation; the earliest
implementation of this paradigm was reported in the 1990’s (Chakraborty & Winter, 1990).
The key methodological aspects of FROC have double effect; not only is this method more
reflective of the clinical task but it also holds a statistical advantage over traditional ROC
methods (Krupinski & Jiang, 2008).
The development of the FROC paradigm and the suitability of it to this research theme have
Rationale
Advancing technology and new techniques ensure the important role of radiology in the
diagnosis and management of disease. The non-invasive nature of many imaging tests can
be preferential for patients and referrers in comparison to interventional or surgical
procedures, despite the accompanying radiation risk.
The demand for radiological procedures is ever increasing, with the collective dose of
computed tomography (CT) increasing by nearly 30% in the UK over a 10-year period (Hart,
Wall, Hillier, & Shrimpton, 2010). There are persisting concerns about the dose associated
with CT and the contribution of CT to the total dose received by a single patient (Hara et al.,
2009). This is evident in the United Kingdom, where CT examinations are responsible for the
highest dose in terms of the total radiation dose delivered (Hart et al., 2010). Additionally, CT
is the only diagnostic modality where the dose has increased in recent years (Dawson,
2004). In the United States of America the increasing use of CT has been attributed to an
increased role in paediatric diagnosis and adult screening, where reduced scanning time has
been cited as major contributing factors (Brenner & Hall, 2007).
The other side to the increasing use of CT is the potential clinical benefit. It has been
reported that a significant increase in the use of CT in emergency care has improved clinical
decision making. In particular, patients with abdominal pain are more likely to receive a CT
scan, with an overall reduction in the number of hospitalizations and transfers (Kocher et al.,
2011).
The use of CT has also developed rapidly in nuclear medicine. The initial use of CT in
nuclear medicine was to provide attenuation correction (AC) during myocardial perfusion
imaging (MPI) (Bateman & Cullom, 2005; Malkerneker et al., 2007; Pazhenkottil et al.,
2011). The CT images are acquired as a high photon flux (good statistically in comparison to
radioactive line sources) transmission map, giving a good representation of tissue
attenuation. Large volumes of individual projections are acquired to provide a transmission
measurement of each slice of tissue in the desired volume of the body (Patton & Turkington,
2008). This can then be used to correct for photon attenuation of radioactive isotopes by
body structures that are apparent in single photon emission computed tomography (SPECT),
which is the tomographic imaging mode used in nuclear medicine where planar images are
acquired at multiple angles around the body area of interest. This is typically 60 planar
The transmission imaging provided by AC had previously been conducted using a moving
radioactive line source such as Gadolinium, 153Gd, or Germanium, 68Ge; and while this
improved the specificity of the technique (Gallowitsch et al., 1998) it is associated with
several drawbacks in comparison to CT-based transmission imaging for AC. These include
reduced photon flux, long acquisition times, the need to replace the radioactive line source
and cross-talk of radiopharmaceutical energies (Zaidi & Hasegawa, 2003). CT-based AC is
also higher resolution and can provide anatomical detail, but is also associated with a higher
dose than 68Ge in PET imaging (Wu et al., 2004).
The use of CT for AC in conjunction with SPECT and positron emission tomography (PET)
has led to significant improvements in MPI for the diagnosis of coronary artery disease
(CAD) (Gaemperli, Bengel, & Kaufmann, 2011; Kaufmann, 2009). AC is typically performed
when images are degraded as a result of patient dependant, non-uniform and occasionally
focal, photon attenuation. In males this occurs because of the diaphragm and in females
because of breast tissue (Burrell & MacDonald, 2006). The CT data provide a high quality
map of attenuation coefficients that are used to correct for radionuclide photon attenuation in
SPECT and PET (Koepfli et al., 2004; Pazhenkottil et al., 2011).
Beyond AC, CT is now used routinely for localisation of radioactive foci, with particular
success in cases of specific tracer uptake and also for diagnosis (Bockisch, Freudenberg,
Schmidt, & Kuwert, 2009), where PET/CT has embraced this sooner and more universally
than SPECT/CT.
Despite the existence of three clear roles for CT in nuclear medicine, the ‘quality’ of CT
required to accomplish each task is less well defined and there is likely to be overlap
between the quality/dose of CT required for each role. To amplify this overlap, there is also
great variation in the capability of the CT systems used to perform AC. The primary focus of
the empirical work reported in this thesis was to evaluate the potential clinical value of the
low-resolution CT image that is produced during AC in a range of systems.
The clinical value of these images is an evolving problem. Early SPECT/CT systems used
basic CT units designed to provide AC. The quality of the CT images produced was poor,
and in comparison to a conventional CT image they are likely to have been considered
non-diagnostic. Despite this, some previous work has been completed to assess the diagnostic
value of these resolution CT images. Using an early SPECT/CT system, the
low-resolution CT images of 200 consecutive patients undergoing MPI with AC were evaluated
for incidental findings. Large numbers (234 abnormalities) were found, with some considered
of major clinical significance that were previously unknown to the patient (Goetze, Pannu, &
CT technology in nuclear medicine has improved since the work of Goetze et al (2006) was
completed and the images produced during CT-based AC are improving in quality. This may
have prompted a shift in the perception of the value of these images. The Ionising Radiation
(Medical Exposure) Regulations, 2000, Regulation 7 require that a clinical interpretation is
completed for each exposure (Department of Health, 2000) – this implies that the CT images
produced during AC should be reported. This has recently gained some support, with
recommendations from The British Nuclear Medicine Society now recommending that CT
images should be reported (Arumugam, Harbinson, Reyes, Sabharwal, & Tonge, 2012).
However, they limit this to images considered ‘diagnostic quality’ and appear to exclude
‘low-dose’ or ‘low-resolution’ images from this recommendation. The work presented in this thesis
tests the strength of this guidance by assessing a range of SPECT/CT systems, with
different CT unit capability, using the latest observer performance methods.
In the context of dose optimisation, this guidance, with the knowledge of the potential
discovery of incidental findings, has led to some difficult and controversial decisions
regarding the quality of the CT exposure used for AC. The trade-off concerns the extra
information that may be gained by performing a higher dose scan against the original clinical
question and the primary reason for the exposure – AC. This is further complicated by the
fact that an adequate attenuation map (mu; µ) can be created, irrespective of the exposure
parameters used (Kamel et al., 2002; Preuss et al., 2008; Wells, Soueidan, Vanderwerf, &
Ruddya, 2012; Xia, Alessio, & Kinahan, 2009).
The advantage of using a higher-dose (if not diagnostic) CT acquisition for AC with the
premise of detecting incidental findings in MPI is unclear. Dose optimisation is a key aspect
of radiology and all examinations should be dose efficient, conforming to the as low as
Objectives
The empirical work evaluated in this thesis was completed using the free-response receiver
operating characteristic paradigm and the latest analysis methods that are associated with
these observer performance methods. This thesis will discuss the suitability of these
methods for the research reported and evaluated in this thesis. The research was facilitated
by prototype software that allowed multiple concurrent users to complete image evaluations
in any location since it is run from a web-based platform. The key functionality and suitability
of the software will be critically evaluated.
The focus of the empirical works was to evaluate the diagnostic value and potential
optimisation of radiation dose of the low-resolution CT images acquired during AC. The
observer task in this research was often completed by participants that would be considered
novice, in part because of the difficulties in accessing large numbers of expert observers.
The publications reported in this thesis are critically evaluated for their potential impact and
develop the following objectives for critical evaluation:
1. Examine the fundamental principles of measuring observer performance with a focus
on the free-response paradigm.
2. Develop a consistent and reliable method for image display and response capture in
free-response studies.
3. Assess the potential for lesion detection and dose and image quality optimisation in a
range of CT and SPECT/CT systems.
4. Assess the role of the novice observer for suitability in observer performance
Objective 1
Examine the fundamental principles of measuring observer
performance with a focus on the free-response paradigm.
In order to proceed with the research it was necessary to develop a strong underpinning
knowledge of observer performance, with a particular emphasis on the methods and
analysis of data. This review begins with a brief overview of signal detection theory before
making the natural step on to the ROC and FROC paradigms.
The following topics will be explored:
Signal Detection Theory (SDT)
Receiver Operating Characteristic (ROC) Analysis
ROC Rating (Confidence) Scales
ROC Curves
Multi-Reader Multi-Case Analysis
To proceed with the investigation of low-resolution CT using the proposed method it was first
important to develop a broad underpinning knowledge of observer performance. This begins
by reviewing the development of receiver operating characteristic methods, understanding
the limitations and embracing the recent developments in the methodology that have led to a
statistically powerful and clinically relevant method of analysis.
The text will look at the key methodological aspects of the free-response paradigm and
explore the empirical construction of the curves associated with free-response methods and
the figures of merit that are used in statistical testing. Two key papers (4 and 6) have
demonstrated and supported this process. The choice of journals for publication was vital,
since the aim was to raise awareness of, and explain, the important role that observer
performance plays in the evaluation of imaging techniques to two key groups: Radiographers
and Nuclear Medicine Technologists.
Signal Detection Theory
For many years signal detection theory (SDT) has been used as a theoretical framework to
to analyse the detection and discrimination process of an observer seeing a signal (i.e. in a
background of increasing noise), while attempting to reveal the decision criterion (threshold)
adopted by the observer during the detection process (Jäkel & Wichmann, 2006).
SDT research began with an application of the Rose model using a contrast detail (CD)
phantom in fluoroscopy (Burgess, 2010). This was the first attempt at dose and image
quality optimisation in radiology, where the CD phantom was used to assess observer
performance. Albert Rose developed the absolute scale of quantum efficiency to evaluate
system performance and what is now known as the Rose model to assess signal
detectability in human observers (Burgess, 2010). These methods have maintained their
popularity in medical imaging. Applications of detectability of sharp-edged objects in a
uniform background of changing noise are still being used in quality control for fluoroscopy,
radiography, mammography (Kotre, 2006) and nuclear medicine (Rzeszotarski, 1999),
Figure 1. The type of test described is commonly referred to as a signal known exactly /
background known exactly (SKE/BKE) test (Burgess, 2010; Kotre, 2006).
In the following example, the observer is tasked with deciding which size and density of
sharp-edged object can be detected. Once this has been completed for a range of object
sizes and levels of image noise, contrast detail curves can be plotted to show detection rates
at different levels of contrast and object sizes, Figure 2. This example reveals that reduced
counting statistics in nuclear medicine have a negative impact on object detectability due to
a loss of spatial frequency. Theory supports the findings that noise impairs image
Figure 1: Contrast detail images produced by a planar image acquisition on a gamma camera in nuclear medicine. The Rose model predicts the line of demarcation for object detection; a diagonal line from the lower left to upper right of each image – objects above this line are barely detectable The level of image noise dictates the position of the diagonal line. Image reproduced from Rzeszotarski (1999).
Figure 2: The contrast detail curves for different counting statistics, as illustrated in Figure 1. The sizes of object
[image:30.595.107.490.73.333.2] [image:30.595.90.510.417.702.2]Despite the value of the SKE/BKE test in radiology and the obvious benefit of a low cost and
simple solution to comparing system performance, it is questionable whether the results can
be extrapolated into the clinical setting as a prediction of detectability (Kotre, 2006).
Furthermore, no visual search is required. Where there is a low threshold for detection the
known location of the signal may contribute to detection rates for objects that otherwise
would have been inconspicuous. SDT was a natural stepping-stone toward the development
of receiver operating characteristic (ROC) analysis for the observer performance in radiology
(Burgess, 2011).
The Limitations of a Binary Decision-Making Process
When an observer interprets a series of images with signal detection as the primary
objective, there are four possible outcomes of each interpretation: true positive (TP), true
negative (TN), false positive (FP) and false negative (FN). In this basic example the observer
is making a simple decision about the presence of a signal – either it is present or absent.
When the observer completes this task they use a decision threshold to determine whether
the signal is present of not. For a single decision threshold, a basic binary (yes/no) response
is made. This yields a single measure of sensitivity and specificity. However, this decision
threshold is variable for different observers and tasks. It is this variation that can lead to
different estimations of sensitivity and specificity for the same test (Obuchowski, 2005). A
further drawback of this is that it is difficult to compare two different summary figures (i.e
sensitivity and specificity).
In radiology a single decision threshold may be acceptable for cases that are easily
classified as normal or diseased. However, the simple cases do not generally cause major
problems in radiology; it is the difficult cases that require greater attention, where the
boundaries between error and acceptable variation are less clear (Robinson, 1997).
Furthermore, a single value of sensitivity and specificity does not account for an imaging
system’s ability to distinguish between actually negative and actually positive patients (Metz,
2006).
The receiver operating characteristic (ROC) method builds on the limitations of single
decision threshold, using a confidence scale to rate the perceived likelihood of disease
presence (Metz, 2006; Obuchowski, 2005). This provides an analysis through the entire
range of sensitivity and specificity values, over which the ROC curve is plotted (Zou,
O’Malley, & Mauri, 2007). The multiple thresholds used in ROC provide a single value (the
Receiver Operating Characteristic Analysis
The receiver operating characteristic (ROC) method was originally used for RADAR
detection in the 1950’s prior to its first application in radiology in the 1960’s (van Erkel &
Pattynama, 1998; Vining & Gladish, 1992). ROC methods focus on the correct classification
of disease and are frequently used to assess the diagnostic accuracy of imaging techniques
in which the observer (frequently a radiologist) is considered an integral part of the system
(Chakraborty, 2002). ROC methods are particularly useful for comparing a new imaging
technique with an existing ‘gold-standard’, when the true disease status of the patient is
known (Zou, Liu, Bandos, Ohno-Machedo, & Rockette, 2012). The popularity of the ROC
method arises from the ability of the method to provide a description of diagnostic accuracy
for a full range of sensitivity and specificity of a diagnostic test (Gur et al., 2010; Metz, 2006).
When comparing the diagnostic accuracy of two tests a detectability index, such as the area
under the ROC curve (AUC), is used to show the level at which the two diagnostic tests are
different.
Rating scales are used in ROC analysis to allow an observer to provide a numeric rating to
an image based on the perceived likelihood that disease is present (Chakraborty, 2002).
These are frequently on a scale of 1 to 5, described as ordinal or discrete, where an
increasingly large value signifies an increased level of confidence in the observer’s decision.
Rating scales can also be quasi-continuous, which can provide a more precise measure of
diagnostic accuracy if used well (Hadjiiski, Chan, Sahiner, Helvie, & Roubidoux, 2007).
Neither ordinal nor quasi-continuous scales are suitable for all tasks (Rockette & Gur, 2008)
and the type of scale used must compliment the diagnostic task. Each value on a rating
scale denotes a different threshold value of sensitivity and specificity (Metz, 2006). The use
of a rating scale allows a measure of diagnostic performance that is independent of both
disease prevalence and decision threshold.
In an ROC study each image is rated and a score of ‘1’ is often reserved for those images
that the observer believes to be disease free; ratings 2-5 indicate an increasing suspicion of
disease for each scored image. For future reference, the ratings associated with ROC
analysis will be classed as case-based decisions.
The ROC Curve and Area Under the Curve
The ROC curve is a simple graphical method of displaying the diagnostic accuracy of a test,
as discovered during ROC analysis (Zou et al., 2012). It provides a useful visual comparison
of the performance of different tests or observers. An ROC curve is produced for each
imaging modality or diagnostic test, and each observer being evaluated. The ROC curve is a
cases) against false positive fraction (FPF, the proportion of incorrect decisions on actually
normal cases) (Chesters, 1992; Vining & Gladish, 1992; Zanca et al., 2012). This is a display
of the relationship between sensitivity and specificity for a full range of decision thresholds –
as determined by the confidence scale used.
For statistical analysis it is common to summarise the ROC curve using the AUC index; it is
also frequently referred to as Az (Jiang, Metz, & Nishikawa, 1996), but this is an estimate of
the binormal model estimation only. It is a standardised measure of accuracy of combined
observer and modality performance (Chakraborty, 2002). The AUC is defined as the
probability that a randomly selected abnormal case has a test result more indicative of
abnormality than that of a randomly chosen normal case (Chesters, 1992; Hanley & McNeil,
1982). AUC estimated by the trapezoidal area is equivalent to the Mann-Whitney statistic
(Zou, Tempany, Fielding, & Silverman, 1998).
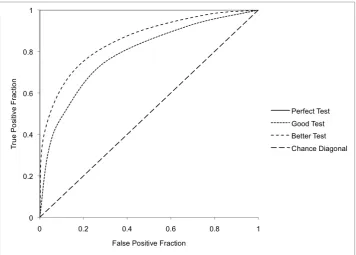
All ROC curves include the trivial operating points of 0,0 and 1,1 that could be calculated by
using the strictest and most lax decision thresholds. The number of points on the confidence
scale determines the number of non-trivial operating points. Typical ROC curve appearances
are shown in Figure 3. A perfect test runs from 0,0 to 0,1 and to 1,1. This covers the entire
plot area and the AUC is equal to 1. The chance diagonal represents the curve of a test that
is no better than random guessing, which means the test is as likely to be incorrect as it is
correct. Tests with high diagnostic accuracy are expected to have an AUC of around 0.9;
[image:33.595.121.478.469.724.2]those with moderate accuracy have an AUC of around 0.75 (Obuchowski, 2000).
Measurements of full AUC give an overall probability that diseased and non-diseased cases
are being correctly classified. However, it can be valuable to look at only a certain portion of
the curve, known as the partial area.
Partial Area
The partial area (pAUC) is frequently defined as the area between two false positive points on the ROC curve (x-axis) (Obuchowski, 2000); this looks at specificity. To look at the high
sensitivity portion of the curve, it is the area between two true positive points (y-axis) that
should be measured. The case has been made for a partial area measure for tests that
require high sensitivity, such as mammography (Jiang et al., 1996). Typically a
measurement of partial area is defined as the area to the left of a specified FPF value to
measure specificity, or above a specified TPF to measure sensitivity (Zanca et al., 2012),
Figure 4.
A full AUC summary implies that all decision thresholds are equally important. Additionally, it
can be distracting to rely on the full AUC measurement when comparing two tests with a
similar figure-of-merit (FOM), since each test may reveal better performance at different
portions of the ROC curve (Zou et al., 2007). The AUC is a FOM to quantify observer
performance for detection tasks and is directly related to the two-alternative forced choice
(2AFC) test (Clarkson & Shen, 2010).
The chest X-ray (CXR) can be used to describe an example where a full area measure may
not be optimal. When looking for solitary pulmonary nodules you want to ensure that the test
has high sensitivity, since overlooking a lesion may have serious consequences for the
patient. In this situation it may be desirable to look at the high sensitivity portion of the curve.
Conversely, it may be of interest to ensure that the test has high specificity; since it would be
undesirable to have patients undergoing high dose follow-up examinations unnecessarily.
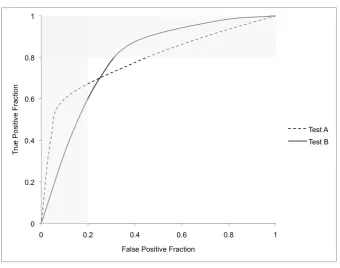
Partial area can be very useful for comparing two tests that have intersecting ROC curves
and a full AUC that is statistically similar. In this situation it can be problematic to determine
which is the better test. An example of intersecting ROC curves and the value of partial area
is presented in Figure 4. Despite the advantages of the partial area measurement, in the
clinical environment one must be mindful of the real clinical impact of one test over another
when interpreting ROC curves. It may be that availability, cost and dose become
Figure 4: Two intersecting ROC curves. Despite having statistically similar summary indices (AUC) the two curves have areas that outperform each other. The vertical grey band below the curves shows that Test A has better specificity. The horizontal grey band to the right of the curves shows that Test B has better sensitivity.
ROC Plot Example
Consider the example of a series of chest X-ray (CXR) images, 100 normal and 100
abnormal (containing a solitary pulmonary nodule). The observer task is to classify the cases
using a rating scale of 1-5, where an increasing number represents a decision of increasing
confidence (Table 3). The sensitivity and specificity is calculated for each decision threshold
using the standard formulae. This is then converted to TPF and FPF so that the ROC curve
can be plotted.
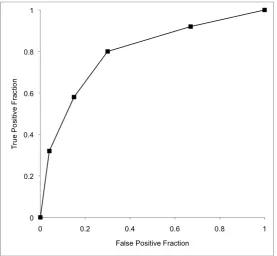
The plotted example shown in Figure 5 is described as the empirical ROC curve, since it is
connected with straight lines. The AUC of the empirical curve can be calculated using the
trapezoidal rule, where empirical estimations have shown that the AUC is equivalent to the
Mann-Whitney U-statistic (Zou et al., 1998). Note the difference to the curves displayed in
Figure 3 and Figure 4. These curves are smooth and continuous, described as fitted,
representing the correctly modelled ROC curve. However, curve fitting should only be used if
there is independence between cases (Chakraborty, 2011). In the empirical work described
in my PhD by PW no curve fitting has been applied for two reasons; (i), the cases are not
independent as they arise from a single phantom, and (ii), the analysis software does not
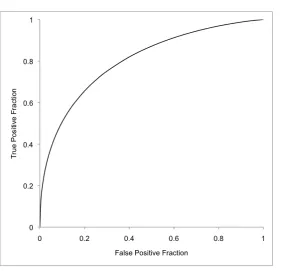
[image:35.595.129.470.65.333.2]The operating points in Table 3 produce an empirical curve with an AUC of 0.794, which can
be calculated using the trapezoidal rule. If independence of cases is assumed and the curve
is fitted using maximum likelihood estimation by a web-based calculator (Eng, 2014) then the
AUC is 0.804, Figure 6. Typically, a computer program will estimate empirical or parametric
area by numerical integration, which in the case of empirical estimations by the trapezoidal
rule, tends to underestimate the true value (Krzanowski & Hand, 2009).
Rating Labels 1 2 3 4 5 TOTALS
TP 8 12 22 26 32 100
FP 33 37 15 11 4 100
>1 >2 >3 >4
Sensitivity (%) 92 80 58 32
Specificity (%) 33 70 85 96
TPF (Sens.) 0.92 0.80 0.58 0.32
[image:36.595.66.530.215.363.2]FPF (1-Spec.) 0.67 0.30 0.15 0.04
Table 3: Example data of 200 CXR images, with 50% containing a solitary pulmonary nodule. Observer decisions are distributed across the scale in the expected manner, with the majority of diseased cases scored with high confidence and the majority of normal cases scored with low confidence.
[image:36.595.161.439.422.678.2]Figure 6: The fitted ROC curve from the rating data in Table 3.
The data in Table 3 have been used to perform curve fitting. If the data are not normally
distributed a parametric calculation (fitted) of area may be misleading and the empirical
method is preferable (Krzanowski & Hand, 2009).
Free-response Receiver Operating Characteristic Analysis
The free-response receiver operating characteristic (FROC) paradigm was first introduced to
radiology in the late 1970’s (Bunch, Hamilton, Sanderson, & Simmons, 1978). The method
then became further developed by the 1990’s (Chakraborty & Winter, 1990). It seeks to
overcome some of the limitations of traditional ROC analysis by incorporating location
sensitive data into the analysis. ROC methods are limited due to an inability to deal with
multiple disease sites effectively; in addition it is also not concerned with localisation and as
such it is possible, indeed likely, that false identifications are treated as true identifications on
diseased cases.
The FROC method shows greater consideration of the radiological search model, where a
global opinion of an image is formed by the observer’s peripheral vision. Areas of the images
deemed suspicious are then given greater attention, where the observer must apply their
not as straightforward in the clinical setting due to an unknown priori assumption of disease
(Chakraborty, 2006).
The FROC method gives due consideration to this and allows observers to make multiple
localisations of disease in each case (Gur & Rockette, 2008); this means that a single case
can contain both correct and incorrect localisations (Chakraborty, 2002). The key aspect of
the FROC method is the ability to reward correct localisations and penalise incorrect
localisations, making efficient use of location information (Chakraborty, 2011b). This method
can have more clinical relevance than the ROC paradigm for focal disease but is a
demanding perceptual task for the observer (Chesters, 1992).
It is relevant to acknowledge some important differences to the ROC paradigm, specifically:
• Cases can contain multiple ratings in FROC studies; only a single rating for each
case in ROC studies
• Cases do not have to be ‘rated’ if the observer believes the case is disease free; a
rating is always applied in ROC
• Individual localisations are classified as correct or incorrect by a proximity criterion
and the risk of false localisations being incorrectly classified is minimal
‘Mark-Rating’ Pairs
Under the FROC paradigm all suspicious areas of an image that exceed the observer’s
reporting criteria threshold are localised; this is termed a ‘mark’. A confidence score
accompanies each mark, in the same way that an entire case is scored in the ROC method;
this is termed the rating. It can be normal for a series of ‘mark-rating’ pairs to be produced
for each case (Chakraborty & Yoon, 2008). ROC studies result in case-based decisions,
whereas FROC studies produce perceived lesion-based decisions.
Proximity Criterion
For a FROC study to be reliable, all localisations should be within a clinically acceptable
distance from the true site of disease (Chakraborty, 2002). Localisations that are close
enough to the true site of disease are classified as lesion localisation (LL) and those that are
too far from the true site are classified as non-lesion localisation (NL) (Chakraborty, 2008;
Zanca et al., 2012). While it is easy to understand LL marks, NL marks can occur for two
reasons, (i) inadequate proximity to the true disease site; and (ii) a failure to identify a lesion.
study, is known as the proximity criterion (Chakraborty, 2006). The choice of criterion is
important; while it is useful to allow some tolerance for localisations due to hand jitter
(observer error in localisation), it must be remembered that the size of the criterion will have
an effect on the figure of merit – less strict criteria lead to an inflated figure of merit (Gur et
al., 2008).
One of the more common criteria used is the acceptance radius. This is applicable to studies
of small spherical lesions, as described in Papers 2, 3, 5 & 7, where the radii length
emanates from the centre of the lesion. For this type of criterion it has been recently
recommended that the size of acceptance radius should be based on the largest lesion in
the study (Haygood et al., 2012). It is also noted that the proximity criterion should be similar
for the modalities being compared as a larger value for one modality may cause a bias
(Chakraborty, 2011b). This can be a complicated issue and it may require that data be
analysed with different sizes of acceptance radii if, for example, the resolution of the imaging
modalities being compared is different. The efficacy of this has been explored in Paper 5.
The FROC Curve
The FROC curve is a plot of non-lesion localisation fraction (NLF, the total number of NL
ratings above a threshold divided by the total number of images), against the lesion
localisation fraction (LLF, which is the total number of LL marks above a threshold divided by
the total number of lesions) (Chakraborty, 2010; Zanca et al., 2012). To clarify, the NLF
(x-axis) is normalised to the number of cases and the LLF (y-(x-axis) is normalised to the number
of lesions (Chakraborty, 2011a). The FROC curve is therefore defined as the plot of
probability of LL against the mean number of NL marks per image as the threshold is
adjusted (Chakraborty & Yoon, 2008).
The FROC curve (Figure 7) always starts at the origin (0,0) and ends at coordinates of (λ,ν),
where λ is the mean number of noise sites (no lesion) per image and ν is the probability that
a lesion is considered for marking (Chakraborty & Yoon, 2008). The FROC curve can have
value for determining whether the observer is making full use of the rating scale; a steep
start to the curve indicates high confidence and the curve should approach a plateau
towards the end of the curve (Chakraborty, 2011a). The FROC curve can extend
continuously and as a result the area below the curve cannot be effectively measured to
provide a summary index. The FROC curve of a perfect observer has area of zero, and
The Alternative FROC (AFROC) Curve
The AFROC curve is a hybrid plot of the ROC and FROC curves. It takes the x-axis from the
ROC curve, FPF, and the y-axis from the FROC curve, LLF. On the AFROC curve the FPF
is the fraction of diseased cases with NL marks. The AFROC curve has much more value
than the FROC curve since it is contained to a plot area of one (1). The area under the
AFROC curve defines the reward for LL marks and penalises for NL marks on the basis of
the confidence score (Haygood et al., 2012). Additionally, the trapezoidal area of the
empirical AFROC curve is equivalent to the jackknife AFROC (JAFROC) figure of merit –
frequently used in the analysis of FROC data.
Raw FROC Data for Curve Construction
Case Lesions LL Ratings NL Ratings Highest Rating
1 1 4 - 4
2 1 - - 0
3 1 3 - 3
4 1 9 - 9
5 1 10 - 10
6 2 3 - - 3
7 0 - - 0
8 1 - 3 3
9 1 - 5 5
10 3 4 - - 3 4
11 3 6 2 - - 6
12 3 10 - - - 10
13 1 10 3, 7 10
14 1 8 8 8
15 2 - - 0
16 2 - - 0
17 3 3 5 - - 5
18 2 10 8 3 10
19 0 - - 0
20 0 - - 0
21 0 - - 0
22 0 - - 0
23 0 - 6 6
24 0 - - 0
25 0 - - 0
26 0 - - 0
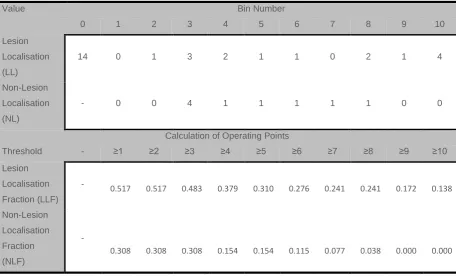
[image:40.595.159.438.256.700.2]Constructing Curves from FROC data
Three types of curve can be constructed from FROC data. This will be illustrated using an
example from Paper 5. The raw FROC data for a single observer is presented in Table 4. In
this study there were 26 cases, 17 abnormal cases containing 29 lesions and 9 normal
cases. Data are then binned (placed into the interval confidence rating and summed). This is
useful if there is a requirement to plot an ROC curve alongside the FROC and AFROC
curves. This may be advantageous if wishing to compare performance on the basis of
lesion-based and case-based decisions. In order to do this from FROC data, one must
determine what the highest rating is on each image – it is the highest rating from which the
ROC curve can be inferred. For TP results the highest rating is the highest rating of all LL
and NL marks on a case; for FP results it is the highest NL rating, since there are no LL
ratings on normal images. This process is also required for AFROC curve construction since
this is a plot of LLF against FPF. The operating points of a highest rating inferred ROC curve
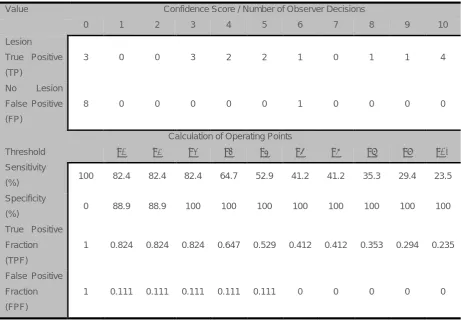
are displayed in Table 5.
Value Confidence Score / Number of Observer Decisions
0 1 2 3 4 5 6 7 8 9 10
Lesion
True Positive
(TP)
3 0 0 3 2 2 1 0 1 1 4
No Lesion
False Positive
(FP)
8 0 0 0 0 0 1 0 0 0 0
Calculation of Operating Points
Threshold
Sensitivity
(%)
≥1 ≥2 ≥3 ≥4 ≥5 ≥6 ≥7 ≥8 ≥9 ≥10
100 82.4 82.4 82.4 64.7 52.9 41.2 41.2 35.3 29.4 23.5
Specificity
(%) 0 88.9 88.9 100 100 100 100 100 100 100 100
True Positive
Fraction
(TPF)
1 0.824 0.824 0.824 0.647 0.529 0.412 0.412 0.353 0.294 0.235
False Positive
Fraction
(FPF)
1 0.111 0.111 0.111 0.111 0.111 0 0 0 0 0
[image:41.595.67.529.378.701.2]