comment
reviews
reports
deposited research
interactions
information
refereed research
Research
Mining microarray expression data by literature profiling
Damien Chaussabel and Alan Sher
Address: Immunobiology Section, Laboratory of Parasitic Diseases, National Institute of Allergy and Infectious Diseases, National Institutes of Health, Bethesda, MD 20892, USA.
Correspondence: Damien Chaussabel. E-mail: [email protected]
Abstract
Background: The rapidly expanding fields of genomics and proteomics have prompted the
development of computational methods for managing, analyzing and visualizing expression data derived from microarray screening. Nevertheless, the lack of efficient techniques for assessing the biological implications of gene-expression data remains an important obstacle in exploiting this information.
Results: To address this need, we have developed a mining technique based on the analysis of
literature profiles generated by extracting the frequencies of certain terms from thousands of abstracts stored in the Medline literature database. Terms are then filtered on the basis of both repetitive occurrence and co-occurrence among multiple gene entries. Finally, clustering analysis is performed on the retained frequency values, shaping a coherent picture of the functional relationship among large and heterogeneous lists of genes. Such data treatment also provides information on the nature and pertinence of the associations that were formed.
Conclusions: The analysis of patterns of term occurrence in abstracts constitutes a means of
exploring the biological significance of large and heterogeneous lists of genes. This approach should contribute to optimizing the exploitation of microarray technologies by providing investigators with an interface between complex expression data and large literature resources. Published: 13 September 2002
GenomeBiology2002, 3(10):research0055.1–0055.16
The electronic version of this article is the complete one and can be found online at http://genomebiology.com/2002/3/10/research/0055 © 2002 Chaussabel and Sher, licensee BioMed Central Ltd (Print ISSN 1465-6906; Online ISSN 1465-6914)
Received: 18 January 2002 Revised: 24 June 2002 Accepted: 18 July 2002
Background
Microarray technologies provide the means of measuring the expression of thousands of genes or proteins simultaneously. This revolution brings new perspectives for the study of expression networks and their regulation, potentially provid-ing valuable insights into the molecular mechanisms underlying disease [1]. Increasingly accessible microarray platforms allow the unrestrained and rapid generation of large expression datasets. As large volumes of data are being generated, the need for data-mining programs that provide the means to manage, normalize, filter, group and visualize expression data expands. These tools help to identify subsets
of genes whose expression changes significantly and orga-nize them according to their expression profiles. Although necessary, this type of analysis does not reveal the biological implications encrypted in expression data. Indeed, the eval-uation of the functional significance of large, heterogeneous and noisy groups of genes constitutes the real challenge for microarray users [2].
specialized investigators is biased and limited to relatively small subsets of genes that become the focus of the expres-sion-data analysis. The definition of functional classes and improved access to information associated with individual genes partly makes up for this lack of perspective. However, information about gene function is primarily contained in the 11 million articles indexed in the Medline database. Evaluating the functional associations that might exist among large groups of genes from this huge volume of liter-ature is not feasible in a time frame compatible with the pace at which the data can be generated. Limitations in our capacity to explore the functional dimension of microarray expression are one of the major impediments to the optimal exploitation of this powerful technology. Surpris-ingly, only a few groups have previously addressed this shortcoming [3-5].
We describe here how a literature-derived term frequency database can be generated and mined through the analysis of patterns of occurrences of a restricted subset of relevant terms. This ‘literature profiling’ produces a coherent picture of the functional relationships among large and heteroge-neous lists of genes and should enable the development of tools for rapidly extracting meaningful knowledge from large microarray expression databases.
Results and discussion
Literature indexingThe method requires articles related to each of the genes included in the analysis to be extracted. This is done by querying the Medline database though PubMed [6] using appropriate search strings. We chose to retrieve entries con-taining the official gene name, abbreviation or aliases in the title field. Information about gene nomenclature can be found on the website of the Human Gene Nomenclature Committee (HGNC [7]). Using this source we created a data-base containing URLs in the PubMed query format for the more than 10,500 known human genes defined by HGNC (for example, for protein kinase C eta: the URL found in the data-base is http://www3.ncbi.nlm.nih.gov/htbin-post/Entrez/ query?db=0&form=1&term=PRKCH+%5Bti%5D+OR+PKC-L+%5Bti%5D+OR+PRKCL+%5Bti%5D+OR+protein%20kin ase%20C%20eta+%5Bti%5D; pointing a web browser to this address gives the 17 entries that would have been retrieved by typing the following search string: ‘PRKCH [ti] OR PKC-L [ti] OR PRKCL [ti] OR protein kinase C eta [ti]’). URL entries are indexed by GenBank [8] and LocusLink [9] IDs and can be downloaded as a Microsoft Excel table (see Additional data files). The search for relevant literature for each individual gene is complicated by the fact that the same gene can have many different names associated with it and that the same name or abbreviation can have different meanings. A rapid scanning of the search results is useful for the identification and removal of inappropriate search strings (see below).
For each gene, the result of the query is downloaded in XML format. Abstracts are then extracted from the file by means of a macro running on Microsoft Excel and saved as a new file to be used for text analysis.
Methodologies described in this report were tested on a list of 70 genes (see Additional data files) derived from a subset of conditions belonging to a sample gene-expression dataset generated to study the transcriptional response of profes-sional antigen-presenting cells to pathogens using high-density oligonucleotide arrays (D. Chaussabel, R. Semnani, M. Mcdowell, D. Sacks, A. Sher and T.B. Nutman, unpub-lished observations). We were able to find at least five rele-vant records in the Medline database containing abstracts for 44 out of the 70 genes listed. Another 10 genes had at least five records with accompanying abstracts when their generic name was used as a search string (for example, ‘interferon induced transmembrane protein’ instead of ‘interferon induced transmembrane protein 1’).
Text analysis
Word occurrence in abstracts is determined for each gene by analyzing the contents of Medline entries (nearly 4,000 in the example presented here). This parameter describes the relative frequency of abstracts containing a given word (for example, 18.2% of the abstracts indexed for the gene GADD45Bcontain the word ‘proliferation’).
Data filtering
Occurrence values are assigned to every unique word found in the literature analyzed, resulting in tens of thousands of entries for each gene. A vast majority of these terms are either found ubiquitously (for example, ‘if’, ‘because’, ‘cell’, ‘identified’ are present in most abstracts of most genes) or very rarely (present in very few abstracts of few genes) and therefore are of very little use for the definition of gene-spe-cific term occurrence profiles. However, a third category of terms can be found in most abstracts of very few genes and convey relevant information about these genes. These terms are characterized both by high occurrence values in gene-specific collections of abstracts and a low baseline occur-rence in the literature.
comment
reviews
reports
deposited research
interactions
information
refereed research
‘activation’, ‘important’). As expected, terms such as ‘a’, ‘we’, ‘protein’ or ‘cells’ had the highest baseline occurrence (92%, 59%, 41% and 39% respectively).
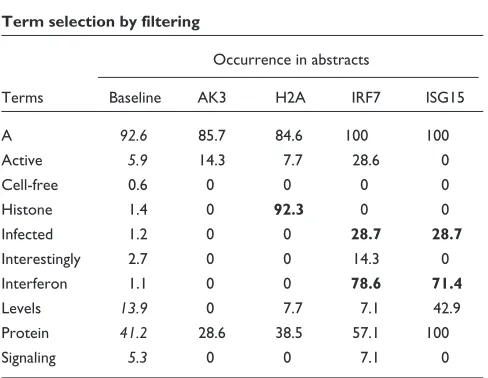
The terms found in thousands of abstracts retrieved for the list of genes considered in this report were filtered systemat-ically using several criteria. The first step consists in remov-ing terms commonly found throughout the scientific literature. A baseline occurrence for each term was deter-mined by taking the average occurrence of the set of 250 randomly picked genes as described in Figure 1. In our example, terms with a baseline occurrence of more than 5% were categorized as undiscriminatory and eliminated (Table 1). In the second step, term-occurrence values for each gene were compared to the baseline. We arbitrarily set the difference cut-off between gene term occurrence and baseline occurrence at 25% (see Table 1). A term can only be useful in defining relationships among genes if it is shared by at least two of them. For this reason, only terms found to pass the filter for at least two of the genes considered for analysis are further retained (see Table 1). For the set of genes used to illustrate the technique (Table 2, and see Addi-tional data files) 101 terms out of nearly 25,000 were retained after application of these filters. Stringency of term
selection can be adjusted at the user’s convenience by modi-fying the filtering parameters. For instance, a greater number of relevant terms might be retrieved by lowering thresholds, insuring term specificity at the cost of increasing the level of noise (less-relevant terms) in the list of terms. When lists of terms become too noisy, the manual removal of irrelevant terms can be considered.
Clustering analysis
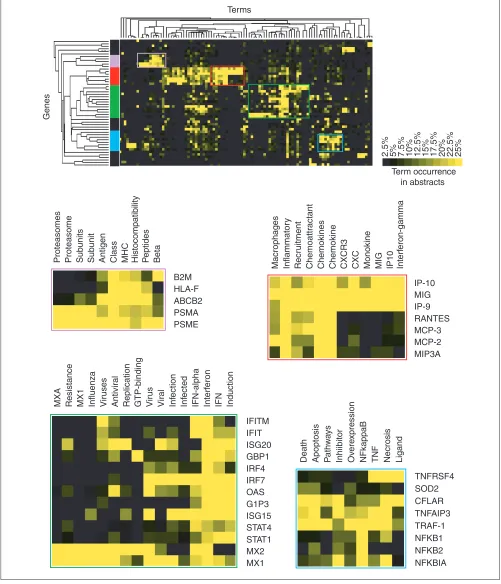
[image:3.609.55.299.85.297.2]Isolating useful information out of tens of thousands of irrel-evant terms closely resembles the task of sorting through gene-expression data produced by microarray technology. But the parallel is not restricted to the filtering of data as we also found that tools used for the analysis of gene expression could be applied to term-occurrence values to identify groups of genes sharing similar ‘literature profiles’. The vocabulary defined after successive rounds of filtering is used to create a term-by-gene array of term-occurrence values relative to each individual gene. Relationships among genes are then assessed by hierarchical clustering analysis using a software package originally created for the analysis of gene-expression data [10]. The resulting clustergram shows the grouping of genes according to patterns of term occurrences (Figure 2). Genes are grouped on the basis of similarity between term-occurrence profiles. The nature of the relationships found through the analysis of term occurrences in abstracts can be Figure 1
Gene-specific and baseline term occurrences in the literature. The literature-mining technique we describe compares term occurrence in a collection of abstracts relating to a specific gene to their occurrence in an unbiased set of abstracts (baseline occurrence in the literature). In the example illustrated here, the occurrence values for terms present in more than 25% of the abstracts relating to the gene RANTES are plotted on the y-axis. To determine baseline occurrence, occurrence values found in the literature concerning this gene are then averaged with values found for an increasing number of genes chosen randomly from all known human genes indexed in the LocusLink database (x-axis). Terms with high occurrence values in the collection of abstracts relating to RANTES and a low baseline occurrence in the literature are plotted in green.
0 50 100 150 200 250
Number of averaged genes used to assess baseline occurrence
Occurrence of ter
ms in abstr
acts
relating to RANTES (%)
0 10 20 30 40 50 60 70 80 90
100 Table 1
Term selection by filtering
Occurrence in abstracts
Terms Baseline AK3 H2A IRF7 ISG15
A 92.6 85.7 84.6 100 100
Active 5.9 14.3 7.7 28.6 0
Cell-free 0.6 0 0 0 0
Histone 1.4 0 92.3 0 0
Infected 1.2 0 0 28.7 28.7
Interestingly 2.7 0 0 14.3 0
Interferon 1.1 0 0 78.6 71.4
Levels 13.9 0 7.7 7.1 42.9
Protein 41.2 28.6 38.5 57.1 100
Signaling 5.3 0 0 7.1 0
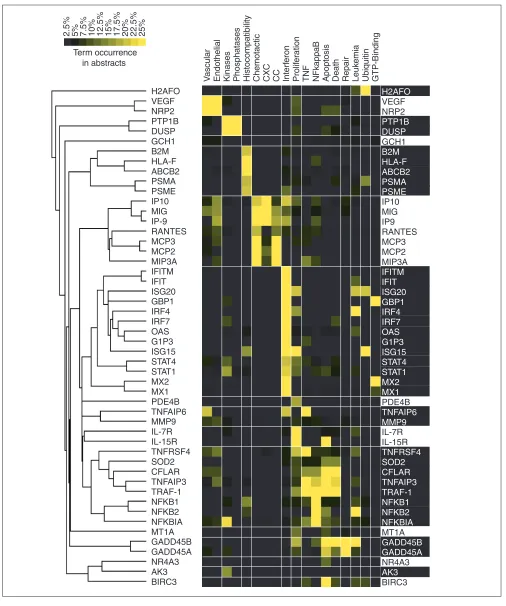
[image:3.609.313.557.99.288.2]determined by browsing this diagram. The relationships among genes listed in Table 2 as determined through the analysis of literature content are represented by the dendro-gram detailed in Figure 3. In this tree diadendro-gram the distance between nodes is inversely proportional to the degree of cor-relation found between the genes. The main ramifications of the tree define the predominant groups identified by this analysis. To help understand the nature of the associations found among groups of genes, occurrence values of a limited number of terms used in the analysis are shown opposite the dendrogram (Figure 3).
It is notable that the functional groups identified in this list of genes significantly induced after infection of professional antigen-presenting cells are related to immune responses. Genes for transcription factors that control inflammatory responses and programmed cell death make up the first gene cluster considered (Figure 2, color coded in blue). These genes have abstracts with a frequent occurrence of terms such as ‘TNF’ (the inflammatory mediator tumor necrosis factor), ‘death’ or ‘apoptosis’. The largest group is composed of genes associated with the term ‘interferon’ (also ‘IFN’ and ‘IFN-alpha’, color coded green, Figure 2); indeed, STATs are factors specifically required for interferon signaling. Inter-feron regulatory factors (IRFs) trigger the interInter-feron response, whereas other members of the group are effector antiviral molecules (for example, ISG15, ISG20) sometimes associated with terms such as ‘virus’, ‘infected’ or ‘infection’ (OAS, Mx1, Mx2). The next group (Figure 2, red) is com-posed exclusively of chemokines. Interestingly, the analysis of abstract contents was able to distinguish monokines belonging to the CXCR family (SCYB chemokines: IP-9, IP-10, MIG; associated with ‘CXC’, ‘CXCR’, ‘monokine’ or ‘MIG’) from CC chemokines (SCYA chemokines: LARC, RANTES, MCP2, MCP3). The last group (Figure 2, violet) is composed of genes involved throughout the MHC class I antigen-presentation pathway. Specifically, these genes encode proteins involved in the degradation of proteins into peptides by the immunoproteasome (PSMAs, PSME), anti-genic peptide loading and transport (ABCB2 also known as TAP1, for transporter associated with antigen processing 1) and presentation at the cell surface (HLA-F, B2M). It is notable that one of the closest pairs formed consists of a receptor-ligand pair: VEGF and NRP2 (Figure 3). Overall, these examples illustrate the concept that appropriate terms taken out of context can still convey valuable information and can be used to rapidly explore and assess the biological meaning of complex datasets.
Analyzing patterns of term occurrence in groups of genes with different degrees of association
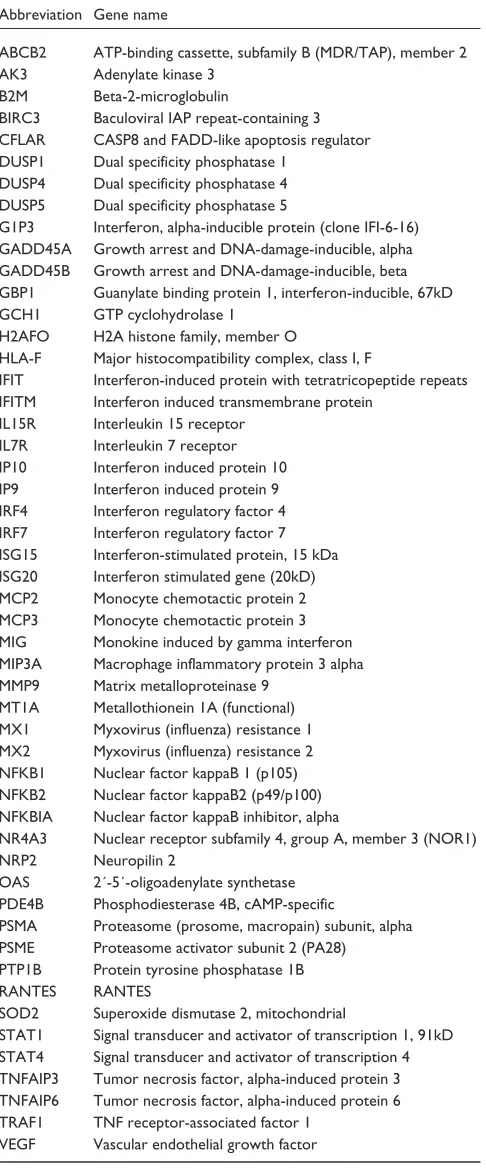
[image:4.609.56.299.131.715.2]The basis for analyzing expression patterns is the assump-tion that genes under common transcripassump-tional control are involved in similar processes [1,11]. This notion provides a rationale for developing tools to evaluate the existence of functional relationships among groups of co-regulated Table 2
List of genes used to illustrate the technique and their abbreviations
Abbreviation Gene name
ABCB2 ATP-binding cassette, subfamily B (MDR/TAP), member 2 AK3 Adenylate kinase 3
B2M Beta-2-microglobulin
BIRC3 Baculoviral IAP repeat-containing 3 CFLAR CASP8 and FADD-like apoptosis regulator DUSP1 Dual specificity phosphatase 1
DUSP4 Dual specificity phosphatase 4 DUSP5 Dual specificity phosphatase 5
G1P3 Interferon, alpha-inducible protein (clone IFI-6-16) GADD45A Growth arrest and DNA-damage-inducible, alpha GADD45B Growth arrest and DNA-damage-inducible, beta GBP1 Guanylate binding protein 1, interferon-inducible, 67kD GCH1 GTP cyclohydrolase 1
H2AFO H2A histone family, member O
HLA-F Major histocompatibility complex, class I, F
IFIT Interferon-induced protein with tetratricopeptide repeats IFITM Interferon induced transmembrane protein
IL15R Interleukin 15 receptor IL7R Interleukin 7 receptor IP10 Interferon induced protein 10 IP9 Interferon induced protein 9 IRF4 Interferon regulatory factor 4 IRF7 Interferon regulatory factor 7 ISG15 Interferon-stimulated protein, 15 kDa ISG20 Interferon stimulated gene (20kD) MCP2 Monocyte chemotactic protein 2 MCP3 Monocyte chemotactic protein 3 MIG Monokine induced by gamma interferon MIP3A Macrophage inflammatory protein 3 alpha MMP9 Matrix metalloproteinase 9
MT1A Metallothionein 1A (functional) MX1 Myxovirus (influenza) resistance 1 MX2 Myxovirus (influenza) resistance 2 NFKB1 Nuclear factor kappaB 1 (p105) NFKB2 Nuclear factor kappaB2 (p49/p100) NFKBIA Nuclear factor kappaB inhibitor, alpha
NR4A3 Nuclear receptor subfamily 4, group A, member 3 (NOR1) NRP2 Neuropilin 2
OAS 2´-5´-oligoadenylate synthetase PDE4B Phosphodiesterase 4B, cAMP-specific
PSMA Proteasome (prosome, macropain) subunit, alpha PSME Proteasome activator subunit 2 (PA28) PTP1B Protein tyrosine phosphatase 1B RANTES RANTES
SOD2 Superoxide dismutase 2, mitochondrial
STAT1 Signal transducer and activator of transcription 1, 91kD STAT4 Signal transducer and activator of transcription 4 TNFAIP3 Tumor necrosis factor, alpha-induced protein 3 TNFAIP6 Tumor necrosis factor, alpha-induced protein 6 TRAF1 TNF receptor-associated factor 1
VEGF Vascular endothelial growth factor
comment
reviews
reports
deposited research
interactions
information
[image:5.609.55.556.89.673.2]refereed research
Figure 2
Analysis of patterns of term occurrence in abstracts. After filters have been applied to the original list, selected term-occurrence values relating to each gene are analyzed. Terms (columns) and genes (rows) were grouped on the basis of similarities between patterns of term occurrence in abstracts by hierarchical clustering. Some of the areas of the clustergram are shown in detail. Clusters are further referenced by color codes: blue, ‘nuclear factors’; orange, ‘receptor-ligand pair’; green, ‘interferon-related’; red, ‘chemokines’; violet, ‘MHC class I antigen-presentation pathway’. Shades of yellow indicate different levels of term occurrence in abstracts.
Proteasomes Proteasome Sub
units
Sub
unit
Antigen Class MHC Histocompatibility Peptides Beta
B2M HLA-F ABCB2 PSMA PSME
Macrophages Inflammator
y
Recr
uitment
Chemoattr
actant
Chemokines Chemokine CXCR3 CXC Monokine MIG IP10 Interf
eron-gamma
IP-10 MIG IP-9 RANTES MCP-3 MCP-2 MIP3A
MXA Resistance MX1 Influenza Vir
uses
Antivir
al
Replication GTP-binding Vir
us
Vir
al
Inf
ection
Inf
ected
IFN-alpha Interf
eron
IFN Induction
IFITM IFIT ISG20 GBP1 IRF4 IRF7 OAS G1P3 ISG15 STAT4 STAT1 MX2 MX1
TNFRSF4 SOD2 CFLAR TNFAIP3 TRAF-1 NFKB1 NFKB2 NFKBIA
Death Apoptosis Pathw
a
ys
Inhiibitor Ov
ere
xpression
NFkappaB TNF Necrosis Ligand DUSP 1, 4, 5
Terms
Genes
Term occurrence in abstracts
Figure 3
Annotated dendrogram obtained by clustering term-occurrence values relative to each gene. The corresponding clustergram is shown in Figure 2. Genes are arranged according to patterns of term occurrence. Distances between nodes of the tree diagram indicate the degree of association between genes or groups of genes. A subset of representative terms used in the analysis was chosen to annotate this list of genes. Shades of yellow indicate different levels of term occurrence in abstracts. Table 1 lists the gene abbreviations used.
V
ascular
Endothelial Kinases Phosphatases Histocompatibility Chemotactic CXC CC Interf
eron
Prolif
er
ation
TNF NFkappaB Apoptosis Death Repair Leuk
emia
Ubiquitin GTP-Binding
H2AFO VEGF NRP2 PTP1B DUSP GCH1 B2M HLA-F ABCB2 PSMA PSME IP10 MIG IP-9 RANTES MCP3 MCP2 MIP3A IFITM IFIT ISG20 GBP1 IRF4 IRF7 OAS G1P3 ISG15 STAT4 STAT1 MX2 MX1 PDE4B TNFAIP6 MMP9 IL-7R IL-15R TNFRSF4 SOD2 CFLAR TNFAIP3 TRAF-1 NFKB1 NFKB2 NFKBIA MT1A GADD45B GADD45A NR4A3 AK3 BIRC3
H2AFO
VEGF NRP2
PTP1B DUSP
GCH1
B2M HLA-F ABCB2 PSMA PSME
IP10 MIG IP9 RANTES MCP3 MCP2 MIP3A
IFITM IFIT ISG20 GBP1 IRF4 IRF7 OAS G1P3 ISG15 STAT4 STAT1 MX2 MX1
PDE4B
TNFAIP6 MMP9
IL-7R IL-15R
TNFRSF4 SOD2 CFLAR TNFAIP3 TRAF-1 NFKB1 NFKB2 NFKBIA
MT1A
GADD45B GADD45A
NR4A3
AK3
BIRC3 Term occurrence
in abstracts
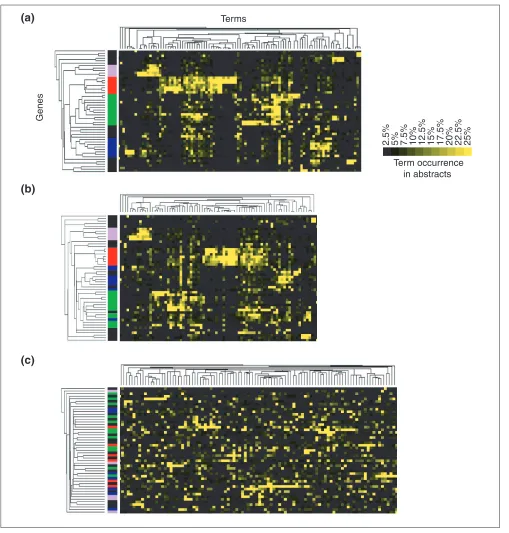
genes. In the group of 50 co-induced genes in our example, we found that 101 terms were shared by at least two genes (according to our filtering criteria) with as many as 300 pos-itive associations between genes and terms (defined as exceeding baseline occurrence by 25%). For comparison, analysis of the literature relative to 50 genes picked ran-domly from all known human genes indexed in the LocusLink database only retrieved 49 shared terms and 109 associations (Figure 4b). This is in contrast with the 116 shared terms and 523 associations found when 50 genes are picked randomly from a homogenous functional group (all known cytokines and chemokines and their receptors, Figure 4c). As shown by this example, the number of associ-ations found by literature profiling correlates with the likeli-hood that a group of genes is functionally related.
Conditions for the formation of ‘meaningful’ gene clusters
We sought to identify the critical elements leading to the for-mation of clusters of related genes described in Figure 2 and represented in Figure 5a using similar color codes. The terms making up each gene’s ‘literature profile’ include gene names or words making up gene names. To meet our filter-ing criteria each term must have had a high occurrence in the literature of at least two of the genes covered by the analysis. To test the relative importance of such terms for the analysis, gene names and term-occurrence values were clustered without gene names (for example, RANTES, IP10, NFkappaB, STAT, IRF) or terms included in gene names (for example, interferon, proteasome, regulatory, monokine). As shown in Figure 5b, clusters were largely conserved. Gene names or terms included in gene names are therefore not necessary for the formation of meaningful clusters but may have a significant role: terms such as ‘NFkappaB or ‘inter-feron’, which are found throughout the literature on genes involved in these pathways, will generate valid associations. Similarly, the discovery of references to the chemokine ‘RANTES’ in abstracts relevant to different genes suggests the existence of a functional link. Indeed, the literature-mining tool developed by Jenssen et al. [5] is based on a gene co-citation network and therefore relies entirely on the same type of association.
To exclude the possibility that groups of meaningful genes may arise by using a sufficient number of co-occurring terms, we permuted term-occurrence values for each gene before clustering (Figure 5c). The fact that this treatment results in a complete loss of the original hierarchy proves that the formation of meaningful groups of genes cannot be attributed to a clustering artifact.
Literature profiling of large gene lists
The size of the list of genes that must be analyzed can vary greatly from one microarray experiment to another. In an ideal setting, the analysis of gene-expression patterns groups co-regulated genes into small subsets. In most cases,
however, partitioning of the data on the basis of expression is impaired by a small number of conditions or straightforward expression profiles. As a consequence, microarray experi-ments often generate lists of several hundred genes for which biological meaning must be sought. The use of a mining tech-nique such as the one described here will be most valuable in this context. In this section we give two examples of literature profiles generated from published datasets.
When a large number of genes are analyzed, the level of noise (less-specific terms) can be more important, and filter-ing criteria were adjusted accordfilter-ingly. The fixed 25% cut-off we used in our previous example can be too high for a gene represented by hundreds of abstracts but can also be rela-tively low when considering a gene for which only five abstracts could be retrieved. To take such discrepancies into account we optimized the cut-off for each gene as follows: cut-off = t+ (k/n) where tis the minimum threshold, kis a constant and n is the number of abstracts retrieved for a given gene; tand kmust be set arbitrarily and will directly influence resolution and noise levels. For these examples we chose t= 15% and k= 1.5, therefore cut-off values for genes represented by 5 or 100 abstracts are 45% and 16.5% respec-tively. The gene-term specificity was further improved by adding a filter that removes terms present in the vocabulary of more than half of the genes considered (for example, ‘bound’, ‘contained’, ‘clones’, ‘putative’, ‘process’). Such a filter is particularly appropriate for large datasets, as the chance of less-specific terms being retained by other filters increases with the number of genes analyzed. The functional heterogeneity inherent in large gene lists eliminates the risk of relevant terms being removed by this filter. Similar themes were identified when the cut-off applied in the previ-ous example is used instead. However, increasing the strin-gency of the filter resulted in a tighter clustering of large datasets. In these examples we eliminated redundant singu-lar/plural forms by averaging term-occurrence values derived from both entries (considering, for instance, ‘lipoprotein’ and ‘lipoproteins’ as a single entity).
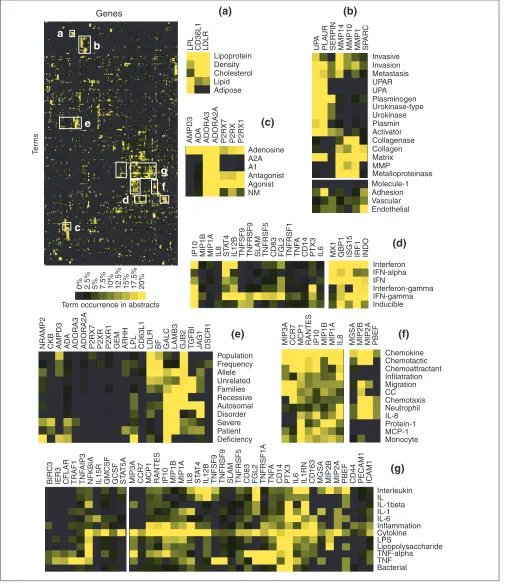
In the first dataset a list of nearly 200 genes and expressed sequence tags (ESTs) that constitutes the human macrophage ‘common transcriptional program’ induced upon bacterial infection [12] is analyzed. Sufficient publica-tions could be retrieved for 147 of these genes (see Addi-tional data files). Patterns of term occurrence appear once gene names have been rearranged by hierarchical clustering (Figure 6). The existence of functional relationships between genes can be inferred from the visual analysis of the resulting clustergram (Figure 6, top left panel). Putative relationships are then confirmed by investigating the few relevant publications pinpointed by the analysis of litera-ture profiles.
Several groups of genes involved in different aspects of the immune response to an infection were uncovered by literature
comment
reviews
reports
deposited research
interactions
information
Figure 4
The degree of association found among groups of genes by literature profiling correlates with their likelihood of being related.(a)The clustergram resulting from the analysis of the list of co-induced genes used to illustrate the mining technique is given for comparison. (b)A group of 50 genes was picked at random from all known human genes listed in the LocusLink database and their literature content was analyzed. (c)A group of 50 genes was picked at random from the list of known interleukins, chemokines and chemokine receptors and subjected to a similar analysis. The number of positive gene-term associations retained after filtering (term occurrence for a given gene higher than the baseline by 25%) is shown for each group. Numbers of shared terms for (a), (b) and (c), was 101, 49 and 116, respectively.
300 associations
109 associations
523 associations
Terms
Genes
Term occurrence in abstracts
2.5% 5% 7.5% 10% 12.5% 15% 17.5% 20% 22.5% 25%
(a)
(b)
profiling (interferon response, chemotaxis, inflammation: Figure 6d,f, and g, respectively). But many other functional groups were also identified as follows.
As indicated by their names, lipoprotein lipase (LPL) and low-density lipoprotein receptor (LDLR) genes are involved
in lipid and cholesterol metabolism and were logically comment
reviews
reports
deposited research
interactions
information
[image:9.609.55.564.140.673.2]refereed research
Figure 5
Conditions for the emergence of groups of related genes. (a)Groups of related genes found by clustering term-occurrence values. The color code is similar to the one used in Figure 2. (b)Grouping is conserved after gene names or terms making up gene names are removed from the analysis (for example, NFkappaB, RANTES, interferon, vascular, MIG). (c)Associations shown in (a) disappear when occurrence values are permuted for each of the genes, suggesting that associations made through the analysis of patterns of term occurrence do not arise by chance from a sufficiently high number of co-occurring terms.
Terms
Genes
Term occurrence in abstracts
2.5% 5% 7.5% 10% 12.5% 15% 17.5% 20% 22.5% 25%
(a)
(b)
Figure 6
Profiling the bacteria-induced macrophage activation program. Literature profiles were generated for a list of nearly 200 genes constituting the ‘common transcriptional program’, induced in human macrophages upon bacterial infection ([12], see also Additional data files). The clustergram generated for the analysis of patterns of term occurrence is shown at top left. (a-g)Detailed views for groups of genes (columns) sharing a common vocabulary (rows). Groups of terms were selected on the basis of clustering hierarchy whereas the number of genes shown in the inserts is arbitrary. For gene abbreviations see Additional data files.
0% 2.5% 5% 7.5% 10% 12.5% 15% 17.5% 20%
Term occurrence in abstracts
a
b
c
d
f
g
e
Te
rm
s
LPL CD36L1 LDLR
Lipoprotein Density Cholesterol Lipid Adipose
UP
A
PLA
UR
SERPIN MMP14 MMP10 MMP1 SP
ARC
Invasive Invasion Metastasis UPAR UPA Plasminogen Urokinase-type Urokinase Plasmin Activator Collagenase Collagen Matrix MMP
Metalloproteinase Molecule-1 Adhesion Vascular Endothelial Adenosine
A2A A1 Antagonist Agonist NM
AMPD3 AD
A
ADORA3 ADORA2A P2RX7 P2RX P2RX1
MX1 GBP1 ISG15 IRF1 INDO
Interferon IFN-alpha IFN
Interferon-gamma IFN-gamma Inducible
IP10 MIP1B MIP1A IL8 STAT
4
IL12B TNFSF9 TNFRSF9 SLAM TNFRSF5 CD83 FGL2 TNFRSF1 TNF
A
CD14 PTX3 IL6
Population Frequency Allele Unrelated Families Recessive Autosomal Disorder Severe Patient Deficiency
NRAMP2 CKB AMPD3 AD
A
ADORA3 ADORA2A P2RX7 P2XR P2XR1 GEM ARHH LPL CD63L1 LDLR BF GALC LAMB3 GJB2 TGFBI JA
G
1
DSCR1 MIP3A CCR7 MCP1 RANTES IP10 MIP1B MIP1A IL8
Chemokine Chemotactic Chemoattractant Infilatration Migration CC Chemotaxis Neutrophil IL-8 Protein-1 MCP-1 Monocyte
MGSA MIP2B MIP2A PBEF
MIP3A CCR7 MCP1 RANTES IP10 MIP1B MIP1A IL8 STAT
4
IL12B TNFSF9 TNFRSF9 SLAM TNFRSF5 CD83 FGL2 TNFRSF1A TNF
A
CD14 PTX3 IL6 IL1RN CD163 MGSA MIP2B MIP2A PBEF CD44 PECAM1 ICAM1
Interleukin IL IL-1beta IL-1 IL-6 Inflammation Cytokine LPS
Lipopolysaccharide TNF-alpha TNF Bacterial
BIRC3 IER3 CFLAR TRAF1 TNF
AIP3
NFKBIA IL15R GMCSF GCSF ST
A
T5A
Genes
(a)
(b)
(c)
(d)
(e)
(f)
associated by literature profiling (Figure 6a). Interestingly, the CD36-like 1 antigen (alias thrombospondin receptor-like 1 - CD36L1) clustered tightly with LPL and LDLR and shared with these genes terms such as ‘lipoprotein’, ‘lipid’ or ‘cho-lesterol’ (Figure 6a). This association was validated by browsing the literature relevant to CD36L1 whch contains reports showing the role of this molecule as a receptor for high-density lipoprotein.
The two major groups of proteinases involved in extracellu-lar matrix degradation - serine proteinases and metallopro-teinases - have been grouped by literature profiling (Figure 6b: urokinase plasminogen activation cascade (UPA, PLAUR, SERPIN) and matrix metalloproteinases (MMP14, MMP10, MMP1)). Both families are activated during inflam-mation and, as indicated by their literature profiles, are involved in tumor invasion and metastasis [13,14]. In the context of a bacterial infection these proteins enable acti-vated macrophages to cross endothelial barriers and gain access to the site of the infection [15,16] (other terms shared by these genes are ‘migration’, ‘vascular’, ‘endothelial’). An extracellular-matrix-binding protein, SPARC (secreted protein, acidic, cysteine-rich, alias osteonectin), was also associated with these proteinases by literature profiling. SPARC can increase endothelial permeability and is known to participate in tumor angiogenesis and extravasation [17]. Interestingly, this protein has not been reported as being upregulated upon cell infection and its possible role in macrophage transendothelial migration was never addressed. This example illustrates how functional relationships that could not be deduced from gene names were uncovered through the analysis of patterns of term occurrence: matrix metalloproteinases (MMP1, 10, 14) and urokinase plasmino-gen activator (UPA, SPARC) are matrix-interacting molecules involved in tumor invasion and metastasis.
The cluster shown in Figure 6c is composed of members of two genes families: adenosine receptors (ADORA3 and ADORA2A) and purinergic receptors (P2RX1 and P2RX7). Indeed, although not evident from its name, P2RX acts as a receptor for a phosphorylated form of adenosine (adenosine triphosphate).
Another interesting example where non-obvious associa-tions were revealed by literature profiling is shown in Figure 6e. This group consists of genes for which related abstracts have in common terms such as ‘disorder’, ‘allele’, ‘recessive’ or ‘autosomal’. This shared vocabulary is indica-tive of an association that, given the diversity of genes impli-cated, would have undoubtedly been overlooked by the mere examination of the gene list. Indeed, a rapid search of the Online Mendelian Inheritance in Man database (OMIM [18]) for genes associated with the terms ‘severe’ and ‘disor-der’ confirmed that mutations of GALC, LAMB3, GJB2, JAG1, TGFBI, LPL and LDLR were the origin of serious dis-orders: Krabbe disease, Herlitz junctional epidermolysis
bullosa, autosomal dominant deafness - Vohwinkel syn-drome, Alagille synsyn-drome, corneal dystrophy, type I hyper-lipoproteinemia and hypercholesterolemia, respectively. In addition, two genes sharing a similar vocabulary could be found outside the region outlined in Figure 6e: GCDH (linked to glutaric acidemia type I) and MPI (linked to car-bohydrate-deficient glycoprotein syndrome, type Ib).
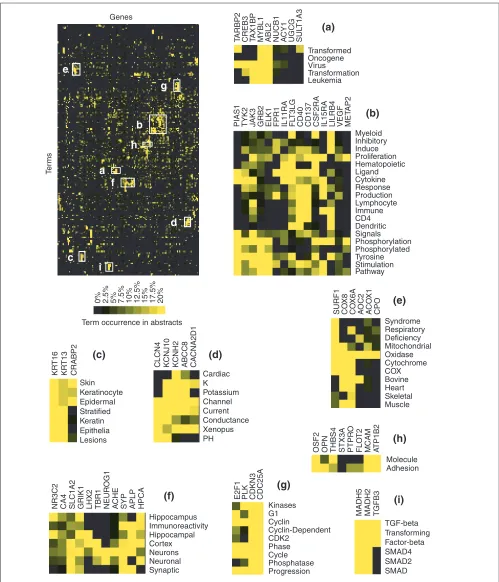
Literature profiles were generated for a second large dataset consisting of the 200 genes and ESTs found to be the most differentially regulated in classic versus desmoplastic medulloblastomas in a study of central nervous system tumors [19]. At least five references were found for 137 of the genes listed (see Additional data files). In contrast to the previous example, gene expression in this case was not mea-sured for a purified cell population but for heterogeneous tumor tissue. This fact is reflected in the analysis of litera-ture profiles, as groups of genes could be found to be associ-ated with brain tissues (Figure 7f, for example, HPCA (hippocalcin), SYP (synaptophysin), GRIK1 (glutamate receptor, ionotropic, kainate 1), APLP (amyloid beta A4 pre-cursor-like protein)), immune cells (Figure 7b, for example, CD40, IL15RA (IL-15 receptor, alpha chain), LILB4 (leuko-cyte immunoglobulin-like receptor 4)) or tumor cells (Figure 7a, for example, MYBL1 (v-mybavian myeloblastosis viral oncogene), ABL2 (v-ablAbelson murine leukemia viral oncogene homolog 2)). Interestingly, three genes whose products are known to promote viral replication were associ-ated with v-myband v-abloncogenes (shared terms: ‘virus’, ‘transformation’ or ‘leukemia’): TAX1BP1 (Tax1-binding protein 1), CREB3 (cAMP-response element binding protein 3/LZIP) and TARBP2 (TAR-binding protein 2) (Figure 7a) [20-22]. These proteins could have a potentially important role in the regulation of cell growth, as TAX1BP, CREB3 and TARBP possess anti-apoptotic, tumor suppressor and onco-genic activities [23-25], respectively. Another group of genes encoding three enzymes (PLK (Polo-like kinase), CDKN3 (cyclin-dependent kinase inhibitor 3/p27-Kip1), CDC25A (cell division cycle 25A)) and a transcription factor (E2F1, E2F transcription factor 1) involved in the control of the cell cycle were grouped (Figure 7g). All three enzymes have been found to be overexpressed in tumors of various origins [26-28]. Other groups of functionally related genes are shown in Figure 7: some are ion channels (Figure 7d, whereas others are associated with keratinocytes (Figure 7c) or involved in the respiratory chain (Figure 7e). A wide diversity of adhesion molecules was also identified (Figure 7h). These included the obvious - MCAM (melanoma cell adhesion molecule) - but also ATP1B2 (ATPase, Na+/K+
transporting, beta 2 polypeptide, which is believed to func-tion in neuron-astrocyte adhesion [29,30]), THBS (throm-bospondin, an adhesion molecule involved in blood clotting), OPN (osteopontin, which promotes osteoclast adhesion [31]) and OSF2 (osteoblast-specific factor 2, a human homolog of the insect protein fasciclin thought to have a role in bone adhesion [32]). Finally, as shown in
comment
reviews
reports
deposited research
interactions
information
Figure 7
Profiling classic medulloblastomas. Literature profiles were generated for a list of 200 genes found to be differentially expressed by classic versus desmoplastic medulloblastomas in a study of central nervous system embryonal tumors recently published by Pomeroy et al. ([19] and see Additional data files). The clustergram generated for the analysis of patterns of term occurrence is shown at top left. (a-i)Detailed views for groups of genes (columns) found to share a common vocabulary (rows). Groups of terms were selected on the basis of clustering hierarchy, whereas the number of genes shown in the inserts is arbitrary. For gene abbreviations see Additional data files.
0% 2.5% 5% 7.5% 10% 12.5% 15% 17.5% 20%
Term occurrence in abstracts
T
ARBP2 CREB3 TAX1BP MYBL1 ABL2 NUCB1 ACY1 UGCG SUL
T1A3
Transformed Oncogene Virus Transformation Leukemia
a
b
c
e
f
g
d
Genes
Te
rm
s
Myeloid Inhibitory Induce Proliferation Hematopoietic Ligand Cytokine Response Production Lymphocyte Immune CD4 Dendritic Signals Phosphorylation Phosphorylated Tyrosine Stimulation Pathway
PIAS1 TYK2 JAK3 GRB2 ELK1 FPR1 IL11RA FL
T3LG
CD40 CD137 CSF2RA IL15RA LILRB4 VEGF MET
AP2
KR
T16
KR
T13
CRABP2
Skin Keratinocyte Epidermal Stratified Keratin Epithelia Lesions
CLCN4 KCNJ10 KCNH2 ABCC8 CA
CNA2D1
Cardiac K Potassium Channel Current Conductance Xenopus PH
Syndrome Respiratory Deficiency Mitochondrial Oxidase Cytochrome COX Bovine Heart Skeletal Muscle
SURF1 CO
X8
CO
X6A
A
OC2
AC
O
X
1
CPO
Kinases G1 Cyclin
Cyclin-Dependent CDK2
Phase Cycle Phosphatase Progression
E2F1 PLK CDKN3 CDC25A
Hippocampus Immunoreactivity Hippocampal Cortex Neurons Neuronal Synaptic
NR3C2 CA4 SLC1A2 GRIK1 LHX2 TBR1 NEUR
OG1
A
CHE
SYP APLP HPCA
Molecule Adhesion
OSF2 OPN THBS4 STX3A PTPR
O
FLO
T2
MCAM ATP1B2
TGF-beta Transforming Factor-beta SMAD4 SMAD2 SMAD
MADH5 MADH2 TGFB3
i
h
(a)
(b)
(c)
(d)
(e)
(f)
(g)
(h)
Figure 7i, MADH2 and MADH5 (mothers against decapenta-plegic homolog 2 and 5) shared with TGFB3 (transforming growth factor beta 3) terms such as ‘TGF-beta’, transform-ing’ and ‘factor beta’, reflecting the involvement of MADH in the signaling pathway of TGF-beta family members [33].
Taken together, these examples demonstrate the power of the analysis of literature profiles in revealing unsuspected func-tional relationships in large and heterogeneous lists of genes.
Benefits and limitations
The mining technique we describe is designed to guide the interpretation of complex expression databases. Key aspects of the technique contributing to the fulfillment of this goal include. The method is independent of the user’s knowledge of gene function and can therefore be used to identify promising findings rapidly in an unbiased way. The method renders the data intelligible by bringing functional coher-ence to large and heterogeneous lists of genes. The terms used as criteria to explore relationships among genes differ with the composition of the group of genes considered for analysis. Because the basis for classifying genes is flexible, associations made between them will change with the context in which they are found. The technique is based on the analysis of the content of scientific publications and con-stitutes a contemporary solution for the exploitation of swelling literature resources by providing investigators with leads for further in-depth investigation of the literature. Term-occurrence data derived from literature profiling can be used to annotate heterogeneous gene lists, thus adding to the value of this technique as a visualization tool (Figure 3).
The implementation of our mining technique as a computa-tional tool is hindered by the need to retrieve the relevant lit-erature reliably for each gene included in the analysis. Indeed, gene-by-gene editing of automatically generated PubMed query strings is often required to insure low levels of false positives among the abstracts retrieved. Several names and abbreviations are often associated with a single gene but are used in a different context (for example, to des-ignate drugs, bacterial strains or medical procedures), or they belong to the English vocabulary (e.g. ‘Wars’ = ‘trypto-phanyl-tRNA synthetase’, ‘Sky’ = ‘TYRO3 protein tyrosine kinase’, ‘God’ = ‘Godzilla’). Short acronyms are especially problematic (for example, ‘CT’, the abbreviation for ‘calci-tonin’ can be found in the title of over 20,000 abstracts, of which only 25 contain the term ‘calcitonin’). Parsing issues that are caused by a confusing gene nomenclature can, however, be avoided when curated literature resources are available (for example, the Yeast Literature Database [34]).
The reduction of the information contained in the litera-ture is also limiting. Words taken out of their context convey useful but limited information, and this superficial assessment of the literature can only be used to direct further investigation. The selection of terms through
rounds of filtering inevitably results in the selection of irrel-evant terms (false positives), and pertinent terms will also be lost (false negatives). Reviewing the terms and literature that prompted the definition of relationships among genes can easily identify false-positive associations. False-negative associations are harder to identify and can only be kept to a minimum by combining existing approaches designed to assess the biological significance of large sets of genes. Like the other literature-mining approaches previously pub-lished, our technique cannot be expected to give definitive answers, but nonetheless provides investigators with much-needed solutions for the functional evaluation of complex microarray data [35].
Relatively few groups have attempted to resolve the bottle-neck constituted by the inability of highly specialized investi-gators to assess the existence of relationships between genes in a high-throughput fashion [3-5]. Jenssen et al. [5] ana-lyzed literature contents to create a gene-to-gene co-citation network revealing associations between genes. Our tech-nique differs fundamentally from Jenssen et al.’s method in that it is based on term occurrences in indexed abstracts as opposed to gene name co-citation frequencies. This approach allowed us to take advantage of the powerful algo-rithms used for the analysis of patterns of gene expression. Also, this literature-profiling method should benefit from ongoing efforts to improve visualization tools, clustering techniques, and associated statistics [36,37]. Another major advantage arises from the capacity to include any of the terms present in abstracts, resulting in a considerable increase in the number of potential relationships generated. Finally, the number of genes covered by this type of analysis is also much greater, thanks to the low requirements in the volume of literature associated with each gene.
Text-mining software is also available commercially. Omniviz [38], one of the most advanced solutions for the analysis of the scientific literature, can group publications (or patents or any other kind of text entries) associated with a common theme (for example, Alzheimer’s disease) through the analysis of their content. In contrast, our mining algo-rithm was specifically designed to group genes (instead of publications) through the analysis of the content of their associated literatures. This conceptual difference makes the techniques distinct from one another. Our approach requires the literature to be indexed for each gene and treated sepa-rately throughout the analysis. We also filter terms using stringent criteria, a critical step that allows the analysis of patterns of term occurrences by hierarchical clustering.
Applications and perspectives
This report constitutes a proof of principle on the feasibility and use of literature profiling for high-throughput research. Although room exists for improvements in indexing, filter-ing and clusterfilter-ing strategies, the methodology described provides a blueprint for the development of computational
comment
reviews
reports
deposited research
interactions
information
tools that can rapidly assess literature content to guide the biological interpretation of complex expression data. Because this literature-mining technique analyzes data at a high level it is independent of the platform used by investi-gators (for example, spotted cDNA or high-density oligonu-cleotide arrays, protein arrays) and could find applications in both genomics and proteomics research.
In addition to providing help to explore large expression datasets, occurrence values displayed for certain terms in the format used in Figure 3 can be used to annotate large and complex lists of genes, providing readers with information on gene function. In our example, giving occurrence values for terms such as ‘apoptosis’, ‘endothelial’, ‘interferon’, ‘inflammatory’ ‘chemoattractant’ or ‘histocompatibility’ pro-vides a ‘naive’ reader with insight into the function attrib-uted in the literature to each of the listed genes.
Associating literature profiles with gene-expression data could be used for orienting gene discovery. It is believed that co-regulated genes share similar promoters and/or are involved in similar biological processes [1]. Using this princi-ple of ‘guilt by association’, functions attributed to known genes can be inferred for unknown genes sharing similar expression profiles. In the first example used in this report (see Additional data files), many of the genes were identified using literature profiles as being related to ‘interferon’, ‘virus’ and ‘infection’, and thus it can be assumed that some of the genes and ESTs that were not included in the analysis from lack of literature (see Additional data files) are also associated with these terms. For instance, among the co-reg-ulated ESTs is the ‘Homo sapiens cig5 mRNA, partial sequence’ (AF026941), which was obtained using differen-tial display analysis to identify sequences for which tran-scription is induced following cytomegalovirus infection [39]. Another co-regulated but poorly studied gene is ‘secreted and transmembrane 1’ (U77643), which resembles a cytokine or growth factor in its broad structural character-istics [40]. This gene was later reported to be the ligand for the surface antigen CD7 and found to be capable of activat-ing NK cells [41], which constitute the primary source of IFN-gamma during early responses to infection [42]. In both examples the link to ‘interferon’, ‘virus’ or ‘infection’ can only be suspected, but certainly deserves attention because these sequences are regulated together with genes known to be involved in the biology of interferons.
Conclusions
The sequencing of whole genomes and the introduction of technologies capable of measuring simultaneously the expression of thousands of genes provides biological research with a global perspective that opposes the trend over the past few decades of the narrowing into highly spe-cialized research fields. But the optimal exploitation of these invaluable resources by researchers necessitates the
develop-ment of mining tools to explore and interpret data in a time frame compatible with the impressive rate at which they are generated. Individual knowledge is built on associations made between the information we acquire from the litera-ture. The method we describe here mimics this learning process by associating meaningful terms found in scientific publications to create a coherent picture of the relationships that exist within complex groups of genes. Because this analy-sis is performed independently of knowledge of gene function it provides a means of rapidly probing the biological signifi-cance of complex expression data in an unbiased fashion.
Materials and methods
Literature indexingRelevant literature was retrieved for each gene by querying Medline for entries containing gene names or abbreviations or aliases. The URL database used to generate basic PubMed search strings for human genes can be downloaded (see Addi-tional data files). The database is indexed by LocusLink [9] and GenBank IDs [8]. Most search strings must be edited on a gene-by-gene basis, as a vast majority of publications do not adhere to the official nomenclature and gene names and abbreviations in use can differ from the aliases provided by HGNC or lack specificity (see discussion in ‘Benefits and limi-tations’). Acronyms that contain only few letters are particu-larly problematic and must often be removed from the query in order to avoid high proportions of false-positive hits.
Data filtering
Data were filtered as described in Results and discussion using Microsoft Excel. The spreadsheet used to filter the gene list analyzed in this report and baseline occurrence values can be downloaded (see Additional data files).
Examples
The literature profiles generated for the two large published datasets analyzed in this report can be downloaded (see Additional data files) and explored using the clustergram browser Treeview, which is available online at no charge [10]. The three types of files provided for each example (ATR, GTR, CDT) must be copied in the same folder before opening the CDT file with Treeview.
Text analysis
(crosstab - tabulate: word occurrence; display: category percent), which can be saved as a tab-delimited text file.
Hierarchical clustering
Clustering analysis was performed using Cluster/Treeview programs available from the Eisen lab website [10]. Genes were grouped using the average linkage hierarchical cluster-ing algorithm.
Additional data files
Additional tables contain an index of the gene abbreviations used throughout the paper and a detailed list of non-obvious functional relationships identified by the exploration of Figures 6 and 7. Our URL database of indexed PubMed entries and a sample term filtering table are available in a Microsoft Excel spreadsheet format. The literature profiles of Figures 6 and 7 (ATR, GTR and CDT files) can be read by the well-known open source dendrogram browser Treeview [10].
Acknowledgements
We thank Glynn Dennis, Karl Hoffman, Doug Hosack, Peter Lemkin, Richard Lempicki, James Johndrow and Vishvanath Nene for their critical reading of the manuscript and helpful suggestions.
References
1. Schulze A, Downward J: Navigating gene expression using microarrays - a technology review.Nat Cell Biol2001, 3: E190-E195.
2. Schulze A, Downward J: Analysis of gene expression by microarrays: cell biologist’s gold mine or minefield?J Cell Sci 2000, 113:4151-4156.
3. Masys DR, Welsh JB, Lynn Fink J, Gribskov M, Klacansky I, Corbeil J: Use of keyword hierarchies to interpret gene expression patterns. Bioinformatics2001, 17:319-326.
4. Tanabe L, Scherf U, Smith LH, Lee JK, Hunter L, Weinstein JN: Med-Miner: an Internet text-mining tool for biomedical informa-tion, with application to gene expression profiling. Biotechniques1999, 27:1210-1214, 1216-1217.
5. Jenssen TK, Laegreid A, Komorowski J, Hovig E: A literature network of human genes for high-throughput analysis of gene expression. Nat Genet2001, 28:21-28.
6. PubMed[http://www.ncbi.nlm.nih.gov/entrez/query.fcgi?db=PubMed] 7. Human gene nomenclature committee
[http://www.gene.ucl.ac.uk/nomenclature/]
8. GenBank[http://www.ncbi.nlm.nih.gov/Genbank/index.html] 9. LocusLink[http://www.ncbi.nlm.nih.gov/LocusLink/index.html] 10. Eisen Lab[http://rana.lbl.gov/index.htm]
11. Quackenbush J: Computational analysis of microarray data. Nat Rev Genet2001, 2:418-427.
12. Nau GJ, Richmond JF, Schlesinger A, Jennings EG, Lander ES, Young RA: Human macrophage activation programs induced by bacterial pathogens.Proc Natl Acad Sci USA2002, 99:1503-1508. 13. Festuccia C, Giunciuglio D, Guerra F, Villanova I, Angelucci A,
Manduca P, Teti A, Albini A, Bologna M: Osteoblasts modulate secretion of urokinase-type plasminogen activator (uPA) and matrix metalloproteinase-9 (MMP-9) in human prostate cancer cells promoting migration and matrigel invasion. Oncol Res1999, 11:17-31.
14. Foda HD, Zucker S: Matrix metalloproteinases in cancer inva-sion, metastasis and angiogenesis. Drug Discov Today 2001, 6:478-482.
15. Ferrero E, Vettoretto K, Bondanza A, Villa A, Resnati M, Poggi A, Zocchi MR: uPA/uPAR system is active in immature dendritic cells derived from CD14+CD34+ precursors and is down-regulated upon maturation.J Immunol2000, 164:712-718.
16. Vaalamo M, Kariniemi AL, Shapiro SD, Saarialho-Kere U: Enhanced expression of human metalloelastase (MMP-12) in cuta-neous granulomas and macrophage migration.J Invest Derma-tol1999, 112:499-505.
17. Kato Y, Lewalle JM, Baba Y, Tsukuda M, Sakai N, Baba M, Kobayashi K, Koshika S, Nagashima Y, Frankenne F, et al.: Induction of SPARC by VEGF in human vascular endothelial cells. Biochem Biophys Res Commun2001, 287:422-426.
18. Online Mendelian Inheritance in Man
[http://www.ncbi.nlm.nih.gov/entrez/query.fcgi?db=OMIM]
19. Pomeroy SL, Tamayo P, Gaasenbeek M, Sturla LM, Angelo M, McLaughlin ME, Kim JY, Goumnerova LC, Black PM, Lau C, et al.: Prediction of central nervous system embryonal tumour outcome based on gene expression.Nature2002, 415:436-442. 20. Mireskandari A, Reid RL, Kashanchi F, Dittmer J, Li WB, Brady JN: Isolation of a cDNA clone, TRX encoding a human T-cell lymphotrophic virus type-I Tax1 binding protein. Biochim Biophys Acta1996, 1306:9-13.
21. Lu R, Yang P, O’Hare P, Misra V: Luman, a new member of the CREB/ATF family, binds to herpes simplex virus VP16-asso-ciated host cellular factor.Mol Cell Biol1997, 17:5117-5126. 22. Gatignol A, Kumar A, Rabson A, Jeang KT: Identification of
cellu-lar proteins that bind to the human immunodeficiency virus type 1 trans-activation-responsive TAR element RNA.Proc Natl Acad Sci USA1989, 86:7828-7832.
23. De Valck D, Jin DY, Heyninck K, Van de Craen M, Contreras R, Fiers W, Jeang KT, Beyaert R: The zinc finger protein A20 interacts with a novel anti-apoptotic protein which is cleaved by spe-cific caspases.Oncogene1999, 18:4182-4190.
24. Jin DY, Wang HL, Zhou Y, Chun AC, Kibler KV, Hou YD, Kung H, Jeang KT: Hepatitis C virus core protein-induced loss of LZIP function correlates with cellular transformation. EMBO J 2000, 19:729-740.
25. Benkirane M, Neuveut C, Chun RF, Smith SM, Samuel CE, Gatignol A, Jeang KT: Oncogenic potential of TAR RNA binding protein TRBP and its regulatory interaction with RNA-dependent protein kinase PKR.EMBO J1997, 16:611-624. 26. Holtrich U, Wolf G, Brauninger A, Karn T, Bohme B,
Rubsamen-Waigmann H, Strebhardt K: Induction and down-regulation of PLK, a human serine/threonine kinase expressed in prolifer-ating cells and tumors.Proc Natl Acad Sci USA1994, 91:1736-1740. 27. Guo SS, Wu X, Shimoide AT, Wong J, Sawicki MP: Anomalous overexpression of p27(Kip1) in sporadic pancreatic endocrine tumors. J Surg Res2001, 96:284-288.
28. Hernandez S, Hernandez L, Bea S, Pinyol M, Nayach I, Bellosillo B, Nadal A, Ferrer A, Fernandez PL, Montserrat E, et al.: cdc25a and the splicing variant cdc25b2, but not cdc25B1, -B3 or -C, are over-expressed in aggressive human non-Hodgkin’s lym-phomas. Int J Cancer2000, 89:148-152.
29. Molthagen M, Schachner M, Bartsch U: Apoptotic cell death of photoreceptor cells in mice deficient for the adhesion mole-cule on glia (AMOG, the beta 2- subunit of the Na, K-ATPase). J Neurocytol1996, 25:243-255.
30. Gloor S, Antonicek H, Sweadner KJ, Pagliusi S, Frank R, Moos M, Schachner M. The adhesion molecule on glia (AMOG) is a homologue of the beta subunit of the Na,K-ATPase.J Cell Biol 1990, 110:165-174.
31. Katayama Y, House CM, Udagawa N, Kazama JJ, McFarland RJ, Martin TJ, Findlay DM: Casein kinase 2 phosphorylation of recombinant rat osteopontin enhances adhesion of osteo-clasts but not osteoblasts.J Cell Physiol1998, 176:179-187. 32. Takeshita S, Kikuno R, Tezuka K, Amann E: Osteoblast-specific
factor 2: cloning of a putative bone adhesion protein with homology with the insect protein fasciclin I.Biochem J1993, 294:271-278.
33. Miyazono K: TGF-beta signaling by Smad proteins. Cytokine Growth Factor Rev2000, 11:15-22.
34. Yeast Literature
[http://genome-www.stanford.edu/Saccharomyces/literature.html] 35. Masys DR: Linking microarray data to the literature. Nat
Genet2001, 28:9-10.
36. Getz G, Levine E, Domany E: Coupled two-way clustering analysis of gene microarray data. Proc Natl Acad Sci USA2000, 97:12079-12084.
37. Kerr MK, Churchill GA: Bootstrapping cluster analysis: assess-ing the reliability of conclusions from microarray experi-ments.Proc Natl Acad Sci USA2001, 98:8961-8965.
38. Omniviz[http://www.omniviz.com/]
39. Zhu H, Cong JP, Shenk T: Use of differential display analysis to assess the effect of human cytomegalovirus infection on the accumulation of cellular RNAs: induction of interferon-responsive RNAs. Proc Natl Acad Sci USA1997, 94:13985-13990. 40. Slentz-Kesler KA, Hale LP, Kaufman RE: Identification and
char-acterization of K12 (SECTM1), a novel human gene that encodes a Golgi-associated protein with transmembrane and secreted isoforms.Genomics1998, 47:327-340.
41. Lyman SD, Escobar S, Rousseau AM, Armstrong A, Fanslow WC: Identification of CD7 as a cognate of the human K12 (SECTM1) protein. J Biol Chem2000, 275:3431-3437.

![(E) Methyl 2 [4 (dimethylamino)benzylidene]hydrazinecarboxylate at 123 K](data:image/gif;base64,R0lGODlhAQABAIAAAP///wAAACH5BAEAAAAALAAAAAABAAEAAAICRAEAOw==)