Journal of Chemical and Pharmaceutical Research, 2015, 7(6):879-886
Research Article
CODEN(USA) : JCPRC5
ISSN : 0975-7384
In vitro
assessment of the mutagenic effect of Metformin
Hala Abdel Malek , Amal Hassanin , Hussein Abdel Aziz* and Faeza El Dahtory**
Clinical Pharmacology Department , Faculty of Medicine, Mansoura University, Egypt
*
Medical Biochemistry
Department , Faculty of Medicine, Mansoura University, Egypt
**
Genetic Unit (Children Hospital)
,
Faculty of Medicine, Mansoura University, Egypt
_____________________________________________________________________________________________
ABSTRACT
Metformin drug has a widespread usage in diabetes mellitus , it prevents hepatic glucose release and increases tissue insulin sensitivity. Metformin toxicity is established in metabolic failure of liver and kidney disorders, Lactic acidosis toxicity induced by metformin, may lead to central nervous system dysfunction, cardiovascular collapse,
renal failure, and death. The studies investigated the genotoxicity of metformin are few either in vivo and in vitro
and are controversial. The possible cytotoxicic and mutagenic effects that may be induced by metformin had been investigated in vitro models and compared it with the standard cytotoxic drug , cyclo phosphamide. Metformin did not cause an obvious genotoxic effect or increased oxidative stress and this was indi cated by absence of changes in malondialdehyde( MDA), 8-hydroxy-2-deoxy Guanosine (8-OH-dG) levels and reduced glutathione (GSH) as compared to control normal group. So ,metformin did not cause any cytotoxic effect on comparing with the standard cytotoxic cyclophosphamide drug .Metformin does not express in vitro toxic effects .
Key words: anti diabetic drug, DNA, Blood lymphocytes
_____________________________________________________________________________________________
INTRODUCTION
Metformin is an anti diabetic biguanide drug . It produces an antihyperglycemic effect through prevention of hepatic glucose synthesis, associated with stimulation of tissue insulin sensitivity [1].The mode of action of metformin is incompletely explained however, it appears to have anti-inflammatory and antioxidant actions included in its medical uses in insulin resistance and polycystic ovary syndrome [2,3].
Metformin toxicity is an established metabolic failure due to liver and kidney diseases, it has been associated with lactic acidosis, in both acute and chronic exposures. This lactic acidosis, may lead to the central nervous system changes, cardiovascular collapse, and renal impairement, Results investigated the genotoxicity of metformin are few either in vivo and in vitro and are controversial [4] . DNA damage or genotoxicity can initiate different biological effects[ 4]. Micronucleus test has been used to determine the genotoxicic effects of sulfamethoxazole and carbamazepine. This simple in vitro test used in many cell types as it is a good method to evaluate cytochromosomal alteration [5]. Micronuclei (MN) test is also measuring chromosomal aberration [6].
EXPERIMENTAL SECTION MATERIALS
Human blood samples
Ten ml fresh venous blood samples were taken from 18 adult donors after consent. All donors were of both sexes (age 20-45 years). Apparently healthy, non-smoking, non-alcoholic and did not take any medications recently. The donors were obtained from the blood -banking center of Mansoura University Hospital. All blood samples were taken on heparinized sterile tubes to prevent clotting.
The study was done according to The Medical Research Ethics Committee of Mansoura University, Egypt. Chemicals
Metformin was obtained as metformin hydrochloride solution 1mg/ ml/ ampoule (Sigma- Aldrish company, USA ). Cyclophosphamide 1gm vial was obtained from ( Multipharma company, Egypt).
The chemicals used in this work were purchased from Sigma-Aldrish company, USA.
METHOD
Isolation and culture of human lymphocytes:
Lymphocytes were isolated from blood samples and cultured as described by Durante et al [6 ] and Chung et al. [7 ] with minor modification. Ten ml of whole blood was collected in an isolation tube for blood cells. The sample was centrifuged (20 min).
The mononuclear cells layer and platelets was gathered in a pipette and transfused to centrifuge tube (10 ml) . RPMI 1640 (Roswell Park Memorial Institute 1640) medium was put till 8 ml and the sample was centrifuged ( 10 min) . After the supernatant removal , the cell pellet was re-suspended in 8 ml RPMI 1640
medium at a density of 1.0X10⁶ with cells/ml supplemented with 20% fetal calf serum, 0.1 ml
phytohaemagglutinin-M, phytohaemagglutinin-M, 2 mM L-glutamine, 100 U/ml penicillin, 100 ug/ml streptomycin (antibiotics for sterilization) and 5 IU/ml sodium heparin (complete medium). Cel ls were kept i n a cult ure fla sk ina n i nc ubation a t 37oC in a 5% CO
2 humidified atmosphere.
The study plan:
Isolated lymphocytes were cultured in 10 ml RPMI 1640 culture medium for 72 hours at 37°C in the dark [8]. They were separated randomly into 3 groups: (6 samples each). The potential genotoxic drugs were added twice, at 24 hour and 48 hours ,at the beginning of cultivation period and after induction of mit otic division with phytohaemagglutinin that was added at the start of the period ,for mitosis within 24 hours, the maximum time for drugs addition , which if are added before 24 hours, the response to phytohaemagglutinin is affected, leading to delay i n mitosis[7,9,10].
Grouping of isolated lymphocytes and Drug doses:
The groups consisted of lymphocyte cells treated with high concentration of metformin (114.4 μg/ml) [4] , control group consisted of untreated cell cultures and cyclo phosphamide treated lymphocyte cells group (cyclophosphamide , 6 μg/ml) [4].
Evaluation of the drug effects:
1 -Micronucleus (MN) assay:
At 72 h of incubation, the cultures were collected by centrifugation ( 10 min) . Then the cell pellet was treated with a hypotonic solution ( 5 min, 0.075 M KCl at 37 C), in order to remove red cell and to keep the cytoplasm . Cells were centrifuged, then Carnoy’s fixative (methanol: acetic acid, 3:1, v/v) solution was added. This was done five times. then, the pellets of cells were resuspended in a small volume of fixative solution and dropped on to cold slides stained with 10% Giemsa dye solution.
Micronucleus cytokinesis-block assay scoring criteria:
To determine binucleate cells with micronuclei (BNMN) frequency and the total number of MN in lymphocytes (MNL), a two thousands of binucleate cells with preserved cytoplasm were scored for each subject on coding slides. MN were accepted, if
classifying cells depending on the nuclei numbers.
The cytotoxicity index was applied for measuring the cell proliferation, ( th e cytokinesis-block pro-liferation index) [11].
The cytokinesis-block pro-liferation index = MI + 2MII + 3 (MIII, MIV) / 100
MI–MIV =the numbers of cells with one to four nuclei, respectively,( MIII and MIV are considered to be in their third cell cycle). The cytokinesis-block pro-liferation index is a relevant index in evaluating cell toxicity or cell-cycle delay[11,12,13].
2- Comet assay was done under alkaline conditions [14,15 ] , the cell suspension (30 µl) was added to 90 µl low-melting point agarose ( 37°C) and evenly layered on to the pre-coated( with 300 µl high-low-melting point agarose) microscope slides. Slides were put on ice to solidify and to stop cell metabolism. Then, they were immersed in chilled lysis buffer (2.5 M NaCl, 100 mM sodium-EDTA, and 10 mMTris , pH 10) at 4°C .They were kept overnight. Then, they were put in a horizontal electrophoresis tank having freshly formed and chilled electrophoresis buffer (300 mM NaOH and 1 mM EDTA , pH 13). The slides were kept for 30 min to allow the unwinding of DNA and then electrophoresis was done at 30 V and 300 mA at 4°C for 40 min. The slides were rinsed with double distilled water (ddH2O) and then put in a neutralizing buffer (0.4 M Tris-HCl, pH 7.5) for 15 min at 4°C. The slides
were stained with ethidium bromide.
The slides were examined using fluorescence microscope ( with an excitation filter of 565 nm and a barrier filter of 590 nm). Images were taken by a digital camera ( saved as TIFF/JPEG files). These steps were done in the presence of reduced light to decrease DNA damage.
Cells images were performed by a computer-assisted image-analysis system (Comet Assay IV) for the comet
parameters. Results were expressed as tail length (TL; the migrated distance of DNA, in µm), DNA percentage in tail (% Tail; the intensity of migrated DNA) and tail moment (TM) (tail length x DNA percentage in tail / 100).
3-Assay against chromosomal breakage The chromosomal culture method described by Rooney and Czepulkowski[16]. 2 milliliter of sodium heparinized whole blood was collected from normal individuals. 0.5 cc of individual’s blood sample was added to 5 cc of a complete media containing RPMI 1640, fetal calf serum PHA (10 μg/ml), L- glutamate (2 mM), penicillin (10%) (unit/ml), and genta mycin (50 μg/ml). Each sample was cultured three times, the first was free, metformin solution (114.4 μg/ml) was added to the second culture and the cytophosphamide solution (6 μg/ml) was added to the third culture. After 72 hours of incubation in 37°C, colcemide was added (0.2 μg/ml) After 90 min, the cells were harvested by centrifugation(150g for 10 min). Then, 5 ml of 0.075 M KCl solution was added and mixed and incubated at 37°C for 15 min. After centrifugation (150 × g for 10 min), hypotonic supernat ant was removed. Then, 5 cc cold, fresh fixative solution (3:1 methanol acetic acid) was added drop wise to the cell pellet. Centrifugation was done afterwards and the supernatant removed. These two latter steps were repeated until a clear pellet was obtained. Finally, cells obtained were dropped on distinct slides. Staining with Giemsa was performed for some of the slides prepared from each individual. Fifty metaphases were analyzed for chromosomal breakage. The number of breaks per cell for each culture w as calculated.
4- Assay of intracellular reduced glutathione (GSH):
Reduced glutathione was done by the colorimetric method according to the method described by Beutler et al [17]. This method utilized metaphosphoric acid for protein precipitation and the water soluble 5,5' -dithiobis 2-nitrobenzoic acid, ( DTNB) for color development.
5. Assay of malondialdehyde level (MDA):
Lipid peroxidative products (MDA) were released from isolated lymphoc ytes by sonication , then lipid peroxidation products (MDA) were measured by thiobarbituric acid (TBA) test according to the method of
Draper and Hadley[18,19] , employing the colorimetric method using a spectrophotometer (JENWAY 6405).
6- Assay of 8-hydroxy-2-deoxy Guanosine (8-OH-dG):
The 8-OH-dG was assayed using Cayman 8-hydroxy-2-Dixie, Guanosine enzyme-linked immunosorbent
assay (Elisa = EIA) Kit (Cayman Chemical's ACETM, USA).
This assay is based on the competition between 8 -OH-dG and an 8-OH-DG-acetylcholinesterase (AChE) conjugate (8-OH-dG Tracer) for 8-OH-dG monoclonal antibody [20].
Statistical Analysis
The SPSS for Windows 11 package program was used for statistical analysis. Data(means +standard deviation SD) was compared by one-way analysis of variance (ANOVA). Multiple comparisons were performed by (Tukey's post-hoc) test. P < 0.05 was the level of significance between the tested groups. While comet assaying results were expressed as median (minimum-maximum) (non parametric) , statistical difference involving multiple group comparisons were determined by Kruskal Wallis test , differences between individual groups were determined with MannWhitney test . P < 0.05 was the level of significance between the tested groups .
RESULTS
Effect of Metformin on MN assay in cultured lymphocytes:
Table 1, demonstrates the data of the in vitro evaluation of metformin by using the micronucleus test. The results indicated that metformin has no cytogenetic activity with statistically significant differences from cyclophosphamide group . A cell-cycle delay,and a decrease in cell proliferation was observed in cyclo-phosphamide group and not in metformin group (p <0.05).
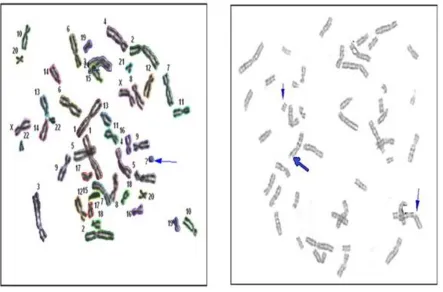
Effect of Metformin against chromosomal breakage
There was chromosomal breakages induced by cyclophosphamide (6 µg/ml),while metformin did not produce any breakages in its highest dose(table 4,figures 3,4)
Effect of Metformin on GSH level in cultured lymphocytes:
In table 2 , metformin significantly increased the level of reduced glutathione as compared to cyclo-phosphamide group (12.72±1.48 vs 2.57±0.97), (p <0.05) and this was insignificance as compared with the control group (12.72±1.48 vs 12.93±1.21 , p >0.05) ,.
Effect of Metformin on MDA level in cultured lymphocytes:
Metformin significantly reduced the level of MDA as compared to cyclophosphamide group ( 3.85± 0.79 vs 9.94± 1.08), (p <0.05) , table 2.
Effect of Metformin on 8-hydroxy-2-deoxy Guanosine (8-OH-dG) in cultured lymphocytes:
In comparison to cyclophosphamide treated group, metformin significantly decreased (8-OH-dG) level , (51.02±11.03 vs 170.27±4.53 , respectively), (p <0.05) , table 2.
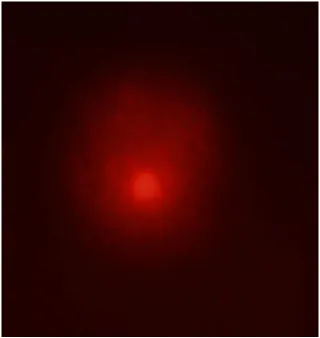
Effect of Metformin on comet assaying :
Statistical analysis of the mean values of the tail length,tail intensity and moment showed a significant rise in cyclophosphamide and not metformin group as compared with the non treated group (p <0.05, table 3,figure 1,2) .
Table 1, MN and CBPI frequencies values in lymphocyte cultures treated with metformin
(6 samples each, mean±SD)
Groups MN assay % CBPI% Control group 2.62+0.31 2.03+0.03 Cyclophosphamide group 8.62+0.51* 1.68+0.07* Metformin group 2. 94+0.12# 1.96+0.08#
*statistically significance versus untreated control group , (p <0.05)
Figure 1, normal comet assay for control lymphocytes with normal DNA spot
[image:5.612.146.466.352.690.2]Table 2, Metformin effect on GSH(nmol/106cell),MDA(nmol/106cell) and 8-OH-dG(pg/106cell) in lymphocytes cultures
(6 samples each,Mean±SD)
*statistically significance versus untreated control group , (p <0.05)
#statistically significance versus cyclophosphamide group , (p <0.05)
Table 3: Comet assay percentage of the different studied groups
Control group Cyclophosphamide group Metformin group
Tail length µm (median range) Median 45.05 100.45* 57.95 #
Range 20.20-70.10 77.90-170.50 30.20-71.30
Tail intensity (% Tail) Median 34.30 72.30* 23.63 #
Range 9.80-50.30 46.70-94.00 10.90-40.70
Tail moment Median 11.52 75.27* 11.34
#
Range 6.87-22.28 45.88-152.26 5.00-24.54
*statistically significance versus untreated control group
#statistically significance versus cyclophosphamide group
Table 4,a. No chromosomal breakage with 50, 100, 200 µl of metformin (114.4µg/ml) (not shown) b.Chromosomal breakage which was induced by cyclophosphamide (6 µg/ml)
200µl 100µl 50µl no 2.1 1.9 2.0 2.3 1.8 2.2 0.9 1.3 0.8 1.1 1.0 1.4 - - - - - - 1 2 3 4 5 6 2.05±0.18 1.08±0.23 - ±- Mean± SD
Figure 3, (a) Metaphase spread from a healthy individual and chromosomal breakages induced by 100 µl of cyclophosphamide (6 µg/ml) (b) Metaphase spread from a healthy individual showing chromosomal breakages induced by 200 µl of cyclophosphamide (6 µg/ml)
[image:6.612.87.530.427.719.2]Figure 4, Metaphase spread from a healthy individual and no chromosomal breakages induced by metformin (50, 100, 200 µl of metformin 114.4µg/ml)
DISCUSSION
Metformin is an oral antidiabetic drug that has been used for human conditions suffering from an insulin-resistance , diabetic states, impaired glucose tolerance, and weight gains. It is also used in treating anovulation, and induce conception in polycysticovary syndrome. However, there is a strong debate around the metformin -induced genotoxicity [4].
Among different cytogenetic techniques, micronucleus is an index for geno toxicity, and the reduction in the cytokinesis-block proliferation, is an index for the cytotoxic effect. The technique is relevant b ecause it detects the clastogenic effect via induction of cytokinesis block, and its applicability have made its usage very promising in chromosomal alteration studies [21,22]. Micronucleus assay is only working when
DNA strands are broken[21].
The dose used by Amador et al [4] was small , and was re -evaluated in the present work and other different doses are needed to be investigated in further works . In the present study , metformin did not show significant oxidative effects as indicated by non significant changes in the levels of MDA, GSH, and 8-OH- dG.
This coincides with different in vivo studies showed that metformin at therapeutic concentrations could destroy hydroxyl (· OH) free radicals.
Metformin is able to scavenge ROS directly or by modulating the intracellular production of superoxide anion ,that NADPH oxidase constitutes the major source. Metformin decreases the oxidative process in the cardiovascular and renal systems , delays diabetes mellitus onset and prevents early manifestations of vascular disorders[ 23,24] .
Hirsh et al [ 25] showed that metformin in low doses inhibit cellular transformation and kills cancer-stem cells in four genetically different types of the cancer of the breast tissue . They proposed that metformin combination with chemotherapeutic drugs may be a novel treatment for cancer .
In the study of Onaran et al metformin administration in pharmacological dose was unable to prevent DNA destruction under the effect of pro-oxidant stimulus in cultured lymphocytes, in spite of its antioxidant properties [26] .
While , Kefas et al proved the genotoxicity effect of metformin in mammalian cells using comet assay through the activation of AMPK ,which increases nitric oxide synthase and mitochondria-derived reactive-nitrogen species. Furthermore, blood lymphocyte cultures challenged with cumene hydroperoxide (CumOOH) showed that in vitro high dose of metformin produces DNA damage, despite its antioxidant effect[26,27].
On the other hand, Kanigür-Sultuybek et al [ 28] in vitro results, indicated the protective effect of metformin against prooxidant stimulus-induced DNA damage in lymphocytes from elderly subjects.
CONCLUSION
This study concluded that metformin does not cause any oxidative DNA desrtuctive effects in vitro. REFERENCES
[1]M Stumvoll; N Nurjhan; GPerriello; GDailey; JE Gerich. N. Engl. J.Med. , 1995,333 , 550-554.
[2]SE Inzucchi, DG Maggs, GR Spollett, SL Page, FS Rife, V. Walton, and G.I.Shulman . N. Eng. J. Med., 1988,
338(13), 867-72.
[3]HM Kaneb; PS Sharp; N Rahmani-Kondori ; DJ Wells . PLoS One, 2011,6, e24189.
[4]RR Amador; JP Longo; ZGLacava; JGDorea; ASF Mde. Genet. Mol. Biol. , 2012,35, 153-158.
[5]MT Kirsch-Volders; MSofuni; S Aardema; D Albertini; D Eastmond ; Fenach et al . Mutat. Res., 2003, 540, 153–163.
[6]HW Chung ;SJ Kang ;SYKim. Mutat. Res. , 2002,516 , 49-56 .
[7]M Durante;YFurusawa; E Gotoh . Int. J. Radiat. Biol., 1998,74 , 457-462.
[8]DAnderson; TW Yu ; BJ Phillips ; P Schmezer. Mutation Research, 1994, 307, 1 , 261–271.
[9]RJ Preston; B J Dean; S Galloway; H Holden; AF McFee; M Shelby . Mutat. Res. ,1987,189, 157-165 .
[10]F Watson, JJ Robinson , SW Edwards . Biosciences Rep. ,1992,12, 123-133.
[11]S Ponnala; KP Rao; JR Chaudhury;J Ahmed; BR Rao ; S Kanjilal et al . Prostaglandins Leukot Essent Fatty
Acids , 2009 ,80 , 43–50.
[12]M Fenech ; AA Morley . Mutat. Res., 1985, 147, 29–36. [13]A Celik. Drug Chem. Toxicol. , 2006,29, 227-236 .
[14]E Van Dyk ;PJ Pretorius . Biochem. Biophys. Res. Commun. ,2005,338 ,815-9.
[15]GS Keretetse ;PJ Laubscher ; JL Du Plessis ; PJ Pretorius ;FH Van Der Westhuizen ; E Van Deventer , E Van
Dyk ; FC Eloff ; MNVan Aarde ; LH Du Plessis. Ann. Occup. Hyg., 2008, 52, 653-62.
[16]DE Rooney ; BH Czepulkowski . Human ChromosomebPreparation.In Essential Techniques Series, D
Rickwood(ed). Department of Biological and Chemical sciences, University of Essex, Wivenhoe Park, Colchester UK, USA,University Press,1997; 37-8.
[17]E Beutler; O Duron; BM Kelly . J. Lab. Clin .Med. , 1963,61, 882-8.
[18]NH Stacey; LR Cantilena; CD Klaasson . J. Toxicol. Environ. Health, 1981,7,139 -47 .
[19]HH Draper ; M Hadley. Method Enzymol. 1990,186 ,421–31.
[20]P Pradelles; JGrassi ; J Maclouf . Anal. Chem., 1985,57, 1170-1173 . [21]AV Carrano ;AT Natarajan . Mutat. Res. ,1988,204, 379–406 .
[22]S Poddar; G Talukder ; A Sharma . Int. J. Hum. Genet. ,2004,4 , 261-264.
[23]D Bonnefont-Rousselot; B Raji; S Walrand; M Gardès-Albert; DJore ; ALegrand et al. Metabolism, 2003, 52
,586-9.
[24]P Rosen ; NFWiernsperger . Diabetes/Metab. Res. Rev., 2006,22 , 323-330.
[25]HA Hirsh; D Iliopoulos; PN. Tsichlis; K. Struhl . Cancer Res., 2009,69, , 7507–7511. [26]I Onaran; GS Guven; SBOzdas;G Kanigur; S Vehid . Mutat. Res. ,2006,611, 1–8 .
[27]BA Kefas ;Y Cai ;K Kerckhofs ; Z Ling ; G Martens ; H Heimberg ;D Pipeleers ; MVan de Casteele .
Biochem. Pharmacol. ,2004,68 , 409-16.