Improving Undergraduate Engineering Students'
Figural Spatial Ability through Digital
Brain-Training Game
Ong Shu Xian, Aini Marina Ma’rof *
Faculty of Educational Studies, Universiti Putra Malaysia, Malaysia
Received October 27, 2019; Revised December 2, 2019; Accepted December 24, 2019
Copyright©2020 by authors, all rights reserved. Authors agree that this article remains permanently open access under the terms of the Creative Commons Attribution License 4.0 International License
Abstract
Undergraduate engineering students often struggle in mastering engineering course contents. Although introductory engineering courses were extensively taught, it was deemed not enough, especially in graphic expression since it requires high levels of spatial ability. Moreover, spatial ability is acquired beyond formal learning through leisure training and not explicitly taught. Thus, a digital brain training game i.e. Cubes Spatial Reasoning FREE (CSR) was used in this study in attempt to improve figural spatial ability. The purpose of this study was to evaluate the impact of the use of CSR on figural spatial ability of undergraduate engineering students in terms of mental rotation and spatial orientation. 30 undergraduate engineering students were selected using purposive sampling method. Mental Rotation Test (MRT) was used to measure mental rotation and Spatial Orientation Test (SOT) was used to measure spatial orientation. Findings indicated that CSR significantly improved figural spatial ability in terms of mental rotation and spatial orientation. In conclusion, as indicated in this preliminary study, CSR may be used as a training tool to potentially improve mental rotation and spatial orientation in undergraduate engineering students.Keywords
Digital Brain Training Game, Figural Spatial Ability, Undergraduate Engineering Students1. Introduction
Engineering students in universities have different levels of spatial ability among peers due to different factors such as sex, background of growth, living area and social environment. These factors were affecting level of spatial abilities with which they affect understanding in the contents of graphic expression. Engineering drawing needs high levels of visualization skills (National Science
Foundation, 2006). Students must understand the basic concepts of engineering drawing in order to assist them in understanding the complexity of learning in other engineering subjects. However, students need to build basics of spatial visualization ability in order to master engineering drawing concepts (Ali & Hussin, 2016). The complexity of engineering drawing leads to cognitive overload for students with low spatial ability, while those with high spatial ability take advantage of this (Huk, 2006). Some universities offer introductory engineering courses for engineering students in order to enhance students’ foundation knowledge on engineering. However, Martin Gutierrez el al. (2015) found that it was not enough in graphic expression study, since abilities were not taught but trained. Spatial ability can be trained overtime with tasks related to leisure, usually in the form of sports and digital games (Moreau et al., 2012; Feng et al., 2007). One way to improve spatial ability was through playing digital games (Spence et al., 2009; Feng et al., 2007; Uttal et al., 2012). In our current study, Cubes Spatial Reasoning FREE (CSR) was chosen to be the digital brain training game as it can be downloaded freely by Android users from Google Play.
According to Ventura et al. (2013), spatial ability refers to the ability to mentally manage the objects and their parts in a bi- and three- dimensional space. Spatial ability can be understood in environmental spatial ability, vista spatial ability and figural spatial ability. In this study, environmental spatial ability and figural spatial ability will be discussed. In figural spatial ability, the components include mental rotation, spatial visualization and spatial orientation. Only mental rotation and spatial orientation were discussed in this study.
1.1. Study Objectives
i. determine the level of figural spatial ability of undergraduate engineering students in terms of mental rotation and spatial orientation.
ii. determine level of environmental spatial ability of undergraduate engineering students.
iii. determine the relationship between environmental spatial ability of undergraduate engineering students with their figural spatial ability in terms of mental rotation and spatial orientation.
iv. evaluate the impact of a digital brain training game (Cubes Spatial Reasoning FREE, CSR) on figural spatial ability among undergraduate engineering students.
1.2. Theoretical Framework
1.2.1. Piaget's Cognitive Learning Theory
There were two theories related to cognitive learning theory used as the basis of the study, namely Piaget’s and Vygotsky’s cognitive learning theories. In Piaget’s view, we gain knowledge from action (DeVries, 2008). He proposed an individual’s cognitive ability progresses through four distinct stages: sensorimotor stage, preoperational stage, concrete operational stage and formal operational stage. New abilities and flexibilities of processing information emerged in each stage. One could deal abstractly with hypothetical situations and reason logically in formal operational stage (age 11 to adulthood) (Slavin, 2011). In Piaget’s theory, there were two concepts: projective relations and Euclidean geometry. Projective relation is the ability to imagine the environment from different perspectives . Euclidean geometry refers to the
ability to precisely specify the spatial relationships between locations.
1.2.2. Vygotsky's Cognitive Learning Theory
Vygotsky’s theory stated that individual obtains intellectual development through experience in real world in historical and cultural context. In his view, he suggested cognitive development depend on the sign system that was the cultures created for people to think, communicate and solve problems. So, Vygotsky’s theory was closely related to our environmental spatial ability as it was about our experience in real space (Slavin, 2011).
1.2.3. Digital Game-based Learning
Digital game-based learning (DGBL) approach was used to train the figural spatial ability in terms of mental rotation and spatial orientation. Many educators had agreed that students who play education games improve in the quality of education (Clements & Mcmillen, 1996; Lin & Liu, 2009; Papastergiou, 2009). Digital games consisted of various sorts of digital elements, such as light, sound, animation and image , provide an immersion environment to increase students’ engagement. Hung et al. (2012) claimed that the computer games provide virtual and beneficial visuality as real models, which attract students in a new approach of cognitive learning experience.
We wanted to investigate the impact of Piaget’s theory and Vygotsky’s theory on figural spatial ability in terms of mental rotation and spatial orientation via DGBL using CSR. Theoretical framework of this study was showed in Figure 1.
2. Methods
2.1. Participants
33 undergraduate engineering students from Universiti Putra Malaysia (UPM) and Universiti Tenaga National (UNITEN) participated in this study, of whom 22 males and 11 females. Quasi-experimental one group pretest-posttest design was chosen as we faced limitations to access classes of engineering students (Fraenkel et al., 2016). Participants were chosen when they participated in a social activity. Therefore, the samples were from two different classes of two universities, due to the amount of students that were limited. Purposive sampling was used to choose the samples.
2.2. Instruments
There were four parts in the instrument. The first part was 8 items on demographic data. The items were self-developed based on literature and researcher’s intention. The eight items were gender, age, and programme of study, current year of study, current CGPA, the frequency of playing digital games and frequency of exercise.
The second part was 15 items on Santa Barbara Sense of Direction Scale (SBSOD). SBSOD was adopted and used to measure environmental spatial ability of undergraduate engineering students. Participants judged their own environmental spatial abilities through the items stated. The instrument was adopted from Hegarty et al. (2002) as a self-report measure and had been proved to be a more promising approach to predict environmental spatial ability. Each item has Likert scale of seven points.
The third part was 24 items on Mental Rotation Test (MRT). It was used to measure mental rotation. MRT was composed of the figures provided by Shepard and Metzler (1971) and it was an Auto cad-redrawn version of the Vandenberg & Kuse (1978) MRT test. This version of instrument was redrawn by Michael Peters (1995). Every item was shown a model of a block in three-dimensional perspective and four figures of blocks with different rotations. There were two correct models in each question where they can be rotated from the model given. Meanwhile, another two figures cannot be rotated in any perspective.
The fourth part consisted of 12 items on Spatial Orientation Test (SOT) and it was used to measure spatial orientation. This version of SOT was adopted from Hegarty and Waller (2004) and was a revised version of the test used by Kozhevnikov and Hegarty (2001). A set of seven objects were presented on top of each question. A circle was drawn at the bottom and the direction of it was labelled. In each item, the user should imagine they were situated at the location of one of the objects of the set (which will be in the centre of the circle), looking at
another one of them (which will be at the top of the circle as if it was 12 o'clock). The participants should draw an arrow from the central object indicating the direction towards a third object from the new orientation.
[image:3.595.306.538.185.749.2]2.3. Procedure
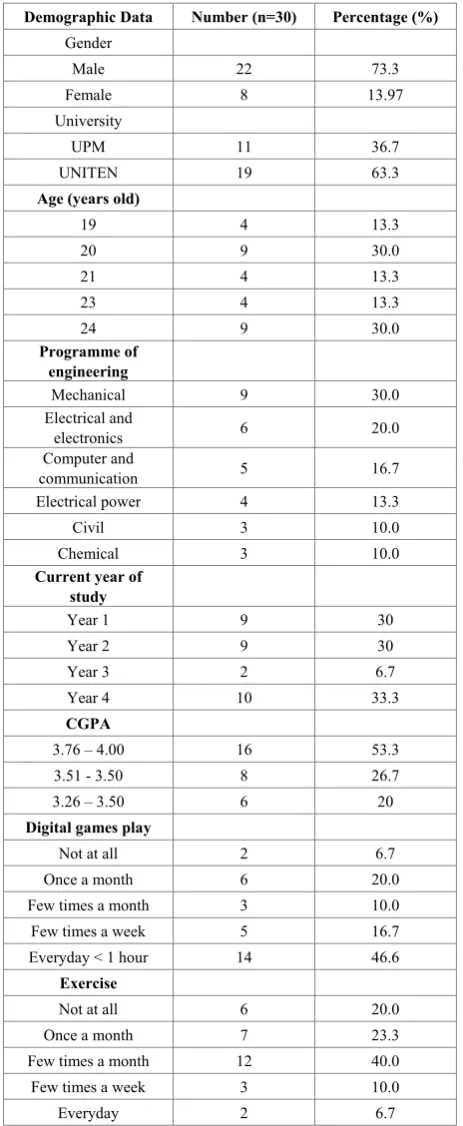
Table 1. Demographic characteristic of the participants (n = 30)
Demographic Data Number (n=30) Percentage (%)
Gender
Male 22 73.3
Female 8 13.97
University
UPM 11 36.7
UNITEN 19 63.3
Age (years old)
19 4 13.3
20 9 30.0
21 4 13.3
23 4 13.3
24 9 30.0
Programme of engineering
Mechanical 9 30.0
Electrical and
electronics 6 20.0
Computer and
communication 5 16.7
Electrical power 4 13.3
Civil 3 10.0
Chemical 3 10.0
Current year of study
Year 1 9 30
Year 2 9 30
Year 3 2 6.7
Year 4 10 33.3
CGPA
3.76 – 4.00 16 53.3
3.51 - 3.50 8 26.7
3.26 – 3.50 6 20
Digital games play
Not at all 2 6.7
Once a month 6 20.0
Few times a month 3 10.0
Few times a week 5 16.7
Everyday < 1 hour 14 46.6
Exercise
Not at all 6 20.0
Once a month 7 23.3
Few times a month 12 40.0
Few times a week 3 10.0
Before conducting the experiment, we obtained ethics approval from the related bodies concerning human subjects research. The experiment was conducted on week four to week seven of the semester, therefore the total experimental period was for a total of three weeks. 22 questionnaires were distributed to UNITEN undergraduate engineering students while 11 questionnaires were given to UPM undergraduate engineering students. The aim of the study and procedures were explained to the volunteers. Consent forms were given and they were informed that they can withdraw from the participation in any time. In first meeting for pre-test, the session took about 45 minutes. Students explained that a pre-test on spatial ability was given to them.
Then, they were instructed to install Cubes Spatial Reasoning FREE (CSR) from their Android system mobile apps. They were instructed to perform training of 15 minutes per day on anytime of the day for 21 days. The total training time will be 5 hours and 15 minutes. They were required to fill in a training log book for proving of training every day. After three weeks, there was a post test on same questionnaire for only part 3: MRT and part 4: SOT.
For post-test, as in pre-test, the students who attended weekly social activities came earlier for the test. Post-test took around 20 minutes as students understood the instruction from the previous session. 19 UNITEN students and all 11 UPM students attended. The total number was 30 and response rate was 90.91%. Some UNITEN students were absent as they were sitting for examination on the day of our testing. Table 1 illustrates the demographic data of the participants.
2.4. Data Analyses
All data were analyzed by using IBM SPSS version 25 for descriptive and basic inferential statistics. Data gathered for MRT and SOT were divided into two groups, which was pre-test and post-test. Data was analyzed by using descriptive statistics to obtain information on frequency for categorical data. Besides, the information on mean and standard deviation was retrieved for continuous data.
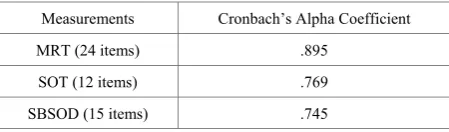
In this study, the internal reliability of the instruments has been tested with SPSS with indication from Cronbach’s alpha. Ideally, the Cronbach’s alpha coefficient of a scale should be above 0.7 (Pallant, 2005). Table 2 shows that all of the measurements had Cronbach’s alpha of more than 0.7.
Table 2. Cronbach’s alpha coefficient for all the scales
Measurements Cronbach’s Alpha Coefficient
MRT (24 items) .895
SOT (12 items) .769
SBSOD (15 items) .745
Normality test was done on the data in order to determine the appropriate statistical approaches to be used for hypothesis testing, i.e. using either the parametric approach or nonparametric approach. Numerical methods can be further divided into two methods, which were statistic method and rule of thumb method.
The statistic method was using Shapiro-Wilk normality test, while the rule of thumb method was examining the skewness and kurtosis of the distribution. Thus, in order to compensate for the strengths and weaknesses for those methods, both methods were used in this study for normality test.
Table 3. Shapiro-Wilk’s significance for normality tests Tests of Normality (Shapiro- Wilk’s Sig.)
Measurements Pre-test Post-test
SBSOD
MRT 0.945* 0.237* 0.003 -
SOT 0.001 0.000
Note: *normal distribution, with p >.05
From numerical analysis (i.e. Shapiro-Wilk normality test) in Table 3, it was found that pre-test of SBSOD (p=0.945) and pre-test of MRT (p=0.237) were normally distributed while SOT scale (p=0.001) was not normally distributed. Referring to the table above, the scale’s significant value which was greater than 0.05 was considered normally distributed. The value with an asterisk (*) was greater than .05. In other words, only two scales were normally distributed while others were not. However, through the rule of thumb method, it says that in general, if kurtosis ad skewness were within -2 and +2, the data can be considered normally distributed, thus, according to the Table 4, all of the scales skewness and kurtosis were within -2 and +2, thus it can be said that all the scales were normally distributed.
Although the Shapiro-Wilk test shows some of the scales were not normally distributed, yet the rule of thumb method suggests that all the scales can be considered normal. Thus, to reduce the burden in analysis, the data was assumed as near to normal distribution in this study. There were other ways to deal with the normality problem of the distribution, such as trimming the data, etc. However, although discarding the outliers may be performed in order to enable the data distribution to be fairly consistent with normal distribution yet trimming the data leads to some complications in applying more advanced statistical analysis (Wilcox, 1998). Moreover, the data will be more prone to validity issues.
[image:4.595.62.287.689.755.2]figural spatial ability. The relationship was indicated by correlation coefficient, r, which ranges from -1 to +1.
Table 4. Skew and kurtosis for all the scales
Questionnaire Pre-test Post-test
skew kurtosis Skew Kurtosis
SBSOD -0.180 -0.349
MRT -0.216 -0.833 -0.480 -1.191
SOT -0.773 -0.672 -1.439 1.417
3. Findings
3.1. Descriptive Results
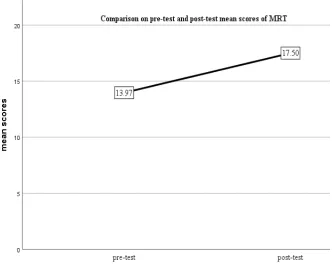
[image:5.595.308.536.114.158.2]As shown in Table 5, the MRT pre-test and post-test mean scores were 13.97 (SD=6.094) and 17.50 (SD=5.576) respectively. This meant that there was an increment in mean scores of MRT from pre-test to post-test. Comparison of mean scores of MRT is illustrated in
Figure 2.
Table 5. Mean and standard deviation of MRT in pre-test and post-test
MRT Mean Standard Deviation
Pre-test 13.97 6.094
Post-test 17.50 5.576
In order to identify the level of mental rotation in category, the mean score and standard deviation were used with the following formula, since the result was normally distributed:
Level of MRT = mean ± 1 SD
By using this formula, a mean score of higher than upper value means high level. A mean score within the calculated value was moderate level while a mean score of lower than the calculated value was low level.
To calculate the level of MRT in pre-test, mean score of pre-test was used. Table 6 shows the level of MRT. Level of MRT = mean ± 1 SD= 13.97 ± 6.094= 7.876 – 20.064
Figure 2. Comparison of pre-test mean score and post-test mean score in MRT
Table 6. Pre-test and post-test result in MRT based on category
Mean score Level Number, n = 30 (%)
Pre-test Post-test
≤ 7.875 Low 6 (20.0) 0 (0)
7.876 –
20.064 Medium 19 (63.3) 18 (60.0)
[image:5.595.136.473.339.606.2]Figure 3. Comparison of MRT level in pre-test and post-test in categories
Pre-test result in MRT presented at Table 6 shows that there were 6 students (20%) in low mental rotation level, 19 students (63.3%) in medium level of mental rotation while 5 students (16.7%) in high level of mental rotation. Post-test result in MRT (Table 6) showed that there was no student in low mental rotation level, 18 students (60%) in medium level of mental rotation while 12 students (40%) in high level of mental rotation. This meant that there was improvement in overall result in MRT. It was surprising that there were no students in the low mental rotation classification after three weeks of training with CSR. Figure 3 illustrates the comparison of MRT score in pre-test and post-test in categories.
Table 7. Mean and standard deviation of SOT in pre-test and post-test
MRT Mean Standard Deviation
Pre-test 9.27 2.612
Post-test 10.80 1.472
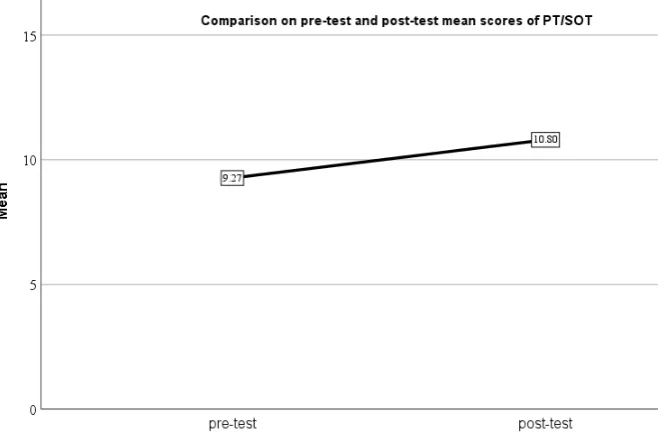
As shown in Table 7 above, the SOT pre-test and post-test mean scores were 9.27 (SD=2.612) and 10.80 (SD=1.472) respectively. This means that there was an increment in mean scores of SOT from pre-test to post-test. Comparison of mean scores of SOT is shown in Figure 4.
For spatial orientation, the mean scores were categorized into low, medium and high level using following formula:
Level of spatial orientation = number of items / number of category required = 12 /3 = 4
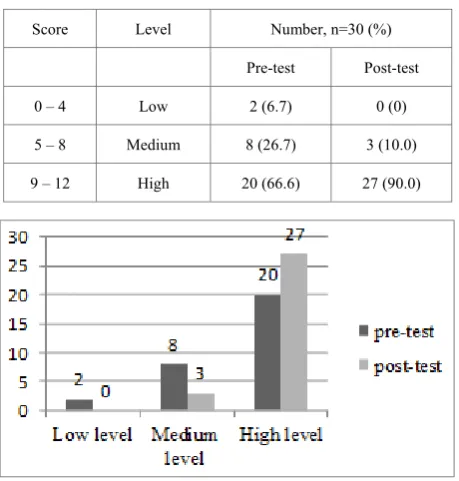
[image:6.595.58.294.79.219.2]The scores for category were used in Table 8 for pre-test and post-test result in SOT. Pre-test result in SOT (Table 8) shows that there were 2 students (6.7%) in low spatial orientation level, 8 students (26.7%) with medium level of spatial orientation while 20 students (66.6%) with high level of spatial orientation. There were no students in low spatial orientation level, there were 3 students (10.0%) with medium level of spatial orientation while there were 27 students (90.0%) with high levels of spatial orientation. This showed that there were improvements in overall scores for SOT. Similar to result of MRT, no more students were in low spatial orientation after three weeks of training with CSR. Figure 5 illustrates the comparison of SOT score in pre-test and post-test in category.
[image:6.595.138.471.435.655.2]Table 8. Pre-test and post-test result in SOT based on category
Score Level Number, n=30 (%)
Pre-test Post-test
0 – 4 Low 2 (6.7) 0 (0)
5 – 8 Medium 8 (26.7) 3 (10.0)
9 – 12 High 20 (66.6) 27 (90.0)
Figure 5. Comparison of SOT level in pre-test and post-test in categories
3.1.1. Level of Environmental Spatial Ability
From the analysis, the mean score of SBSOD was 4.08 (SD=0.776). In order to identify the level of environmental spatial ability of undergraduate engineering students, the scores of SBSOD were categorized into low, medium and high levels. Based on the instrument of SBSOD, 7-points Likert scale was used for the measurements. The scale was ranging from 1 to 7. The equal width interval was calculated by using the method as below:
(Highest score – Lowest score) / Number of category required = (7 – 1) / 3= 2
Therefore, the interval between each category was 2. The category value is shown in Table 9. Results of SBSOD that is, measuring level of environmental spatial ability, are as follows:. 4 students (13.3%) perceived themselves low in environmental spatial ability, 22 students (73.4%) reported that they have medium level of environmental spatial ability while there were also 4 students (13.3%)who said they had high levels of environmental spatial ability.
Table 9. Level of environmental spatial ability (n = 30)
Mean Score Spatial Ability level Environmental Number (n=30) Percentage (%)
1.00 – 3.00 Low 4 13.3
3.01 – 5.00 Medium 22 73.4
5.01 – 7.00 High 4 13.3
3.2. Relationship between Environmental Spatial Ability and Figural Spatial Ability
Table 10. Pearson’s Product Moment Correlations for environmental spatial ability and figural spatial ability
Mental Rotation r P
Pre-test -0.096 0.615
Post-test -0.430 0.018*
Spatial Orientation r P
Pre-test -0.096 0.615
Post-test -0.430 0.018*
*Note: correlation is significant at the 0.05 level (2-tailed)
From Table 10, it showed there was a significant relationship between SBSOD and post-test MRT (r= -0.430, p= 0.018). The direction of correlation was negative, which meant that students who were high in environmental spatial ability tended to have lower mental rotation ability. However, for pre-test of MRT (r= 0.096, p= 0.615), the relationship between SBSOD and MRT was not significant. On the other hand, there was no significant relationship between SBSOD and pre-test SOT (r= -0.326, p= 0.78). There was also no significant relationship between SBSOD with post-test SOT (r=0.025, p= 0.897).
3.3. Impact of CSR on Figural Spatial Ability
Hypothesis 1: Digital brain training game (Cubes
Spatial Reasoning FREE, CSR) can significantly impact figural spatial ability of undergraduate engineering students in terms of mental rotation.
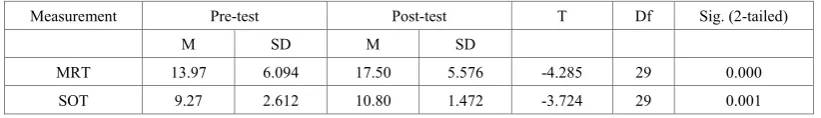
Table 11 displays the result of paired sample t-test in comparison with the mean score among pre-test and post-test in MRT. According to the table, the difference between the pre-test and post-test was 3.53, t-calculated was -4.285, and the significance p was 0.000 (<0.05). The t value was 0.000, <0.05. Hypothesis 10 was rejected at significance level of 0.05. So, there was a significant difference between mean scores in pre-test and post-test in MRT. The analysis showed that the mobile apps CSR can improve mental rotation of spatial ability. The students’ MRT scores improved in post-test compared to pre-test after 3 weeks of training.
Hypothesis 2: Digital brain training game (Cubes
Spatial Reasoning FREE, CSR) can significantly impact figural spatial ability of undergraduate engineering students in terms of spatial orientation.
[image:7.595.60.290.88.329.2]Table 11. Comparison t-test of mean score among pre-test and post-test in figural spatial ability
Measurement Pre-test Post-test T Df Sig. (2-tailed)
M SD M SD
MRT 13.97 6.094 17.50 5.576 -4.285 29 0.000
SOT 9.27 2.612 10.80 1.472 -3.724 29 0.001
4. Discussion
4.1. Level of Figural Spatial Ability
From the result, the mean score of mental rotation improves from 13.97 (lower boundary of medium level) to 17.50 (higher boundary of medium level). As discussed earlier, it was carried out in consecutive 21 days for 15 minutes daily. As compared to a study done by Roca-González et al. (2017) in Spain, the pre-test and post-test scores for MRT were 15.22 and 17.20 respectively. So, the level of mental rotation of undergraduate engineering students in Malaysia was similar to the international level.
In terms of spatial orientation, the mean scores of pre-test and post-test were 9.27 and 10.80, which were in high category. When compared to the study done by Roca-González et al. (2017), the pre-test and post-test scores for SOT were 8.13 and 10.09 respectively. So, the result shows that the level of spatial orientation in undergraduate engineering students in Malaysia was similar to the international level.
4.2. Level of Environmental Spatial Ability
The mean score of environmental spatial ability was 4.08 (SD=0.776). When compared to Hegarty et al. (2002), they found that the mean score of undergraduate students for SBSOD test was 4.7 (SD=1.1). Thus, the level of environmental spatial ability in undergraduate engineering students in Malaysia was similar to the international level.
4.3. Relationship between Environmental Spatial Ability and Figural Spatial Ability
From the result (r = -0.43, p = 0.018), according to Guilford’s Rule of Thumb, the study showed significant but low correlation between environmental spatial ability and mental rotation. It was similar to study by (Hegarty et al., 2002) that the SBSOD has been found to correlate with tests of spatial knowledge that involves orienting oneself within real-life environments.
According to Guilford’s Rule of Thumb, the study showed negligible correlation between environmental spatial ability and mental rotation (r = -0.025, p = 0.897). Study by Ventura et al. (2013) found that correlation test between SBSOD and SOT was 0.17. Both of the studies showed that there was nearly no relationship between environmental spatial ability and spatial orientation.
4.4. Impact of CSR on Figural Spatial Ability
The current result showed significant improvement in the mental rotation after training with CSR for 5 hour and 15 minutes. These finding tally with a few of research before, which find that digital brain training games may improve mental rotation in engineering undergraduate students. For example, a study reported by Feng et al. (2007) showed significant improvement in mental rotation after 10 hours of training in digital games. Besides, digital brain training games have proven motivational impact on learning (Di Serio et al., 2013; Martin-Gutierrez & Meneses, 2014) and they play roles in student-centred learning (Di Serio et al., 2013).
The current result shows that there was significant improvement in the spatial orientation after CSR training. These finding tallied with a study before such as Lin et al (2014), where we found that digital brain training games may improve spatial orientation in engineering undergraduate students. The result was tallying with what was reported by Lin et al. besides, experiment by Lin & Chen (2016) showed that the digital brain training game significantly improved figural spatial abilities in terms of mental rotation and spatial orientation with one time 45-55 minutes of digital brain training game.
5. Conclusions
In conclusion, as a preliminary stage of study, the result shows that the design of the digital brain training game - CSR matched the theories discussed in the literature. Thus, it may be practical to be used as a training tool by the undergraduate engineering students’ instructors to improve students’ figural spatial ability in relative to mental rotation and spatial orientation. Students nowadays had grown in the era with various types of electronic devices. They sometimes were hardly engaged to paper-and-pencil based exercise. This study has given them a bright side of engaging in digital learning.
Acknowledgments
REFERENCES
Ali, D. F., & Hussin, M. N. K. (2016). Spatial visualization [1]
ability among engineering students in Malaysia. Man in India, 96(1), 203-209.
Clements, D. H., & McMillen, S. (1996). Rethinking" [2]
concrete" manipulatives. Teaching children mathematics, 2(5), 270-279.
DeVries, R. (2008). Piaget and Vygotsky: Theory and [3]
practice in early education. In T.L. Good (Ed.), 21st century learning (Vol. 1, pp. 184-193). Thousand Oaks, CA: Sage. Di Serio, A., Ibanez, M. B., & Kloos, C. D. (2013). Impact of [4]
an augmented reality system on students' motivation for a visual art course. Computers & Education, 68, 586-596. Feng, J., Spence, I., & Pratt, J. (2007). Playing an action [5]
video game reduces gender differences in spatial cognition. Psychological Science, 18(10), 850-855.
Fraenkel, J. R., Wallen, N. E.,& Hyun, H. H. (2016). How to [6]
Design and Evaluate Research in Education (9th ed). New York: McGraw-Hill Education.
Hegarty, M., Richardson, A. E., Montello, D. R., Lovelace, [7]
K., & Subbiah, I. (2002). Development of a self-report measure of environmental spatial ability. Intelligence, 30(5), 425-447.
Hegarty, M., & Waller, D. (2004). A dissociation between [8]
mental rotation and perspective-taking spatial abilities. Intelligence, 32(2), 175-191.
Huk, T. (2006). Who benefits from learning with 3D models? [9]
The case of spatial ability. Journal of Computer Assisted Learning, 22, 392–404.
Hung, P. H., Hwang, G. J., Lee, Y. H., & Su, I. H. (2012). A [10]
cognitive component analysis approach for developing game-based spatial learning tools. Computers & Education, 59(2), 762-773.
Kozhevnikov, M., & Hegarty, M. (2001). A dissociation [11]
between object manipulation spatial ability and spatial orientation ability. Memory & Cognition, 29(5), 745-756. Lin, C., Chen, C., & Lou, Y. (2014). Developing spatial [12]
orientation and spatial memory with a treasure hunting game. Journal of Educational Technology & Society, 17(3), 79-92.
Lin, C. H., & Chen, C. M. (2016). Developing spatial [13]
visualization and mental rotation with a digital puzzle game at primary school level. Computers in Human Behavior, 57, 23-30.
Lin, C. H., & Liu, E. Z. F. (2009). A comparison between [14]
drill-based and game-based typing software. In Transactions on Edutainment III (pp. 48-58). Springer, Berlin, Heidelberg.
Martin Gutierrez, J., & Meneses Fernandez, M. D. (2014). [15]
Applying Augmented Reality in Engineering Education to Improve Academic Performance & Student Motivation. International Journal of Engineering Education, 30(3), 625-635.
Martin Gutierrez, J., Garcia Dominguez, M., & Roca [16]
Gonzalez, C. (2015). Using 3D virtual technologies to train spatial skills in engineering.International Journal of
Engineering Education, 31(1), 323-334.
Moreau, D., Clerc, J., Mansy-Dannay, A., & Guerrien, A. [17]
(2012). Enhancing Spatial Ability through Sport Practice. Journal of Individual Differences, 33(2), 83-88.
National Science Foundation. (2006). Tools, Multimedia [18]
Tutors Developed to Teach Visualization Skills: The National Science Foundation.
Pallant, J. (2005). SPSS Survival Manual Second Edition. [19]
United Kingdom: Open University Press.
Papastergiou, M. (2009). Exploring the potential of [20]
computer and video games for health and physical education: A literature review. Computers & Education, 53(3), 603-622.
Roca-González, C., Martin-Gutierrez. J., García-Dominguez, [21]
M. & Carrodeguas, M. (2017). Virtual Technologies to Develop Visual-Spatial Ability in Engineering Students. EURASIA Journal of Mathematics Science and Technology Education. 13(2):441-468.
Shepard, R. N., & Metzler, J. (1971). Mental rotation of [22]
three-dimensional objects. Science, 171(3972), 701-703. Slavin, R.E. (2011). Educational psychology: Theory & [23]
practice. 10th ed. Boston: Allyn & Bacon.
Spence, I., Yu, J. J., Feng, J., & Marshman, J. (2009). [24]
Women match men when learning a spatial skill. Journal of Experimental Psychology: Learning, Memory, and Cognition, 35(4), 1097.
Uttal, D. H., Meadow, N. G., Tipton, E., Hand, L. L., Alden, [25]
A. R., Warren, C., & Newcombe, N. S. (2013). The malleability of spatial skills: A meta-analysis of training studies. Psychological bulletin, 139(2), 352.
Vandenberg, S. G., & Kuse, A. R. (1978). Mental rotations, a [26]
group test of three-dimensional spatial visualization. Perceptual and motor skills, 47(2), 599-604.
Ventura, M., Shute, V., Wright, T. J., & Zhao, W. (2013). An [27]
investigation of the validity of the virtual spatial navigation assessment. Frontiers in psychology, 4, 852.
Wilcox, R. R. (1998). Simulation results on extensions of the [28]