DEVELOPMENT OF CONTINUOUS SURFACE WAVE SYSTEM FOR
STIFFNESS TESTING
Hidayat Zahari
1,A, Aziman Madun
2,B, Saiful Azhar Ahmad Tajudin
3, Faizal Tajul
Baharuddin
4, Samsul Haimi Dahlan
5, Mohd Hazreek Zainal Abidin
6, and Ian
Jefferson
71,5Faculty of Electrical and Electronic, Universiti Tun Hussein Onn Malaysia, 86400 Batu Pahat, Johor
MALAYSIA.
2,3,4,6Faculty of Civil Engineering and Environment, Universiti Tun Hussein Onn Malaysia, 86400 Batu
Pahat, Johor MALAYSIA.
7School of Civil Engineering, University of Birmingham,UK
a[email protected],b[email protected]
Keywords: continuous surface wave, stiffness, nondestructive test
The measurement of a small strain stiffness can be conducted via measuring the velocity of the material. The stiffness is an indicator for the strength of the material. It is important parameter to understand the response of the material when it received the loads. The seismic surface wave has an advantage technique to measure the stiffness of the materials due to factors of time consuming and non destructive method. In addition, the test can be conducted on the surface of the material, thus ease to conduct the test. The continuous surface wave is using a steady state seismic source which can be controlled it frequency. Thus, sufficient energy at specified frequency can be obtained. This can be influenced the quality and reliability of the data. In addition the stiffness at specified depth can be identified. In this paper, in-house development of the equipment and system was described. A few testing were conducted on different materials in order to assess the reliability of the developed system as well as the stiffness of the materials. As a result, the the stiffness assesment on the concrete mortar, asphalt pavement and concrete wall showed the values were in the range of 0.51 GPa to 0.72 GPa, 1.39 GPa to 1.76 GPa and 3.48 GPa to 3.78GPa respectively.
Introduction
of the wave travelled through the propagation medium. The velocity, then can be transformed to stiffness of the material. Currently, the material stiffness measurement was conducted using the ultrasonic wave technique, which is focused on estimating the overall stiffness. The seismic surface wave technique offers to determine the stiffness in function of depth. In addition, this technique is very suitable for inspecting the integrity of the structure of the heritage buildings. In a few cases, the structure deterioration cannot be seen with naked eyes. So to overcome these matters, the non-destructive technique should be adopted to identify the affected areas quickly and in a cost effective way. This surface wave technique had been used by many researchers, in various applications such as in monitoring of soil stiffness during ground improvement using seismic wave [3][4][5] and in surfaces wave velocity methods that are used for determining moduli of the ground in situ at low strain .
Experimental Setup and Procedure
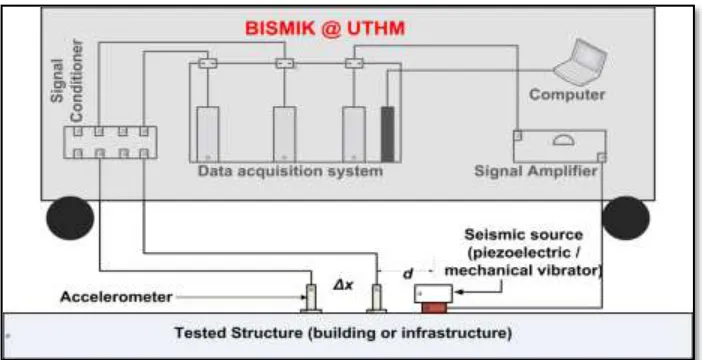
Based on figure 1, source with a piezoelectric transducer are applied on the tested material which is, the mortar to perform the test. An impact source on a surface of tested material is used to generate the Rayleigh waves. The energy of Rayleigh waves from the source propagate mechanically along the surface of media and their amplitude decrease rapidly with depth [6]. The development of more powerful computers for signal processing and for numerical analysis has enabled the CSW method to be more practical [7]. The experiment will be carried out by using computer system with DAQ platform are shown in figure 1. The test required a vertically oriented impact source from piezoelectric transducer enabling the generation of Rayleigh wave over a wide frequency bandwidth. The receivers are arranged to be in line with the source are shown in Figure 1.
[image:2.612.158.509.417.597.2]
Figure 1: Hardware setup for data acquisition platform and arrangment of testing
Spectral Analysis of Field Raw Data
the relative phase between the receivers as a function of frequency [8][9]. When waves travel on the surface material, the frequency signal output will be loss and recorded signal with variation from the source uniformly decreasing in amplitude [8]. Therefore, using higher frequencies implies the increasing of material absorption, thus the field data result lower than the actual signal source because of the signal noise ratio [10]. From the spectral data analysis, the estimation of phase difference between signals from mono frequency source can be made by using a match between the shapes of the waveforms [11].
Sensor Spacing
The array of receiver consisted of two piezoelectric accelerometers. The receiver array was then moved after each measurement in order to obtain the data for each range between the source and the receiver. By using the constraint from the empirical study for the near offset constraint of the distance between the source and the first receiver, dmin is recommended in the paper [8][11][12] as
a function of the surface wave wavelength. Therefore, by assuming the Rayleigh wave phase velocity as 300 m/s to 400 m/s, the applicable frequency range of the piezoelectric transducer was between the 500 Hz to 10 KHz. The excitation from the piezoelectric transducer consisted of 1 s continuous wave shaded with the hamming window in order to reduce the spectral lobes and increase the dynamic range of the narrow band in interest. By using stepped frequency approach, the frequency was varied with a step size of 100Hz. For each frequency step, 10 repetitive measurements were obtained for averaging the data collection and make the data more precise and reliable.
Result and Analysis
The energy introduced by the seismic source needs to control by the tester due to the arrangement and spacing of the receiver itself. Therefore, this may easy to control the constraint such as the upper limit of the frequency and also the useful distance between source and the both receivers. From the CSW testing, this application is the reliable data gathering. The time domain data, has been windowed by using the hamming window which is can increase the signal noise ratio in order to collected and grouped the reliable data of the certain frequency given. Another aspect is the fast capturing data by using the sensor that applicable to capture the signal from 1 Hz to 10000 Hz at one 1 s. Therefore, the data taken is more precise at certain frequency. Furthermore, this study has introduced the stepped frequency. By using this approach, it will reduce the time at the field testing work and also at the experiment's laboratory. The control properties of concrete mortar was used as the tested material. The concrete mortar block with dimension of 1.5m x 1m x 1m (length, width, depth) was casted. The phase velocity can be used as an indicator to calculate the stiffness material by governing the equation of stiffness, shear modulus=(phase velocity x 1.1)^2 x bulk density [11].
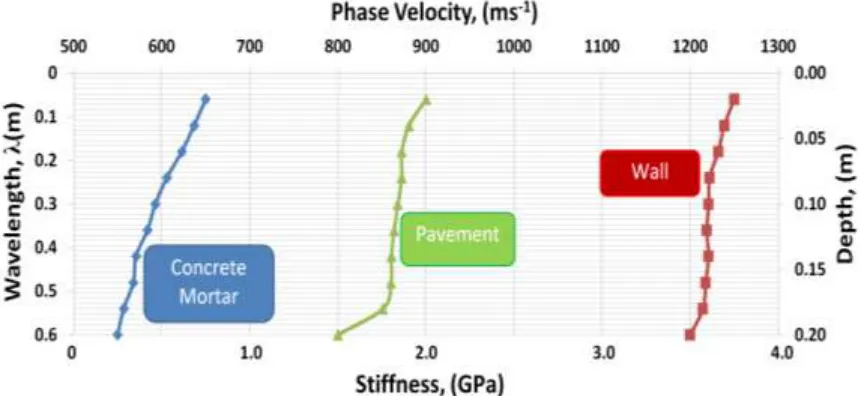
Figure 2 : Phase velocity and stiffness versus wavelength and depth plot for concrete mortar, pavement and wall
[image:4.612.102.506.497.561.2]Moreover, a different type of materials were also tested in order to evaluate the developed testing system. The tests on the asphalt pavement and concrete wall were conducted on the site. The similar experimental procedure and setup starting with frequency between 500 Hz and 10KHz and the sensor spacing were varied from 50 mm to 200 mm. The quality of the seismic data is controlled by the distance of the sensor to the source and the frequency of the wave. In comparison, higher frequency much quicker to attenuate compare to low frequency seismic wave. Thus the distance of the seismic source to sensor controlled the reliable frequency. Due to the continuous seismic surface wave system was conducted using the frequency step, where each 10 repetitive measurements were conducted, thus the reliability of the data can be assessed . Table 1 summarized the range of phase velocity and stiffness results for the different materials.
Table 1: Stiffness and phase velocity result for different materials
Material Phase Velocity, ms-1 Stiffness, GPa
Concrete Mortar 550-650 0.51-0.72
Wall 1200-1250 3.48-3.78
Pavement 800-900 1.39-1.76
Conclusion
Acknowledgements
The authors would like to thank the Universiti Tun Hussein Onn, Malaysia, and the Ministry of Education Malaysia, for the research funding grant, FRGS vot. 1061.
References
[1] C.R.I. Clayton, Stiffness at small strain: research and practise, Geotechnique, 61(1) (2011) 5-37.
[2] A. Madun, I. Jefferson, D.N. Chapman, M.G.Culshaw, K.Y. Foo and P.R. Atkins, Evaluation of the multi-channel surface wave analysis approach for the monitoring of multiple soil-stiffening columns, Near Surface Geophysics, 8(6) (2010) 611-621.
[3] A. Madun, I. Jefferson, K.Y. Foo, D.N. Chapman, M.G.Culshaw and P.R. Atkins, Characterization and quality control of stone columns using surface wave testing, Canadian Geotechnical Journal, vol. 49 (2012) 1357-1368.
[4] A.L. Moxhay, R.D. Tinsley and J.A. Sutton Monitoring of soil stiffness during ground
improvement using seismic surface wave. Ground Engineering Magazine, January (2001) 34-37.
[5] B. Luke, Site investigations function better with seismic waves, IEEE Potentials, 18(1), Feb.-March (1999) 33-35.
[6] M.N. Omar, C.P. Abbiss, M.R. Taha and K.A. Mohd Nayan, “Prediction of long-term settlement of soft clay using the continuous surface wave method and damping measurement,” In 8th International Conference in Geotechnical and Transportation Geotropika (2010), Sabah 1-3 December 2010.
[7] M. A. Ismail, A. R. Samsudin, A. G. Rafek, and K. A. M. Nayan, “Road Pavement Stiffness Determination using SASW Method,” Unimas E-Journal of Civil Engineering, vol. 3(2012),
pp. 9-16.
[8] M.O. Al-Hunaidi, Insight on the SASW non-destructive testing method, Canadian Geotechnical Journal, 20(1993) 940–950.
[9] M.O. Al-Hunaidi, Difficulties with phase spectrum unwrapping in spectral analysis of Surface waves nondestructive testing of pavement, Canadian Geotechnical Journal, 29(3) (1992)
506-511.
[10] B. Piwakowski, A. Fnine, M. Goueygou, and F. Buyle-Bodin, “Generation of Rayleigh waves into mortar and concrete samples,” Ultrasonics, vol. 42(2004), pp. 395–402.
[11] M.C. Matthews, Y.S. Hope and C.R.I. Clayton, The use of surface waves in the determination of ground stiffness profiles. Proceedings of the Institution of Civil Engineers Geotechnical Engineering, 119(1996) 84-95.