International Journal of Emerging Technology and Advanced Engineering
Website: www.ijetae.com (ISSN 2250-2459, Volume 2, Issue 6, June 2012)384
Integrated Computing System for Measuring
Driver Safety Index
Shashanka Chigurupati
1, Sowmya Polavarapu
2, Yasesvi Kancherla
3, A. Kousar Nikhath
41, 2, 3 B-Tech Graduate, Computer Science and Engineering, VNR VJIET, Hyderabad, India 4Assistant Professor, Department of Computer Science and Engineering, VNR VJIET, Hyderabad, India
2 [email protected] 3[email protected] 4 [email protected]
Abstract— The objective of this paper is to design and build a vehicle mounted system to make the drivers aware of the quality of their driving and to provide a safety index to each driver which will reflect their ability to drive safely over prolonged periods. The safety index generated can be used to reward or retrain the drivers as a strategy to reduce the accidents. The parameters considered for computing the Safety Index are acceleration, speed and road traffic conditions. As the present day tablets and high end mobile devices have all the sensors to get the above data, android platform is used to develop an integrated application for rating driver’s performance.
Keywords- Android, Accelerometer, Camera, Driver Safety Index, GPS.
I. INTRODUCTION
The work reported here is inspired by the United Nations Call for “Decade of Action for Road Safety” [1]. It is revealed in various United Nations and related World Health Organization reports that nearly 1.3 million people are killed in road traffic crashes globally and the number injured could be as high as 50 million. The corresponding Indian figures are 1.3 lakh deaths and 15 lakh injuries. Road traffic injuries and deaths threaten to hinder achievements in economic and human development. Road
traffic injuries place a heavy burden on a country„s
economy as a result of their direct impact on healthcare and rehabilitation services, as well as through indirect costs. With a resolution on 10 May 2010, the UN General Assembly proclaimed the period 2011–2020 as the Decade of Action for Road Safety (officially launched on 11 May 2011), with a goal to stabilize and then reduce the forecast level of road traffic fatalities around the world by increasing activities conducted at the national, regional and global levels.
It is evident that this is a serious global problem and shaping a solution for this problem is the need of the hour especially for a country like India where the number of vehicles on the road increases geometrically without corresponding increase in new road networks.
The global and Indian statistics [4] reveal that 90% of the traffic accidents happen due to driver‟s mistakes. This revelation is noted and an attempt was made to provide the fillip for using contemporary technology to directly motivate the drivers towards the attitude that cause less or no accidents. The result is the product ―integrated computing system for measuring driver safety index. This helps to reduce the rate of accidents, injury and death associated with road transport caused by driver‟s faults. The software is geared toward companies who employ drivers and seek to ensure safety. The logged data help the management to take appropriate action on their drivers. On successful completion the project can be implemented in school buses and public transport. The Project is designed to help drivers drive safer by monitoring hard acceleration, hard deceleration and swerves. People who are aware of being observed tend to modify their behavior. This phenomenon could potentially be used to encourage individuals to behave more safely when driving if there were means of providing feedback to the drivers about their behavior on the road. The project offers such a means of providing feedback by confronting drivers with their recorded driving actions.
Android Platform
International Journal of Emerging Technology and Advanced Engineering
Website: www.ijetae.com (ISSN 2250-2459, Volume 2, Issue 6, June 2012)385 Handset Alliance devices. Tablet PCs and smart phones are becoming more available and cheaper from brand name firms. So, the equipment is affordable, rugged and easily installable in a vehicle.
II. PROPOSED SYSTEM
The application uses data from accelerometer sensor, GPS sensor and video recorded from camera to give rating for the driver. Now, through a reward or retrain system based on safety index generated through this application, it is possible to reduce the number of accidents occurring due to driver„s attitude and lack of training. The video based feedback can be used to retrain the driver and improve performance. This system can be used to monitor driver behavior from vehicle data acquisition equipment (tablet pc), which captures audio and video signals, GPS values, acceleration and deceleration forces. The proposed system evaluates the driver performance from time to time. The rating given can be used as a benchmark for performance of drivers, especially of an organization.
Advantages
1) This approach helps us to shed more light on novice driving behavior, as a systematic observation of behavior in real traffic circumstances is possible. 2) This system can be used to monitor novice driver
behavior from the learner period up to two months after passing the driving test with in vehicle data acquisition equipment, which captures audio and video signals as well as acceleration and deceleration forces.
3) The proposed system evaluates the driver performance
from time to time. The rating given can be used as a benchmark for hike in the salary of drivers, especially of an organization.
4) Organizations such as schools can ensure the parents that their children are in safe hands by showing them the evaluation results obtained by using this system on demand.
5) The evaluation results obtained by using this system can be used by transport organizations and schools can advertise about the safe driving skills of their drivers. 6) Helps institutions including schools and corporate to
seek road safety ISO 39001 certification [5].
III. METHODOLOGY
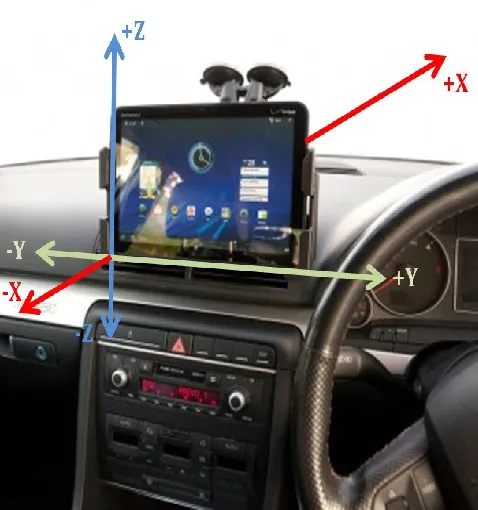
An Android Tablet PC was used for testing. The tablet is fixed to the windshield of the car or bus with the help of suction holder as show in Figure 1.
[image:2.612.324.563.427.682.2]The driver starts the application at the beginning of the trip. After reaching the destination, the driver stops the application. Whenever the driver drives aggressively it is considered as an event. An event may be due to aggressive turning, swerves or sudden braking. The inbuilt 3-axis accelerometer can be used to find the corresponding acceleration values in all the three directions. Thresholds should be defined [2, 3] in all the directions (shown in Table 1) to identify typical driving. The administrator then checks the events and deletes any unnecessary events which are unavoidable and finalizes the events. The software then gives the performance rating for the driver based on the finalized events. During the journey values from the accelerometer are used to detect driving events like hard braking, sudden acceleration or aggressive turning. The GPS is used for tracking the driver and detecting excessive speed events. Once an event is detected, corresponding videos 10 seconds prior to and after the event occurrence are logged. At the end of the session the driver can be rated for his driving behavior based on the logged data.
International Journal of Emerging Technology and Advanced Engineering
Website: www.ijetae.com (ISSN 2250-2459, Volume 2, Issue 6, June 2012)386 Process Flow
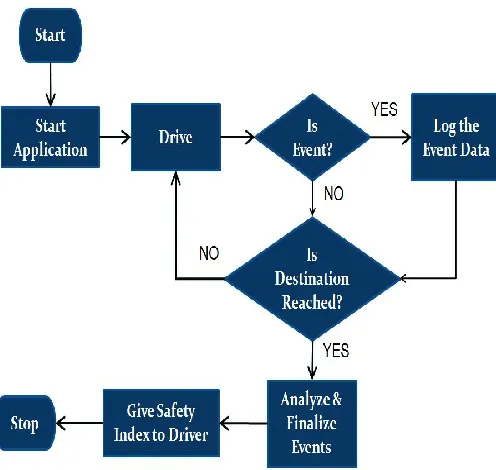
Figure 2 shows the process flow of the entire system. First the application is started and then the vehicle is driven. The application then continuously checks for the occurrence of event. When any event occurs it logs the event data. When the destination is reached the events are analyzed and finalized to give safety index to the driver. After giving the safety index the application is stopped.
[image:3.612.318.570.196.299.2]
Figure 2: Process Flow of the entire project
IV. RESULTS
The device used for testing was an Android-based tablet, Motorola Xoom. The application was tested at PVR Express High Way, Hyderabad. The figures 3, 4, 5 and 6 shows the graphs generated for the acceleration values from the 3-axis accelerometer at various driving conditions during test run. After analysing the accelerometer values the thresholds for event identification are confirmed. Table 1 shows range of acceleration or deceleration values for the safe driving. Whenever the accelerometer values exceed the safe limits it would be considered as an event.
TABLEI
RECOMENDED RANGE OF ACCELERATION OR DECELRATION VALUES FOR SAFE DRIVING
Axis Direction Typical Driving Zone(m/sSafe 2)[2, 3]
x Front/rear Accelerating / Braking -3 to +3
y Left/right Turning / Swerves / Lane Change -3 to +3
z Up/down Bumps / Road Anomalies -8 to -11
Figure 3 shows the graph generated for aggressive right turn which is recorded using y-axis of the accelerometer
Figure 3: Aggressive right turn recorded using y-axis of accelerometer
[image:3.612.52.300.269.504.2] [image:3.612.331.551.358.593.2]International Journal of Emerging Technology and Advanced Engineering
Website: www.ijetae.com (ISSN 2250-2459, Volume 2, Issue 6, June 2012) [image:4.612.323.562.128.323.2]387 Figure 4: Aggressive left turn recorded using y-axis of
[image:4.612.51.284.129.325.2]accelerometer
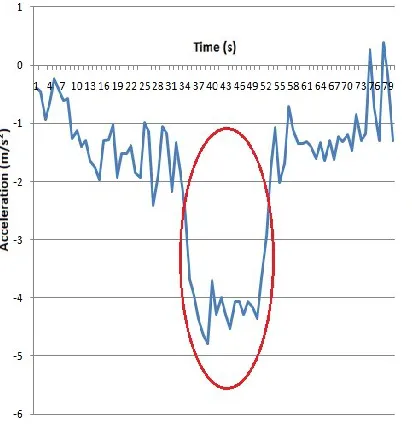
Figure 5 shows the graph generated for sudden brake which is recorded using x-axis of the accelerometer.
Figure 5: Sudden brake recorded using x-axis of accelerometer
Figure 6 shows the graph generated for speed bump which is recorded using z-axis of the accelerometer
Figure 6: Speed bump recorded using the z-axis of accelerometer
V. CONCLUSION
This paper focused on the design of an integrated application for rating the driver by considering the road conditions, acceleration and speed. The usability of this system in the road transport would be highly useful to reduce accidents due to negligent driving. This system helps to maintain a detailed track record of the driving. It would be very helpful for the administrator to view the concise data for the analysis. This method offers a better way of rating the driver which would help the management to take necessary action. In future some additional functionalities like live transmission of data from the vehicle to the central station and also use some image processing techniques for processing the video, thus automating the entire system without admin for analyzing the videos can be added.
Acknowledgement
We are indebted to Dr. D. Nageswara Rao, General Secretary, VNRVJIET, for his help and guidance.
[image:4.612.52.258.403.619.2]International Journal of Emerging Technology and Advanced Engineering
Website: www.ijetae.com (ISSN 2250-2459, Volume 2, Issue 6, June 2012)388 Our sincere thanks to Dr. N. Balaji, Head of Research and Consultancy Center of VNRVJIET for his esteemed guidance and providing all the resources needed for this work.
References
[1] Secretary-General, 30 September 2011, Improving global road
safety, United Nations General Assembly, Available:
http://www.who.int/roadsafety/about/resolutions/sept_2011_sg_repo rt_en.pdf
[2] El Hosin Gazali, October 2010, Monitoring Erratic Driving Behaviour caused by Vehicle Overtaking using Off-the-shelf Technologies, Available: http://www.scss.tcd.ie/publications/tech-reports/reports.11/TCD-CS-2011-03.pdf
[3] Michael Gatscha (TTI), Christian Brandstätter & Jürgen Pripfl (KfV), 20 December 2010, Video-based feedback for learner and novice drivers - A small-scale ND study in Austria, Available:
http://www.prologue-eu.eu/fileadmin/content/Dokumente/PROLOGUE_D3.3.pdf
[4] S.K. Mishra, Director (Road Transport), Govt. of India, ROAD SAFETY IN INDIA
[5] Ref.: 1426, 12 May 2011, ISO standards support UN Decade of
Action for Road Safety, Available:
http://www.iso.org/iso/pressrelease.htm?refid=Ref1426