Journal of Chemical and Pharmaceutical Research, 2017, 9(5):53-59
Research Article
CODEN(USA) : JCPRC5
ISSN : 0975-7384
53
Study of Intermolecular Interaction in Risperidone and Polyethylene Glycol
Suspension
Priti Kabra and OP Chimankar
*Department of Physics, Acoustic Research Laboratory, RTM Nagpur University, Nagpur, India _____________________________________________________________________________
ABSTRACT
The speed of sound can be considered to evaluate acoustical parameters and hence, to investigate physico-chemical properties of drug polymer suspension. Investigations of these physico-chemical properties enable to understand the nature and strength of particle-liquid interactions. The suspensions were made up of a 1:1, 1:2, 1:3, 1:4, 1:5 mixtures by weight of drug Risperidone and Polyethylene Glycol by using ultrasonic probe sonicator. The product was further characterized by using techniques such as scanning electron microscopy (SEM), fourier transform infrared spectrocopy (FTIR). Ultrasonic velocity, density, and viscosity have been measured for different suspension at different temperature ranging from 283 K to 323 K. Different acoustical parameters, such as adiabatic compressibility, relaxation time, acoustic impedance, are evaluated from experimental data. It is found that drug-polymer interaction increases significantly for 1:3 ratios, which indicates formation of cluster and strong drug polymer interaction.
Keywords : Ultrasonic; Drug-polymer suspension; Interaction; Acoustical parameters; Characterization
_____________________________________________________________________________
INTRODUCTION
Drug delivery has become increasingly important mainly due to the awareness of the difficulties associated with a variety of old and new drugs. Of the many polymeric drug delivery systems, biodegradable polymers have been used widely as drug delivery systems because of their biocompatibility and biodegradability. The majority of biodegradable polymers have been used in the form of microparticles, from which the incorporated drug is released to the environment in a controlled manner. The factors responsible for controlling the drug release rate are physicochemical properties of drugs, degradation rate of polymers, and the morphology and size of microparticles [1]. In the recent years, the ultrasonic non-destructive pulse-echo technique has been found to be one of the best techniques to characterize the acoustical properties of materials [2]. The physicochemical behaviour and molecular interaction in pure liquid components and their mixture is studied on the basis of acoustic and thermodynamic properties [3].The ultrasonic study is also useful to understand behavior of biomolecules [4]. Literature survey shows that ultrasonic study of liquid mixture is highly useful in understanding the nature of molecular interaction [5-7] and physicochemical behavior of liquid mixture [8-10]. Ultrasound is a useful tool in nearly every case where a liquid and a solid must react. Furthermore, since ultrasound can radiate through large volumes of liquid, it is well suited for industrial applications. [11] For these reasons future applications of ultrasound in chemical reactions will be in diverse. In the synthesis of pharmaceuticals, ultrasound will improve chemical yields over conventional methods. The study of molecular interactions in liquids provides valuable information regarding internal structure, molecular association, complex formation, internal pressure etc. Ultrasonic technique reveals very weak intermolecular interactions due to its useful wavelength range [12].
54
behavior of one of the antipsychotic drug Risperidone with polymer PEG to discuss the interactions between them. Risperidone is a potent antipsychotic drug which is mainly used to treat schizophrenia. Risperidone is effective for treating the positive and negative symptoms of schizophrenia owing to its affinity for its “loose” binding affinity for dopamine D2 receptors and additional 5-HT antagonism compared to first generation antipsychotics, which are strong, non-specific dopamine D2 receptor antagonists [13]. According to BCS, Risperidone is a class II compound, that it has poor water solubility and consequently, a dissolution rate-limited absorption through the gastrointestinal tract (GIT), so there is a need to develop suitable dosage form which will give better solubility and bioavailability. It is having half-life 20 hours (oral), 2.9-6 days. [14]
The ability of PEG to influence the pharmacokinetic properties of drugs and drug carriers is currently utilized in a wide variety of established and emerging applications in pharmaceutics. The change in the pharmacokinetics of administered drugs by being shielded by or bound to PEG, results in prolonged blood circulation times. This consequently increases the probability that the drug reaches its site of action before being recognized as foreign and cleared from the body [15].
The present study is aimed at developing microparticle based novel drug delivery system containing Risperidone. Microparticles of Risperidone has been developed using solvent evaporation method. Effect of drug-polymer ratio in internal phase on microparticle formulation was studied.
MATERIALS AND METHODS
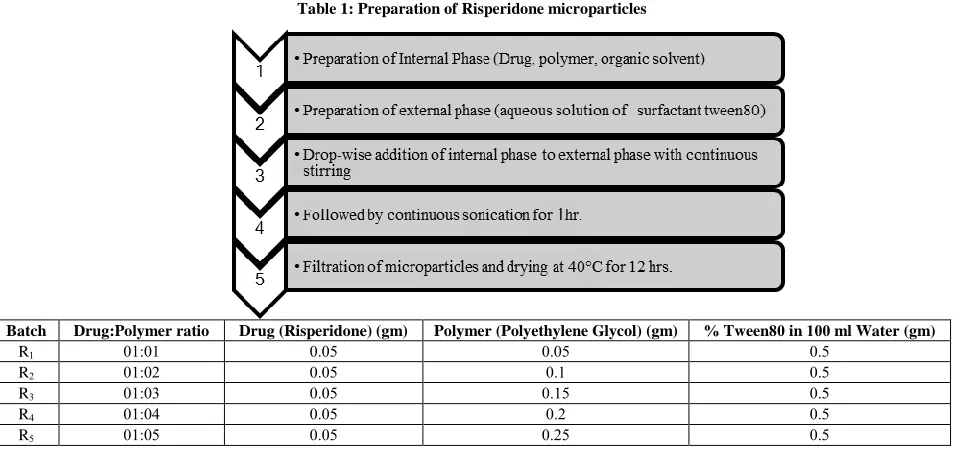
Risperidone was obtained as gift sample from Ipca Laboratories Ltd. Sejavta, Ratlam. Polymer used is Polyethylene Glycol. All other chemicals and solvent were of analytical grades. Effect of drug-polymer ratio in internal phase on microparticles formulation was studied. Five different ratios of drug to polymer were employed to determine the effect of drug-polymer ratio on physical characteristics. In each formulation the amount of drug was kept constant at 0.5 gm and amount of polymer were changed.
[image:2.612.70.550.390.617.2]Preparation of Risperidone microparticles (Table 1):
Table 1: Preparation of Risperidone microparticles
Batch Drug:Polymer ratio Drug (Risperidone) (gm) Polymer (Polyethylene Glycol) (gm) % Tween80 in 100 ml Water (gm)
R1 01:01 0.05 0.05 0.5
R2 01:02 0.05 0.1 0.5
R3 01:03 0.05 0.15 0.5
R4 01:04 0.05 0.2 0.5
R5 01:05 0.05 0.25 0.5
55
RESULTS AND DISCUSSION
FTIR study
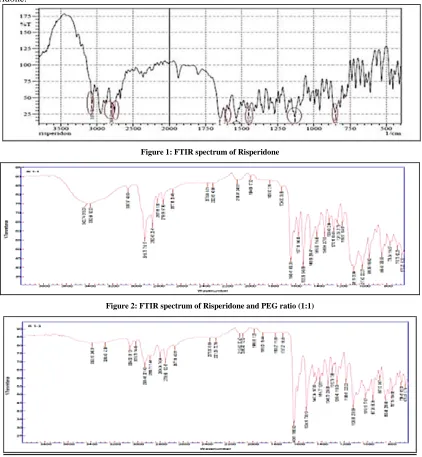
[image:3.612.96.518.184.641.2]Pure drug, polymer and all five ratios are characterized by FTIR. FTIR spectrum of procured Risperidone was recorded Figure 1 and spectral interpretation was done. The characteristics IR absorption peaks of Risperidon at 3070 cm-1 (C-H bending), 1651 cm-1 (C=O Amide/pyridopyrimidinone), 1130 (C-F stretch Fluoride), 2804 cm-1 (C-H stretching) and1060 cm-1 (C-N Amines) were there in drug sample spectrum; which confirmed the purity of Risperidone.
Figure 1: FTIR spectrum of Risperidone
Figure 2: FTIR spectrum of Risperidone and PEG ratio (1:1)
56
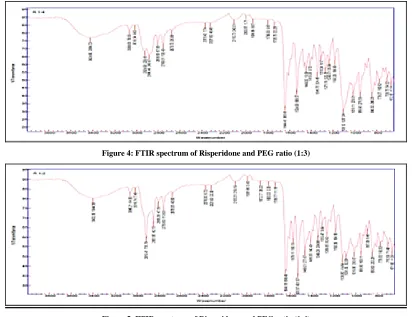
Figure 4: FTIR spectrum of Risperidone and PEG ratio (1:3)
Figure 5: FTIR spectrum of Risperidone and PEG ratio (1:4)
Drug-polymer interaction study
To check out any possible interaction between drug and polymer used, compatibility study using FTIR was carried out. FTIR spectroscopic study results discovered no any new peak appearance or disappearance of existing peaks, discarding any chemical interaction probability amongst drug and polymer used. The characteristic peaks at 3069 cm-1 (C-H bending), 1648 cm-1 (C=O Amide/pyridopyrimidinone), 1194 (C-F stretch Fluoride), 2809 cm-1 (C-H stretching) and 1022 cm-1 (C-N Amines) were recognized in all spectra (Figures 2-5). All characteristic peaks of Risperidone were experiential in physical mixture spectrum. Thus, IR spectroscopy results depicted that Risperidone was compatible with selected polymer and possess good stability.
Scanning electron microscope
The surface morphology of drug polymer suspension and pure drug was examined by SEM. In order to study the further transformation of selected suspension into solid intermediatesand their redispersion in water, the suspensions were filtered after preparation. The SEM image of the drug and microsuspension showed a significant difference in the morphology of these particles. Drug polymer suspension sample was appeared to spherical with the mean particle size of 1 micrometre (Figure 6b). They are having narrow distribution index, while SEM of the drug showed coarse, irregular, more elongated (Figure 6a).
Ultrasonic characterization
57
Figure 6: a) Scanning electron microscope of pure risperidone; b) Scanning electron microscope of formulation
1:1 1:2 1:3 1:4 1:5
1480 1490 1500 1510 1520 1530 1540 1550 1560 1570 1580 1590
ve
lo
ci
ty
(m/
se
c)
ratio
[image:5.612.122.491.71.234.2]283 K 293 K 303 K 313 K 323 K
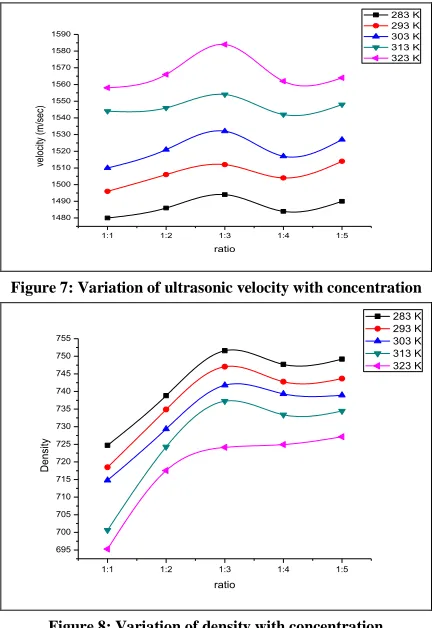
Figure 7: Variation of ultrasonic velocity with concentration
1:1 1:2 1:3 1:4 1:5 695
700 705 710 715 720 725 730 735 740 745 750 755
D
en
si
ty
ratio
283 K 293 K 303 K 313 K 323 K
Figure 8: Variation of density with concentration
From graphical representation it is observed that the ultrasonic velocity, density, viscosity, acoustic impedancer, relaxation time, increases at Risperidone–Polyethylene Glycol ratio 1:3. However adiabatic compressibility decreases as polymer increases in suspension.
[image:5.612.198.415.268.582.2]58
1:1 1:2 1:3 1:4 1:5
[image:6.612.191.423.63.692.2]0.002 0.004 0.006 0.008 0.010 0.012 visco sit y (Pa .se c) ratio 313 K 323 K
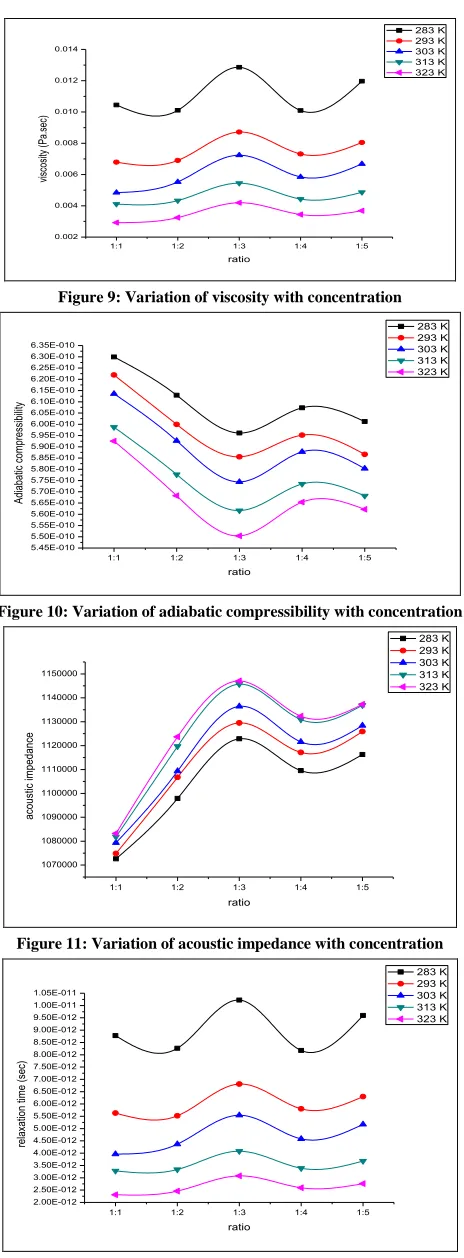
Figure 9: Variation of viscosity with concentration
1:1 1:2 1:3 1:4 1:5
5.45E-010 5.50E-010 5.55E-010 5.60E-010 5.65E-010 5.70E-010 5.75E-010 5.80E-010 5.85E-010 5.90E-010 5.95E-010 6.00E-010 6.05E-010 6.10E-010 6.15E-010 6.20E-010 6.25E-010 6.30E-010 6.35E-010 Ad ia ba tic co mp re ssi bi lit y ratio 283 K 293 K 303 K 313 K 323 K
Figure 10: Variation of adiabatic compressibility with concentration
[image:6.612.190.422.390.686.2]1:1 1:2 1:3 1:4 1:5 1070000 1080000 1090000 1100000 1110000 1120000 1130000 1140000 1150000 aco ust ic imp ed an ce ratio 283 K 293 K 303 K 313 K 323 K
Figure 11: Variation of acoustic impedance with concentration
1:1 1:2 1:3 1:4 1:5
2.00E-012 2.50E-012 3.00E-012 3.50E-012 4.00E-012 4.50E-012 5.00E-012 5.50E-012 6.00E-012 6.50E-012 7.00E-012 7.50E-012 8.00E-012 8.50E-012 9.00E-012 9.50E-012 1.00E-011 1.05E-011 re la xa tio n time (se c) ratio 283 K 293 K 303 K 313 K 323 K
59
Figure 8 shows plot of density versus drug-polymer ratio. Increase in density at ratio 1:3 decreases the volume indicating association in component molecules [17].Figure 9 consists of plot of viscosity with drug-polymer ratio. The viscosity of mixture strongly depends on the entropy of mixture, which is related with liquid structure as well as molecular interaction between the components of the mixtures [18]. Figure 9 shows variation of adiabatic compressibility, it is observed that there is gradual decrease of adiabatic compressibility with increase in temperature, which is due to strenghthening of intermolecular forces with the supply of heat energy [19]. From Figures 10-12, Relaxation time increase indicates subsequent increase in relaxation of molecules [20].
CONCLUSION
The non-uniform variation in the acoustical parameters proves that there is considerable amount of interactions between Risperidone and Polyethylene glycol molecules. At both R3 and R5 batch; the drug polymer interaction predominates over other ratio.
The FTIR spectra of microparticles showed the characteristick peaks of Risperidone this suggested that there was no change in the Risperidone chemical structure during processing. Thus FTIR results depicted that Risperidone was compatible with selected polymer and posssess good stability.
In images of Scanning electron microscope of microparticles it was found that Risperidone microparticles
revealed a smooth texture. The SEM picture of pure drug particles was abundantly found with larger particle size when compared to formulation. Thus, Polyethylene Glycol produced better surface characteristics. The surface structure of microparticles in the SEM appeared good in shape.
This wide spectrum of applications suggests that ultrasonic may enjoy an even large number of future applications for the drug industry.
ACKNOWLEDGEMENT
The authors are grateful to R.T.M. Nagpur University for providing financial support to this work through University Research project scheme.
REFERRENCES
[1] L Jacob; TV Abhilash; S Abraham. Asian J Pharam Clin Res. 2017, 10(2), 153-156.
[2] AA Alya; EA Ishaka; AA El Moneimb; MD Alenezyc; NS Abd El. J Chem Pharm Res. 2013, 5(11),
762-767.
[3] K Sreekanth; D Sravana; M Kondaiah; D Krishna Rao. J Chem PharmRes. 2011, 3(4), 29.
[4] VD Bhandakkar; OP Chimankar; NR Pawar. J Chem Pharm Res. 2010, 2(4), 873.
[5] LR Lagemann; WSN Dunbar. J Phys Chem. 1995, 49.
[6] A Wissler. J Amer Chem Soc. 1949, 71, 1272.
[7] SS Aswale; PB Raghuwanshi; DT Tayde; SR Aswale. J Indian Chem Soc. 2007, 84, 159.
[8] JD Pandey; AK Shukla. J Pure Appl Ultroson. 1982, 15, 37. [9] SJ Bhatti; JS Vivk; DP Sing. Acoustica. 1982, 50, 291.
[10] A Nithya; S Nithyanandhan; S Mullainthan; M Rajasekaran. J Chem. 2009, 6(1), 138.
[11] YT Shah, AB Pandit, VS Moholkar. Cavitation reaction engineering. Springer Science & Business Media;
2012.
[12] SD Deosarkar; HG Jahagirdar; VB Talwatkar. Rasayan J Chem. 2010, 3(4), 755-760.
[13] S Duddelli; T Vedavathi; A Kumar; ZU Rahman; RS Kiran. IJPBS. 2013, 3(3), 290-298.
[14] MC Mauri; S Paletta; M Maffini; A Colasanti; F Dragogna; C Di Pace; AC Altamura. EXCLI J. 2014, 13:1163.
[15] K Knop; R Hoogenboom; D Fischer; US Schubert. Angew Chem Int Edit. 2010, 49(36), 6288-6308.
[16] BR Shinde; SS Jadhav; SU Shinde; DR Shengule; KM Jadhav. J Chem Pharm Res. 2011, 3(3), 432-438.
[17] F London. T Faraday Soc. 1937, 33, 8b-26.
[18] S Panda; GC Mohanty; GS Roy; S Kalia; RN Samal. J Chem Pharm Res. 2013, 5(4), 81-89.
[19] DA Zatale; AR Chaware; KD Zatale. Arch Phys Res. 2011, 2(1), 202-207.