Journal of Chemical and Pharmaceutical Research, 2015, 7(10):781-787
Research Article
CODEN(USA) : JCPRC5
ISSN : 0975-7384
Development and validation of stability indicating assay method by HPLC for
the analysis of sitagliptin phospahte in bulk drug substances
Meher Vijay Dalawai
1, Paul Douglas Sanasi
2and Hemant Kumar Sharma
11Analytical Research Department, Aurobindo Pharma Limited Research Centre-II, Survey No: 71 & 72, Indrakaran
village, Sangareddy mandal, Medak district, Andhra Pradesh, India
2Department of Engineering Chemistry, A. U. College of Engineering (A), Andhra University, Visakhapatnam,
Andhra Pradesh, India
_____________________________________________________________________________________________
ABSTRACT
The present paper describes the development of a stability indicating reverse phase liquid Chromatography (RPLC) method for Sitagliptin phospahte in the presence of its impurities and degradation products generated from forced decomposing studies. The drug substance was subjected to stress conditions of hydrolysis, oxidation, UV and thermal degradation. The degradation of Sitagliptin was observed under acid, base and oxidative hydrolysis .The drug was found to be stable to other stress conditions attempted. Successful separation of the drug from the synthetic impurities and degradation product formed under stress conditions was achieved on a symmetry shield C18 column, 150mm, 4.6mm, 3.5µ using a mixture of 0.3% perchloric acid and methanol (70:30, v/v) as mobile phase. The developed HPLC method was validated with respect to linearity, accuracy, precision, specificity and robustness. The developed HPLC method is to determine the assay of Sitagliptin phosphate and can be used to evaluate the quality of regular production samples. It can be also used to test the stability samples of Sitagliptin phosphate.
Key words: Reverse Phase Liquid Chromatography, Sitagliptin phosphate assay, Degradation products, Method validation, Stability indicating.
_____________________________________________________________________________________________
INTRODUCTION
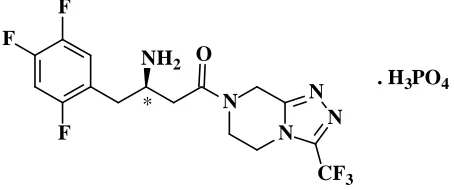
Sitagliptin Phosphate is described chemically as 7-[(3R)-3-amino-1-OXO-4-(2,4,5-trifluorophenyl)butyl]-5,6,7,8-tetrahydro-3-(trifluoromethyl)-1,2,4-triazolo[4,3-a]pyrazine, monophosphate (Fig.1).
Sitagliptin is used for the treatment of type 2 diabetes. It is effective in lowering of HbA1c, fasting as well as postprandial glucose in monotherapy and in combination with other oral anti diabetic agents. It stimulates insulin secretion when hyperglycemia is present and inhibits glucagon secretion. Sitagliptin is a highly selective DPP-4 inhibitor that has approved for type2 diabetes therapy[1-6]
F F
F
NH2
N O
N N
N
CF3
. H3PO4
[image:1.595.193.420.652.747.2]*
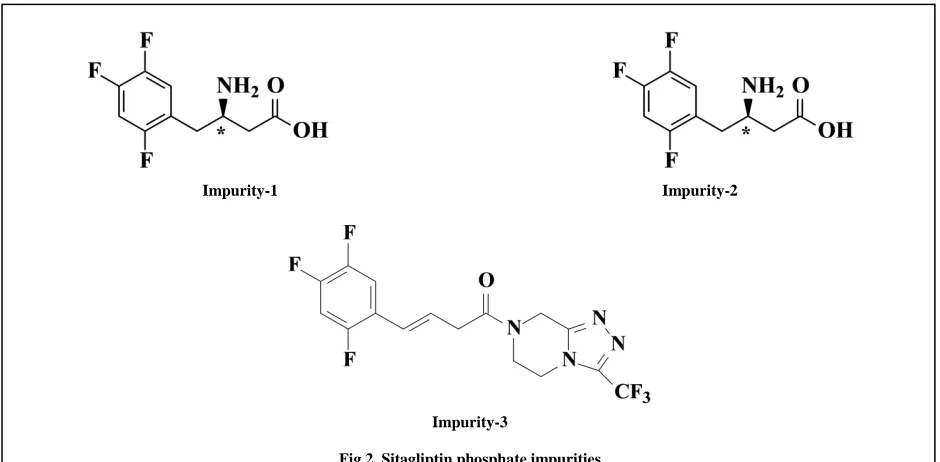
The International Conference on harmonization (ICH) guideline entitled “Stability testing of new drug substances and products” requires that stress testing be carried out to elucidate the inherent stability characteristics of active substances [7]. In literature spectroscopic method reported for determination of Sitagliptin phosphate in tablets [8,9] and HPLC method for determination of Sitagliptin with combination of other drug products [ 10-12]. Determination sitagliptin in biological fludies, human plasma and urine by LC/MS/MS and GCMS methods[13-16] are reported. There are also some methods which were reported on sitagliptin determination by HPLC methods[17-19]. To our present knowledge no stability indicating methods were reported in the literature for the determination of assay of Sitagliptin phospahte in presence of its impurity-1,impurity-2 and impurity-3 (Fig2).
An ideal stability indicating method one that quantifies the standard drug alone and also resolves its degradation products and its process impurities. Consequently, the implementation of an analytical methodology to determine Sitagliptin phospahte in bulk samples , the proposed method is simple, accurate, Linear specific, repeatable, stability indicating, reduces the duration of analysis and suitable for routine determination of Sitagliptin phospahte in Pharmaceutical samples. The current method was validated in compliance with ICH guidelines [20, 21] and its updated international convention [22, 23] A good peak shape and well separated sitagliptin peak form it impurities was observed on symmetry shield RP-18 column with in short run time using a mobile phase 0.3%perchloric acid and methanol.
Impurity-1 Impurity-2
[image:2.595.71.541.278.509.2]Impurity-3
Fig 2. Sitagliptin phosphate impurities
EXPERIMENTAL SECTION
Samples of Sitagliptin and its three impurities namely imp-1, imp-2 and imp-3 (Fig.2) was received from Aurobindo pharma, Hyderabad, India. Perchloric acid(70%w/w) of Merck, HPLC grade methanol and acetonitrile were purchased from Merck, Darmstadt, Germany. High purity water was prepared by using a Millipore Milli Q plus purification system.
Instrumentation and Chromatographic Conditions:
Method Validation: Specificity:
Specificity is the ability of the method to measure the analyte response in the presence of its potential impurities. The specificity of the developed HPLC method for Sitagliptin was carried out in the presence of its impurities namely imp -1, imp-2 and imp-3. Stress studies were performed for Sitagliptin bulk drug to provide an indication of the stability indicating property and specificity of the proposed method. Intentional degradation was attempted to stress conditions of White fluorescent light,1.2 million Lux hours and UV light (200 watt hours/m2), acid (5M HCl/85°C/120min), base (5M NaOH/room temperature/60min), oxidation (30 % H2O2/85°C/120min), humidity(90%RH/25°C/120hours) and heat (105°C/120hours) to evaluate the ability of the proposed method to separate Sitagliptin from its degradation products. Peak purity test was carried out of Sitagliptin peak by using PDA detector in stress samples. Assay studies were carried out of stress samples against qualified Sitagliptin reference standard. Assay was also calculated for Sitagliptin samples by spiking all three impurities at the specification level (i.e., 0.5%).
Precision:
The precision of the assay method was evaluated by carrying out six independent assays of Sitagliptin test samples against a qualified reference standard and calculate the % R.S.D of assay. The intermediate precision of the method was also evaluated using different analyst , different instrument and different column in the same laboratory.
Limit of detection (LOD) and Limit of Quantification (LOQ):
The detection limit of an individual analytical procedure is the lowest amount of analyte in a sample that can be detected but not necessarily quantitated as an exact value. The quantitation limit of an individual analytical procedure is the lowest amount of analyte in a sample that can be quantitatively determined with suitable precision and accuracy. The quantitation limit is a parameter of quantitative assays for low levels of compounds in sample matrices, and is used particularly for the determination of Impurities and/or degradation products. The limit of detection (LOD) and limit of quantitation (LOQ) were separately determined at a signal to noise ratio (S/N) of 3 and 10.
Linearity:
Linearity test solutions for the assay method were prepared from Sitagliptin stock solutions at five concentration levels from 80% to 120% of assay analyte concentration (80%, 90%, 100%, 110% and 120%). The peak area verses concentration data was treated by least squares linear regression analysis. The RSQ value , the Slope and % Y-intercept of the calibration curve was calculated.
Accuracy:
The accuracy of the assay method was evaluated in triplicate at three concentration levels 50%,100% and 120% of test concentration (0.25 mg mL-1) .The percentage of recoveries was calculated from the Slope and Y- intercept of the calibration curve obtained in the linearity study.
Robustness:
To determine the robustness of the developed method, experimental conditions were deliberately altered and USP plate count ,USP tailing % RSD of standard and Rt of Sitagliptin were recorded. The flow rate of the mobile phase was 1.0mL min-1.To study robustness of the method , flow was changed by 0.1 units from 0.9 to 1.1 mL min-1. The effect of the column temperature was studied at 25 and 35°C instead of 30°C. The effect of the percentage organic was studied by varying methanol by -2 to + 2 % while other mobile phase components were held constant as stated in Chromatographic conditions.
Solution stability and Mobile phase stability:
The solution stability Sitagliptin in the assay method was carried out by leaving both the solutions of sample and reference standard in tightly capped volumetric flasks at room temperature for 24 hours. The same sample solution area were recored for 1 hours interval up to the study period. The mobile phase stability was also studied. Mobile phase prepared was kept constant during the study period. The % R.S.D for the area of Sitagliptin was calculated during mobile phase and solution stability experiment.
RESULTS AND DISCUSSION
Optimization of Chromatographic conditions
The attempt was made to determine sitagliptin in presence of its impurities impurity-1,impurity-2 and impurity-3 and also with its degradents .In preliminary experiments the drug was subjected to separation by reverse –phase method using 0.02M phosphate buffer(KH2PO4) at pH3.0 in combination of acetonitrile and methanol 75:10:15
using column symmetry shield RP-18 (250*4.6,5µ).But in these conditions all the three impurities are eluted at the retention time of sitagliptin peak. Abruptly changed the buffer to 0.1% perchloric acid(pH 2.0) keeping other things constant where the attempt was successed in separation all three impurities from sitaglitin peak but peak shapes are not good.
It was noted that % of perchloric acid in aqueous buffer as mobile phase modifier played a major role to get a good peak shape of sitagliptin by changing the strength of buffer from 0.1 % to 0.3% and finally fixed the strength of buffer as 0.3% to get a peak tailing around 1.1 to 1.5 by several experiments. And also worked on different columns such as Sunfire C18(150x 4.6 ,5µ), Zorbax SD C8(150 x 4.6,5µ)symmetry shield RP-18(150 x 4.6,3.5µ) by keeping the aqueous buffer(0.3% perchloric acid) as constant and also changing the organic modifier acetonitrile and methanol in different ratios. Diluent was selected by using of water and acetonitrile (80:20) to have good base line in the chromatogram.
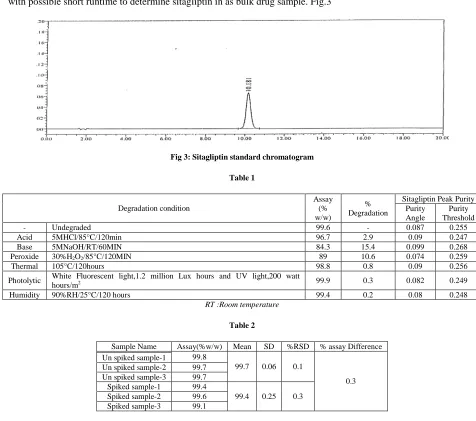
[image:4.595.64.540.295.716.2]Finally arrived to good chromatographic conditions such 0.3% perchloric acid as buffer with methanol as organic modifier in the ration of 70:30 with suitable column symmetry shield C18 column,150mm,4.6mm,3.5µ to get all three impurities are well separated from sitaglitin peak with good peak shape with flow as 1.0 ml per min at 266 nm with possible short runtime to determine sitagliptin in as bulk drug sample. Fig.3
Fig 3: Sitagliptin standard chromatogram
Table 1
Degradation condition
Assay (% w/w)
% Degradation
Sitagliptin Peak Purity Purity
Angle
Purity Threshold
- Undegraded 99.6 - 0.087 0.255
Acid 5MHCl/85°C/120min 96.7 2.9 0.09 0.247
Base 5MNaOH/RT/60MIN 84.3 15.4 0.099 0.268
Peroxide 30%H2O2/85°C/120MIN 89 10.6 0.074 0.259
Thermal 105°C/120hours 98.8 0.8 0.09 0.256
Photolytic White Fluorescent light,1.2 million Lux hours and UV light,200 watt
hours/m2 99.9 0.3 0.082 0.249
Humidity 90%RH/25°C/120 hours 99.4 0.2 0.08 0.248
[image:4.595.100.515.312.443.2]RT :Room temperature
Table 2
Sample Name Assay(%w/w) Mean SD %RSD % assay Difference
99.8
99.7 0.06 0.1
0.3 Un spiked sample-1
Un spiked sample-2 99.7
Un spiked sample-3 99.7
Spiked sample-1 99.4
99.4 0.25 0.3
Spiked sample-2 99.6
Spiked sample-3 99.1
Results of forced degradation studies:
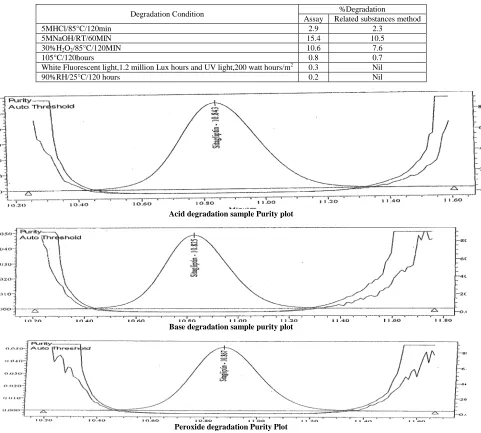
.The peak purity data of sitagliptin peak(Fig 4) evaluated from chromatograms of these degradation sample showed that the sitagliptin peak is homogeneous and there are no co-eluting peaks (Table 1,2).
[image:5.595.75.556.167.600.2]The percentage degradation results for sitagliptin phosphate as obtained from the analysis of samples stressed with conditions using assay and related substances test procedures are similar (Table 3). This indicates the absence of any interference in the assay of sitagliptin phosphate from the known/unknown impurities which might arise due to degradation of the drug substances.
Table 3
Degradation Condition %Degradation
Assay Related substances method
5MHCl/85°C/120min 2.9 2.3
5MNaOH/RT/60MIN 15.4 10.5
30%H2O2/85°C/120MIN 10.6 7.6
105°C/120hours 0.8 0.7
White Fluorescent light,1.2 million Lux hours and UV light,200 watt hours/m2 0.3 Nil
90%RH/25°C/120 hours 0.2 Nil
Acid degradation sample Purity plot
Base degradation sample purity plot
Peroxide degradation Purity Plot
Fig 4: Purity plot chromatograms of Acid, Base and Peroxide degradation of Sitagliptin
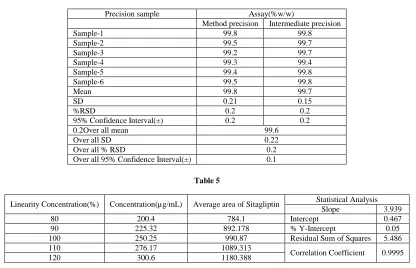
Precision :
The %RSD of assay of Sitagliptin during the assay method precision study was within 0.12% .The %RSD of the assay results obtained in the intermediate precision study was within 1.5 % conforming good precision of the method (Table 4).
Limit of detection(LOD) and Limit of Quantification (LOQ)
The limit of detection and limit of quantification of sitagliptin were achieved as 0.005% (w/w) and 0.015% (w/w) for 10µL injection volume respectively.
Linearity
respectively, The results shows that an excellent correlation existed between peak area and concentration of the analysis (Table 5).
Table 4
Precision sample Assay(%w/w)
Method precision Intermediate precision
Sample-1 99.8 99.8
Sample-2 99.5 99.7
Sample-3 99.2 99.7
Sample-4 99.3 99.4
Sample-5 99.4 99.8
Sample-6 99.5 99.8
Mean 99.8 99.7
SD 0.21 0.15
%RSD 0.2 0.2
95% Confidence Interval(±) 0.2 0.2
0.2Over all mean 99.6
Over all SD 0.22
Over all % RSD 0.2
Over all 95% Confidence Interval(±) 0.1
Table 5
Linearity Concentration(%) Concentration(µg/mL) Average area of Sitagliptin Statistical Analysis
Slope 3.939
80 200.4 784.1 Intercept 0.467
90 225.32 892.178 % Y-Intercept 0.05
100 250.25 990.87 Residual Sum of Squares 5.486
110 276.17 1089.313
Correlation Coefficient 0.9995
120 300.6 1180.388
Robustness
[image:6.595.99.515.107.375.2]In all the deliberate varied chromatographic conditions (flow rate, composition of organic solvent & column temperature) USP plate count ,USP tailing % RSD of standard and Rt of Sitagliptin were well with in the system suitability criteria ,this illustrating the robustness of the method (Table 6).
Table 6
Conditions Variation Parameter Retention Time(min)
USP Plate Count USP Tailing % RSD
Original method - 8561 1.1 0.7 10.548
Flow -10% 8572 1.1 0.05 11.444
10% 7970 1 0.04 9.447
% of Organic in mobile phase -2 % absolute 8400 1 0.08 12.801
+2% absolute 7994 1 0.04 8.693
Wavelength -3nm 8557 1.1 0.5 10.548
+3nm 8537 1.1 0.63 10.548
Column Oven temperature (-)5°C 9167 1.1 0.4 10.679
(+)5°C 10046 1.1 0.43 8.683
Solution stability and mobile phase stability:
The %RSD of peak area of Sitagliptin during solution stability and mobile phase stability experiments were within 0.5%. The solution stability and mobile phase stability experiment data confirms that the sample solution and mobile phases used during the assay were stable for 24 hours.
CONCLUSION
The HPLC method developed for quantitative determination of Sitagliptin is linear, accurate, precise, rapid and specific. The method was fully validated showing satisfactory data for all method validation parameters tested. The developed method is stability indicating and can be conveniently used by quality control department to determine the assay in regular Sitagliptin production samples and also stability samples.
Acknowledgment
REFERENCES
[1] www.ncbi.nlm.gov/pmc/article/pmc1994027.
[2] Herman G; Bergman A; Liu F; Stevens C; Wang A; Zeng W et al, J. Clin Pharmacol. , 2006, 46 (8), 876–886. [3] D.Kim; Wang L and Beconi M, J.Med.Chem., 2005, 48,141-151.
[4] Herman G.A; Stein P.P; Thornberry N.A; and Wagner J.A, Clin Pharmacol Ther., 2007, 81, 761-767. [5] Green B.D; Flatt P.R and Bailey C.J, Diab Vasc Dis Res.,2006 B, 3, 159-165.
[6] Baptist Gallwitz, Vasc Health Risk Manag; 2007 , 3(2).
[7] ICH,Q1A Stability testing of new drug substances and products in: proceeding of International Conference on harmonization Ceneva,October, 1993.
[8] Parag P; Imran M, Bairagi V; Ahire Y, J Pharm Res., 2011, 4(3), 871-873. [9] Ramzia El-Bagary; Ehab EF; Bassam AM,. Int J Biomed Sci., 2011, 7(1), 62-69
[10] Khan; Agrawal Y P; Sabarwal N; Jain A; Gupta A K, Asian J Biochem Pharma Res 2011, 1(2), 352-358. [11] Ravi PP; Sastry BS; Rajendra PY; Appala RN, Res J Pharm Tech., 2011, 4(4), 646-649.
[12] Shyamala M; Mohideen S; Satyanarayana T; Narasimha R,Suresh K; Swetha K, American J Pharm Tech Res., 2011, 1(2), 93-101.
[13] Zeng W; Xu Y; Constanzer M; Woolf EJ, J Chromatogr B., 2010, 878(21), 1817-1823.
[14] Zeng W; Musson DG; Fisher AL; Chen L; Schwartz MS; Woolf EJ et al, J Pharm Biomed Anal., 2008, 46(3), 534-542.
[15] Nirogi R; Kandikere V; Mudigonda K; Komarneni P; Aleti R; Boggavarapu R, Biomed Chromatogr., 2008, 22(2), 214–222.
[16] Ucakturk; Ebru, Journal of Pharmaceutical and Biomedical Analysis., 2013, 74, 71-76.
[17] Mahesh Kumar Mone;Payal Jain; santhosh Kurhade;Dnyaneshwar P;Sonune and Rahul D.Kaduskar, IJSPER., 2014, 5(6), 2382-2386.
[18] Dnyaneshwar P; Sonune and Mahesh Kumar Mone, IJSPER., 2013, 4(9), 3494-3503.
[19] Ola Ahmed Saleh; Aida Abd El-Azzouny; Hassan Youssef Aboul-Enein and Amr Mohamed Badawey,
European journal of chemistry., 2014, 5 (3) , 497-502.
[20] ICH Harmonised Tripartite Guideline. Text on Validation of Analytical Procedures, International Conference on Harmonization, Geneva, 1994, 1-5.
[21] ICH, Validation of Analytical Procedure: Text and Methodology (Q2 R1), International Conference on Harmonization,IFPMA, Geneva, 2005.
[22] ICH guidance on Analytical method validation , International convention on quality for Pharmaceutical Industry,Toronto, Canada,September, 2002.