Journal of Chemical and Pharmaceutical Research, 2015, 7(10):237-245
Research Article
CODEN(USA) : JCPRC5
ISSN : 0975-7384
A new physiology image encryption algorithm based on two-dimensional
coupled chaotic Map
Li Tu, Yang Liu and Chi Zhang
School of Information Science and Engineering, Hunan City University, Yiyang, Hunan
_____________________________________________________________________________________________
ABSTRACT
In this paper, a kind of two-dimensional coupled chaotic transcendental map (TCCTM) was proposed. Firstly, by using the TCCTM chaotic sequences were generated, then the chaotic sequences were modified to generate chaotic key stream that is more suitable for image encryption. In the process of encryption, an original color image was decomposed into three images of red, green and blue components, and encrypted them in a different way respectively. The experimental results demonstrate that the extremely sensitive to the key, the encrypted image has random-like distribution behavior of grey values, the adjacent pixels have zero co-correlation properties. Furthermore, the algorithm shows the advantages of large key space and high speed of encryption.
Keywords: Two-dimensional coupled chaotic transcendental equation; position scrambling; sensitivity; Image
encryption
_____________________________________________________________________________________________
INTRODUCTION
Due to the characteristics of easy-understanding and attractive presentation, multimedia contents such as image and audio, have been widely transmitted in Internet and mobile communications. people can obtain, use or process digital images more frequently. Since digital media such as image, audio, and video are easy to process, copy and transfer, the emergence of powerful tools raises a series of problems. It has become essential to secure information from leakages. Many peoplehas done research of this area and obtained many achievements [1].Some classic encryption techniques such asoptical transforms and chaotic maps have become a vital role in protecting images due to the increasing requirement for image storage and transmission[2-7].
Chaos is a particularly interesting non-linear effect.Chaos theory has been established since 1970s by many different research areas, such as physics, mathematics, engineering, and biology, etc[8]. Because of the characters of non-periodicity, non-convergence, ergodicity,and high sensitivity to initial conditions, which is related to cryptosystem, chaos is used for cryptology. Several approaches are seen in the literature that applies to concepts from the chaotic systems.
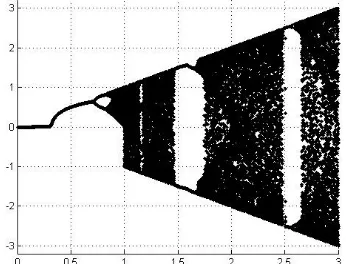
Figure 2.1. Bifurcation window for transcendental equation (a=0:3,x1 =0.1234)
Figure 2.1 shows that:when we choose different initial values of parameter a, the system shows different characteristics.And when parameter
a
≥
1
, the iterative results will fall in any sub-interval of the interval (-a,a) randomly, and it may be repeated. This is the ergodicity of chaos. With the increasing of parameter a, the map appears blank windows periodically.2.2 Improved two-dimensional transcendental equation
A one-dimensional equation can generate chaotic sequence through iterative calculation, but its key space is generally small, and its security is not high. For this problem, we proposed an improved two-dimensional coupled chaotic transcendental map, its mathematical expression is:
+
=
+
=
+ +
n n 2 n 1
n
n n 1 n 1
n
)
sin(
π
3
)
sin(
π
3
y
x
γ
y
b
y
y
x
γ
x
a
x
(2.2)
where
a
,
b
∈
(
0
,
1
),
r
1,
r
2∈
(
0
,
2
),
x
,
y
∈
(
−
12
,
12
)
.Took the initial values of
x
1=
0
.
12
,
y
1=
0
.
31
, the bifurcation of the improved transcendental equation is shown in Figure 2.2:(1) When parameter a∈
(
0.0,0.3)
, the chaotic mapping converges to a nonzero number, it is called a fixed point, and it is a stable single value;(2) When parameter
a
∈
(
0
.
3
,
0
.
6
)
, the function curve gets into two branches, it is a state of period 2;(3) When parameter
0
.
6
≤
a
≤
0
.
86
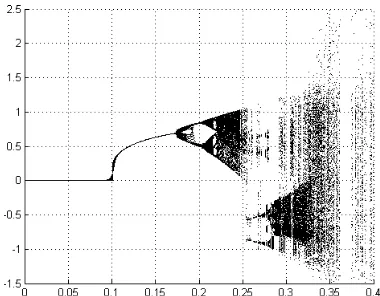
, the chaotic mapping appear chaotic state mainly, and it appears blank windows too;Figure 2.2. Bifurcation for the improved transcendental equation a=0.2, b=0.21, x1=0.12, y1=0.31, r1= r2∈(0,1.2)
Took the initial values of
x
1=
0
.
123
,
y
1=
0
.
1234
, a=b∈(0,0.4), r1=0.7, r2=0.51, the bifurcation of theimproved transcendental equation is shown in Figure 2.3:
Figure 2.3. Bifurcation for the improved transcendental equation a=b∈(0,0.4),
0
.
123
,
0
.
1234
1
1
=
y
=
x
, a=b∈(0,1.2), r1=0.7,r2=0.51
It can be seem from Figure 2.2 and Figure 2.3 that, if we take different initial values, we will get different bifurcation diagrams.
RESULTS AND DISCUSSION
3.1 Encryption Algorithm and Decryption Scheme
3.1.1 Encryption algorithm
The encryption steps are as follows:
(1)Read a size of 256*256 pixels colour image, calculated its red, green, and blue components, saved its value in three two-dimensional arrays respectively, then converted them to 3 length of 256*256 one-dimensional sequence. Through iterative calculation from the improved chaotic equation, it generated two one-dimensional arrays, they are named array B(Formed from x series ) and array I(Formed from y series),Their length are 256*256.In order to increase the difficulty of the ciphertext, took the first, the sixth and the fifth digit of the elements in array B after the decimal point to form a three-digit number, had it on 256 remainder operation, and we got sequence L1;
(2)First we encrypted the image of the red component, had its value on array L1 remainder operation, converted it to a 2-dimensional sequence;
[image:3.595.209.399.295.443.2](3)The decryption sceme of the green component image : Built a two-dimensional matrix E, put the elements of array I on the first row of the matrix P, put these numbers 1,2,3...256*256 on the second line, then sorted the elements in the array I, took the second line of sorted matrix E, we got a one-dimensional sequence Q. Built a two-dimensional matrix K, put the elements of array A2 on the first row of the matrix K, and put the elements of array Q on the second row of the matrix K, sorted the elements in the sequence Q, took the first line of sorted matrix K, converted it to a 2-dimensional matrix G, matrix G is the decrypted image of the green component;
(4)The decryption sceme of the blue component image : first we made a gray decryption(the method is the same as the decryption algorithm of red component), then we made a position decryption(the method is the same as the decryption algorithm of green component);
(5)Put these three decrypted component in a 3-dimensional matrix, composed the three components of image to a color images.
3.2. Experimental results
In this paper we used the double encryption approach to encrypt images, and the initial value and the control parameters were:
r
1=
0
.
1
,
r
2=
0
.
2
,
a
=
1
.
01
,
b
=
0
.
9
,
x
1=
0
.
22
,
y
1=
0
.
23
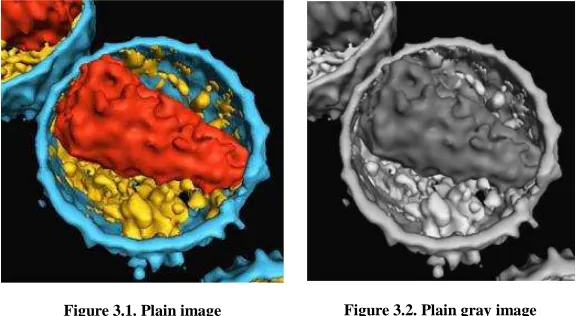
. We have used the internal structure of an HIV particle which is referred in Wellcome Image Awards 2008(photographer:StephenFuller).Britain's Wellcome Trust is the largest medical-research charity in the world,it studies the health of human
[image:4.595.162.451.472.630.2]and animal.The awards recognise the creators of the most informative, striking and technically excellent images among recent acquisitions to the Wellcome Images collection of medical and historical imagery. Figure 3.1 and Figure 3.2 are the color plain image and the gray plain image.
Figure 3.1. Plain image Figure 3.2. Plain gray image
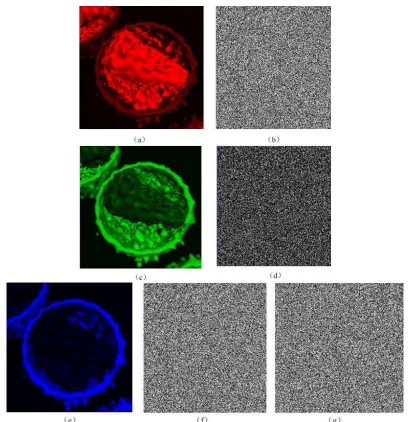
Figure 3.3. Cipher images: (a) Image of the red component (b) Encryped image of the red component(c) Image of the green component (d) Encryped image of the green component(e) Image of the blue component (f) The first encryped image of the blue component (g)The
second encryped image of the blue component
Figure 3.4. Decrypted images:(h)The decrypted image of the red component (i) The decrypted image of the green component (j) The decrypted image of the blue component (k) The composited image
3.3. Performance and security analysis
All the security analysis has been done on MATLAB 7.0 by Intel Pentium 64 X2 Dual Core processor 2.0GHz personal computer.
3.3.1 Histogram analysis
[image:6.595.113.502.325.703.2]Gray histogram is a function of gray scale, it describes the number of gray levels of pixels in an image, and it reflects the frequency of gray value in an image. Its abscissa is gray level, its ordinate is the frequency of the gray level. Figure 3.5 is the histogram of the three components.
Figure 3.5 The histogram of the three components: (a1) Histogram of the image of red component(b1) Histogram of the encrypted image of red component (c1) Histogram of the image of green component (d1) Histogram of the encrypted image of green component (e1)
Histogram of the image of blue component (f1,g1) Histogram of the encrypted image of blue component
and after encryption the histogram of the image of red component and green component are complanate, the gray value of encrypted image is in uniform distribution. This shows that in the range of (0,255),the probability of the pixel value in encrypted image is equal. The statistical characteristics of encrypted image are quite different from that of the plain image. The statistical characteristics of plain images spread to encrypted images evenly, this reduces their correlation greatly. while it only made a position encryption on the image of green component, its histogram does not change.
3.3.2 Correlation analysis of two adjacent pixels
The substantive characteristics of a digital image determine that there is strong correlation among adjacent pixels. This correlation makes the content of the image is easy to be identified [10]. We calculated the pixel correlation using the following formula (3.1) and formula (3.2)[11]:
)))
(
))(
(
((
)
,
cov(
x
y
=
E
x
−
E
x
y
−
E
y
(3.1)) ( ) ( ) , cov( y D x D y x Rxy ⋅
= (3.2)
Here x and y are the gray values of two adjacent pixels in the image, E(x) is a mathematical expectation, D(x) is the variance of x, cov(x,y) is the population covariance. In order to destroy the statistical attacking, we must reduce the correlation of adjacent pixels. The lower the correlation coefficient, the better the encryption effect. In the process of calculation, we use formula (3.3-3.5).
∑
= = N i i x N x E 1 1 )( (3.3)
∑
= −
= N
i
i E x
x N x D 1 2 )) ( ( 1 )
( (3.4)
)) ( ) ( ( )) ( ( 1 ) , cov( 1 y E i y x E x N y x N i
i− ⋅ −
=
∑
=
(3.5)
The following steps are performed to evaluate an image’s correlation property: (1) 2000 pixels are randomly selected as samples;
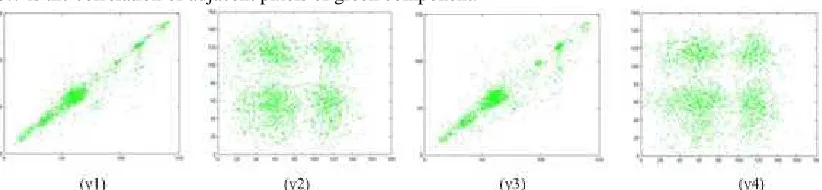
[image:7.595.94.513.476.570.2](2) the correlations between two adjacent pixels in horizontal, vertical or diagonal directions are calculated by the formula above. Their distribution is shown in Figure 3.6 ,Figure 3.7 and Figure 3.8.Figure 3.6 is the correlation of adjacent pixels of red component.
Figure 3.6 Correlation of adjacent pixels of red component: (x1) Correlation of level adjacent pixels of the image of red component, (x2) Correlation of level adjacent pixels of the encryped image of red component, (x3) Correlation of diagonal adjacent pixels of the image of red component ,(x4) Correlation of horizontal adjacent pixels of the encryped image of red
component
[image:7.595.102.513.631.726.2]Figure 3.8 Correlation of adjacent pixels of blue component: (z1) Correlation of level adjacent pixels of the image of blue component (z2) Correlation of level adjacent pixels of the encryped image of blue component (z3) Correlation of horizontal adjacent pixels of the image of blue component (z4) Correlation of horizontal adjacent pixels of the encryped image of blue
component
The more obvious the scrambling degree of images were, the better the effect of the encryption is. The correlation among the plain image pixels shows a linear distribution, the correlation among the encrypted image pixels is a random distribution. It can be seen from the Figures above that the degree of image scrambling is very significant.
3.3.3 MSE
MSE(Mean Square Error) is used to measure the performance of encryption, the bigger the value of mean square error, the better the effect of encryption. The formula of MSE is :
( ) ( )
[
]
21 1
,
,
*
1
∑∑
= =−
=
M i N ij
i
P
j
i
D
N
M
MSE
(3.6)where parameter M,N are the gray level of images, parameter D is the grayscale of the encrypted image ,and parameter P is the grayscale of the plain image. Table 1 is the MSE value of the encryped image of the red ,green and blue components and their plain images:
Table 1. MSE value
Image MSE the encryped image and the plain image (red component) 12113 the encryped image and the plain image (green component) 2167.6 the encryped image and the plain image(blue component) 17068 the decrypted image and the plain image (red component) 0 the decrypted image and the plain image (green component) 0 the decrypted image and the plain image(blue component) 0
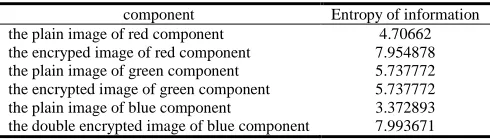
3.3.4 Information entropy analysis
Information entropy is one of the criteria to measure the strength of a cryptosystem,which was firstly proposed by Shannon in 1949[12].Information entropy of image describes the distribution of grey value [13] ,its formula is:
( )
( )
log
2[
(
)]
1 2
1
i i
i
P
S
S
P
s
H
n∑
− =−
=
(3.7)where P(Si) is the probability of symbol Si, 2n is the total number of state of information source S. The information
entropy is used to analyze the performance of encryption method. When the image pixel is uniformly distributed, the probabilities of grey value are basically equal, entropy can achieve the maximum, it shows that, the more dispersed the grey value, the better the performance of encryption. A 256 level of gray image has 28 kinds of possible pixel values,so its ideal information entropy should be 8. If the information entropy of a 256 level gray encrypted image is close to 8, the cipher image closes to the random distribution.The information entropy obtained from simulation experiment is shown in table 2.
does not change its information entropy.
Table 2. Entropy of information
component Entropy of information the plain image of red component 4.70662 the encryped image of red component 7.954878 the plain image of green component 5.737772 the encrypted image of green component 5.737772 the plain image of blue component 3.372893 the double encrypted image of blue component 7.993671
3.4.5 Key space analysis
Key space is the total number of different keys that can be used in the encryption[14,15].There are six parameters in the improved chaotic equation,in theory,the key space of each parameter is 1014, due to the actual precision of computer, the key space of each parameter was 106 , so the key space of the two-dimensional coupled chaotic map is 1.0*1036.It has obvious superiority,and it is easier to implement the algorithm by using hardware. Simulation results show that , even under the condition of existing computer precision,the key space is large enough.And 1035=2117,it means that, an attacker needs a 117-bit computer to decode the algorithm.
1036=2117/365/24/60/60/2.6G=1.2192*1018,If he use the violence attack methods, it means,if an attacker decode the algorithm by using a 2.6GHZ frequency of computer,he needs 1.2192*1018 years.
CONCLUSION
In this work a kind of two-dimensional coupled chaotic map based on Feigenbaum transcendental equation is proposed, the behavior of this method is similar to the substitution box like encryption algorithms.The results show that the encryption algorithm is easy to realize, the pixels of encrypted image has characteristics of statistical distribution,and the algorithm is sensitive enough to the keys, The key space is large enough, the correlation of adjacent pixels of encrypted images is close to 0,the algorithm is more secure and hence more suitable for image encryption for applications. As future work,the diffusion efficiency of this algorithm needs to be improved.
Acknowledgements
This work was supported by Scientific Research Fund of Hunan Provincial Education Science Planning Department under Grant (No: XJK014CGD011).
REFERENCES
[1] Elwakil A S, Kennedy M P. IEEE Trans Circuits Syst Ⅰ Fundam Theor Appl, 2001, 48: 289-307.
[2] Chong Fu, Junjie Chen, Hao Zou, Wei-hong Meng, Yong- feng Zhan, and Ya-wen Yu,Optics Express,2012,
20(3):2363- 2378.
[3] Zhang Liuhua, Liao Xiaofeng,Wang Xuebing. Chaos, Solitons &Fractals, 2005, 24(3): 759- 765.
[4] Zhang Huaguang, Ma Tiedong, Huang Guangbin, Wang Cunxu. IEEE Trans Syst Man Cybern B Cybern,2010, 40(3): 831-844.
[5] Xin Ma, Chong Fu, Weimin Lei, Shuo Li. International Journal of Advancements in Computing Technology,
2011,3(5):223-233.
[6] Wang Xingyuan,Liu Lintao. Nonlinear Dynamics,2013,73(1-2):795-800. [7] May R M, Nature, 1976, 261: 459 ~ 467.
[8] Feigenbaum M J. J Stat Phys, 1978, 19 (1): 25~ 52.
[9] Wu Yue, Joseph P.Noonan. International Journal of Innovation, Management and Technology 2012, 3(3): 285-289.
[10] q Fridrich J. International Journal of Bifurcation and Chaos, 1998, 8(6):1259-1284.
[11] Wu, Yue, Yang Gelan, Jin Huixia, Noonan Joseph P. Journal of Electronic Imaging, 2012, 21(1):013014-1. [12] Wei Zhang, Kwok-wo Wong, Hai Yu, Zhi-liang Zhu. Commun Nonlinear Sci Numer Simulat .2013, 18:2066-2080.