Journal of Chemical and Pharmaceutical Research, 2015, 7(9): 659-665
Research Article
CODEN(USA) : JCPRC5
ISSN : 0975-7384
Removal of congo red dye from effluent sample using casurina
leaves as a adsorbent
E. Kowsalya*, S. Sharmila and Jeyanthi Rebbecca
Department of Industrial Biotechnology, Bharath University, Chennai, Tamil Nadu, India
______________________________________________________________________________
ABSTRACT
Dyes are present in various Industrial effluents like Textile Industries, Sewage water, Water treatment plants. The use of low cost adsorbent has been investigated as a replacement for the current expensive method of removing dye from waste water. The objective of this work is the study of adsorption of dye solution which is a phenol red using low cost adsorbent Casuarina fresh leaf .Removal of phenol red dye from aqueous solution using this adsorbent has been investigated. Liquid phase adsorption experiments were conducted. Batch adsorption studies are carried out by observing the effect of experimental parameters namely adsorbent dose, initial dye concentration, time agitation and effect of pH. In present study it was observed that adsorption of initial dye concentration 700mg/L solution showed ,17% adsorption . The maximum adsorption observed was 40% with 1gm adsorbent dose for the same concentration 700mg/L of dye solution at same condition. The effect of time of 100 min contact time for same condition of 700mg/L & 3gm adsorbent dose showed not much difference as adsorbent gives 20% . Since this initial dye concentration of phenol red is acidic dye pH variation of 7, 7.5, 8.5 showed negative value.
Keywords: Adsorption, pH, dye, Casuarina
_____________________________________________________________________________________________
INTRODUCTION
bitten by poisonous snakes (Pushpangadan et al. 1989). The stems have been used for biogas generation (Elorteguri
et al., 1987; Sharma et al., 1987 ), ethanol production (Tewari et al., 1987) and paper making (Geopaul1980) etc.
Mter cutting off the bunch most of the residues are either used as manure, simply thrown away or burnt off to reduce the volume. The approximate amount of dry matter produced per banana plant is about 1, 1.3 and 5 g of leaf, pseudostem and fruit respectively (Hegde and Srinivas 1991). In order to make the dyeing wastewater treatment economical, it is imperative to go for low cost adsorbents. The aim of this paper is to assess the ability of waste banana pith to adsorb Congo red from aqueous Use of various dyes in order to color the products is a common practice in composite knit industry. The presence of these dyes in water even at low concentration is highly visible and undesirable. The Various study was carried out for the utilization waste material as a useful adsorbent .The Use of orange peel as adsorbent for the removal of dyes from wastewater and to establish it as a standard wastewater treatment process for composite knit industry was carried out (FahimBin AbdurRahman et al., 2013) In this present work, searching of new waste material for treating congo Red dye effluent was carried out and casurina leaves were found to be new adsorbent and its efficacy were studied.
EXPERIMENTAL SECTION
Preparation of adsorbent:
Initially casuarinas leaves were collected from fresh casuarinas tree and leaves were washed with tap water again washed with distilled water for 3-4 times to remove other contaminants. Leaves were then dried in sunlight for 5 days leaves were crushed and passed through 40 mesh size sieve to get uniform particle size distribution of raw casuarinas leaves adsorbent. The prepared adsorbent was stored in bottles for further use.
Figure:1 Fresh leaves powder
Preparation of Adsorbate:
A stock solution of phenol red was prepared by dissolving 0.7g of phenol red dye in 1L of distilled water by constant stirring a magnetic stirrer at 400 rpm and 80c for 1 hour for complete mixing. The solution is then cooled and filtered to get the clear stock solution and this is stored for further use.
Batch adsorption studies:
Effect of initial dye concentration:
For this aliquots of stock phenol red solution (300 mg/L – 700mg/L) were taken in 5 conical flasks and 3g of adsorbent was added to each flask. These were kept in the shaker for 100 minutes. After agitation the solutions were centrifuged at 7000 rpm for 15 minutes to remove colloidal materials. Then the absorbance of the supernatant solution was found to estimate the final dye concentration. The amount of phenol red adsorbed per unit weight of adsorbent was calculated as
Q= ((C0-Cf)*V)/W) mg/g ---(2)
Where,
C0= Initial concentration of dye (mg/L) Cf = Final concentration of dye (mg/L)
Effect of adsorbent:
For this 700 mg/L of stock phenol red solution w taken in 5 conical flasks and 1, 1.5, 2, 2.5, 3g of adsorbent was added to each flask. These were kept in the shaker for 100 minutes. After agitation the solutions were centrifuged at 7000 rpm for 15 minutes to remove colloidal materials. Then the absorbance of the supernatant solution was found to estimate the final dye concentration
Effect of time of agitation:
For this 700 mg/L of stock phenol red solution were taken in 5 conical flasks and 3g of adsorbent was added to each flask. These were kept in the shaker for different time intervals of 20, 40, 60, 80 and 100 minutes. After agitation the solutions were centrifuged at 7000 rpm for 15 minutes to remove colloidal materials. Then the absorbance of the supernatant solution was found to estimate the final dye concentration.
Effect of pH:
For this 700mg/L of stock phenol red solution were taken in 12 conical flasks, 6 for fresh leaves and 6 for dried leaves adsorbents. The pH of 3 flasks was adjusted to acidic range (3.5-5.5) by adding 1N Hcl and 3g of adsorbent was added to each flask. Similarly, the pH of another set of 3 flasks was adjusted to alkaline range (7.5-9.5) by adding 1N NaOH and 3g of adsorbent was added to each flask. These were kept in the shaker for fixed time intervals of 100 minutes. After agitation the solutions were centrifuged at 7000 rpm for 15 minutes to remove colloidal materials. Then the adsorbance of the supernatant solution was found to estimate the final dye concentration.
RESULT AND DISCUSSION
EFFECT OF INITIAL DYE CONCENTRATION:
Table1: Effect of initial dye concentration on adsorption with at a constant adsorbent dose 3 g
S.NO Initial Concentration (mg/L)
%Dye Reductionby Fresh Leaves
1 700 17
2 600 16
3 500 12
4 400 10
.
FIGURE 2: Effect of initial dye concentration on adsorption with at a constant adsorbent dose 3 g
By the concentration change at constant time intervals the difference in dye removal percentage was noted and it was plotted as graph. In which the 300mg/L showed 6% adsorption, 400mg/L showed 10% adsorption gradually increased and finally 700mg/L showed 17% adsorption.
[image:4.595.101.492.414.675.2]EFFECT OF ADSORBENT DOSE:
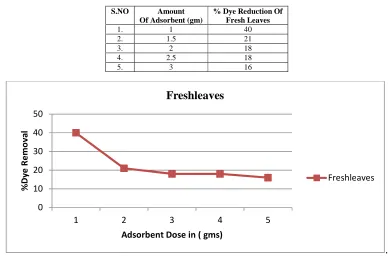
Table. 2: Effect of Adsorbent Dose on Initial Dye Concentration of 700 mg/L on Adsorption
S.NO Amount Of Adsorbent (gm)
% Dye Reduction Of Fresh Leaves
1. 1 40
2. 1.5 21
3. 2 18
4. 2.5 18
5. 3 16
0% 2% 4% 6% 8% 10% 12% 14% 16% 18%
700mg/L 600mg/L 500mg/L 400mg/L 300mg/L
% D Y E R E M O V A L
EFFECT OF TIME:
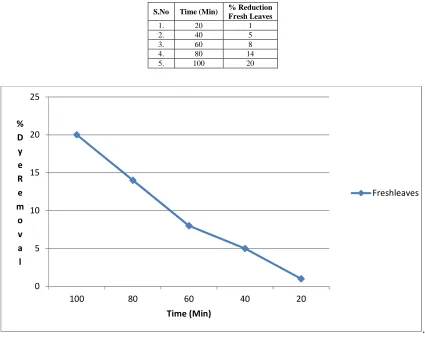
TABLE 3: Effect of Time on Initial Dye Concentration of 700 mg/L on Adsorption with at a constant adsorbent dose of 3 g
S.No Time (Min) % Reduction Fresh Leaves
1. 20 1
2. 40 5
3. 60 8
4. 80 14
5. 100 20
.
FIGURE 4: Effect of Time on Initial Dye Concentration of 700 mg/L on Adsorption with at a constant adsorbent dose of 3 g
Keeping the concentration both Adsorbent and Adsorbate ,how the time intervals were changed and the graph was plotted. The adsorption efficiency gradually increased fresh leaf from 1% to 20%.
[image:5.595.235.363.578.657.2]EFFECT OF PH :
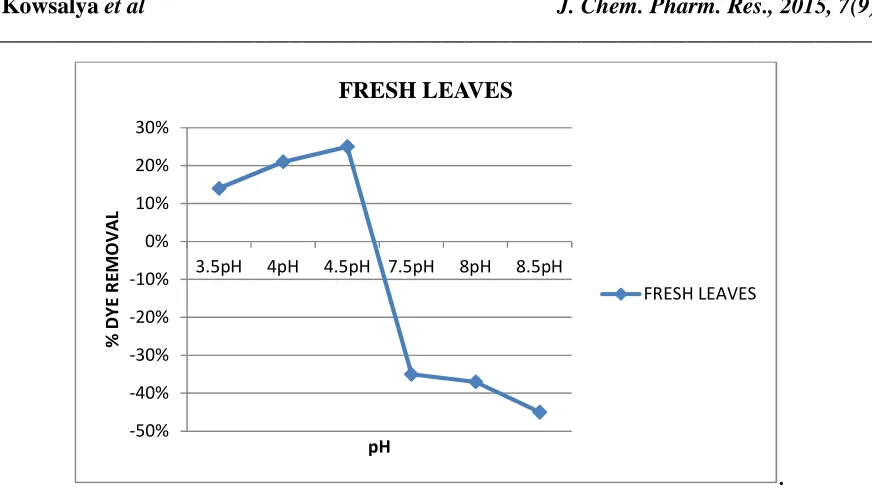
Table 4: Effect of pH on initial dye concentration of 700mg/L on adsorption with at a constant adsorbent dose3g
S.NO PH % Dye Reduction Fresh Leaves 1. 3.9 14 2. 4.00 21 3. 4.10 25 4. 7.5 -35 5. 8.00 -37 6. 8.5 -45 0
5 10 15 20 25
100 80 60 40 20
% D y e R e m
o v a l
Time (Min)
.
Figure 5: Effect of pH on initial dye concentration of 700mg/L on adsorption with at a constant adsorbent dose 3g
The efficiency of adsorption is dependent on the pH of solution since variation in pH leads to the variation in the surface properties of the adsorbent and the degree of ionization. The pH variation over the pH range of 3.5 to 8.5 for both fresh and dried leaves adsorbents. It is observed that the percentage removal decreases with increase in pH for both adsorbents. The maximum dye removal was 25% for fresh leaves. Hence it can be conclude that the acidic range of dye is favourable with both adsorbents.
CONCLUSION
Adsorption is operative in most natural physical, biological, and chemical systems, and is widely used in industrial applications such as treatment of effluents, purification of water etc., In this study, low cost and easily available sources were chosen as adsorbent and it’s efficiency were analyzed. The casuarinas fresh leaves powder was used as adsorbent for the phenol red dye. It is been decided to convert it into activated charcoal in future to improve the dye adsorption and test the adsorption or dye reduction of various other dyes.
REFERENCES
[1] Badrinath.S.D, V.Raman and V.Arumugam. 1983. IA VPC Tech. Annual 10: 55-73 [2] Venkata rao.B. and C.A. Sastry. 1987. Ind. J Env. Protect. 7: 363-376.
[3] Mckay, G., M.S. Otterburi'': and A.G. Sweeny. 1980. Water Res. 14: 21-27.
[4] Namasivayam, C. and R.T. Yamuna. 1992a. J Chern. Tech. Bio Tech. 53: (In press). [5] Namasivayam, C. and R.T. Yamuna. 1992b. Water, Air and Soil Pollution 61. (In press) [6] Gupta, G.S., G. Prasad and V.N. Singh. 1989. j. Ind. Assoc. Environ. Manage1nent. 16: 174. [7] Nawar, S.S. and H.S. Doma. 1989. Sci. Total Envt. 79: 271.
[8] KS. and C.K lee. 1990. Pe1tanika 13: 221-228. -50%
-40% -30% -20% -10% 0% 10% 20% 30%
3.5pH 4pH 4.5pH 7.5pH 8pH 8.5pH
%
D
Y
E
R
E
M
O
V
A
L
pH