International Journal of Emerging Technology and Advanced Engineering
Website: www.ijetae.com (ISSN 2250-2459, Volume 2, Issue 2, February 2012)217
Real Time Implementation of QRS Complex Extraction
Using Discrete Wavelets
P.Manimegalai
1, R.Dhanapal
2, Dr.K.Thanushkodi
3 1Assistant Professor, Department of Electronics and Instrumentation,
Karunya University, Coimbatore-641114, INDIA.
2
PG Scholar, Department of Electronics and Instrumentation,
Karunya University, Coimbatore-641114, INDIA.
3Director, Akshaya College of Engg. &Tech. Coimbatore, INDIA.
Abstract: - Electrocardiogram (ECG or EKG) is basically a diagnostic tool that measures and records the electrical signal by comparing the activity of heart. R wave (QRS complex) in electrocardiogram has significance importance since it reveals important information about the various disorders. The analysis of the ECG has been widely used for diagnosing many cardiac diseases. ECG signals commonly change their statistical property over time and are highly non stationary signals. For the analysis of ECG signals wavelet transform is a powerful tool. Several algorithms have been developed for detection and classification of QRS complex. I n t his paper a real time automated R wave analysis of diagnostic electrocardiogram (ECG) based on the discrete wavelet transform is evaluated and developed. Beat detection and QRS complex feature extraction are necessary to determine the heart rate, and several related abnormalities such as Tachycardia, Bradycardia, b u n d l e b l o c k a n d v e n t r i c u l a r f i b r i l l a t i o n . Using the proposed algorithm, heart rate calculation, R peak detection and QRS feature extraction are done by using discrete wavelet transform (DWT) in MATLAB and Lab VIEW.
Keywords— R-wave, Discrete wavelets, Cardiological analysis, ECG, MATLAB, LabVIEW
I.
I
NTRODUCTIONThe state o f cardiac heart is generally reflected in the shape of ECG waveform and heart rate. It may contain important pointers to the nature of diseases afflicting the heart. Ho wever, bio-signals being no n-statio nary signals, the reflection may occur at rando m in the time-scale (that is, the disease sympto ms may not sho w up all the time, but wo uld manifest at certain irregular intervals d uring the day). Fro m the practical point of view, for the effective diagnostics, the stud y o f QRS pattern and heart rate variability signal may have to be carried out over several ho urs.
The volume o f the data being enormo us, the stud y is tedious and time consuming and the possibility of the analyst missing the vital information is high. Hence, co mp uter based analysis and classificatio n of diseases can be very help ful in diagnosis.
Several algorithms have been developed in the literature for detectio n and classification of ECG beats. The ECG waveforms may differ for the same patient to such extend that they are unlike to each other and at the same time alike for different types of beats.
International Journal of Emerging Technology and Advanced Engineering
Website: www.ijetae.com (ISSN 2250-2459, Volume 2, Issue 2, February 2012)This paper focuses on the initial work to develop ECG monitoring by MATLAB and based on the results, abnormalities is coarsely estimated. For real time application the algorithm was implemented in LabVIEW. LabVIEW (Laboratory Virtual Instrumentation Engineering Workbench) is a platform and development environment for a visual programming language from National Instruments [14]. LabVIEW helps create flexible and scalable design, control, and test applications.
II. E
LECTROCARDIOGRAMElectrocardiogram, also known as EKG (from the German language) is a method of recording the electrical activity of the heart. Each heartbeat is caused by a section of the heart generating an electrical signal, which then conducts through specialized pathways to all parts of the heart. These electrical signals also get transmitted through the chest to the skin where they can be recorded as a graph.
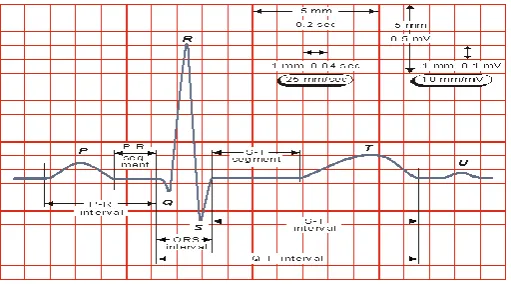
[image:2.595.334.540.262.352.2]The anatomical difference of the atria and the ventricles, their sequential activation, depolarization, and repolarization produce clearly differentiable deflections. The deflections in this signal are denoted in alphabetic order starting with the letter P, which represents atrial depolarization. The ventricular depolarization causes the QRS complex, and repolarization is responsible for the T-wave.
Fig .1 The electrocardiogram
III.
W
AVELETSWavelet is a powerful tool for the representation and analysis o f such physiologic waveforms because a wavelet has finite duratio n (co mpact support) in contrast with Fourier methods based on sinusoids o f infinite duration. Wavelet theory can be understood and developed only b y using such digital filters.
[image:2.595.49.305.499.641.2]This is the meeting point between wavelets and sub band coding and the origin of two different no menclatures for the same concepts. In fact, wavelet transform and sub band coding are so closely connected that both terms are o ften used interchangeably. Filter banks are structures that allow a signal to be decomposed into sub signals thro ugh digital filters, typically at lower sampling figure 2 shows a two-band filter bank.
Fig.2 One- level two band perfect reconstruction filter bank
The DWT analyses the signal at different resolution (hence, multiresolution) through the decomposition of the signal into several successive frequency bands. The DWT utilizes two set of functions ø(t) and Ψ(t), each associated with the low pass and the high pass filters respectively [9].These functions have a property that they can be obtained as the weighted sum of the scaled
(Dilated) and shifted version of the scaling function itself:
-n) ---1
-n) --- 2
Here, h[n] and g[n] are the half band low pass filter and high pass filter respectively.
IV.
P
ROPOSEDM
ETHODOLOGYDenoising and detection of the QRS complexes in an ECG signal provides information about various cardiac abnormalities. It supplies evidence for the diagnosis of cardiac diseases. For this very important reason, it has earned a great respect in medical community. Unfortunately, the presence of noise and time-varying morphology makes the detection difficult. Figure 4 shows the steps of the cardiac signal processing.
[image:2.595.321.567.690.737.2]International Journal of Emerging Technology and Advanced Engineering
Website: www.ijetae.com (ISSN 2250-2459, Volume 2, Issue 2, February 2012)219
4.1 Denoising and baseline removal
Preprocessing ECG signals helps us remove contaminants fro m the ECG signals. ECG contaminants can be classified into the following categories: Power line interference, Electrode pop or contact noise, Patient–electrode motion artifacts, Electro myograp hic (EMG) no ise, Baseline wandering.
Amo ng these noises, the power line i n t e r f e r e n c e and the baseline wandering are the most significant and can strongly affect ECG signal analysis. Except for these two noises, other noises may be wideband and usually a co mplex stochastic process which also distort the ECG signal. The power line interference is narrow-band no ise centered at 60 Hz (or 50 Hz) with a bandwidth of less than 1 Hz. Usually the ECG signal acq uisitio n hard ware can remove the power line interference. Ho wever the baseline wandering and other wideband noises are not easy to be suppressed b y hardware equip ments. Instead, the software scheme is more powerful and feasible for offline ECG signal processing. Digital filtering methods as well as wavelet based methods are used to remove baseline wandering and the other wideband no ise.
The baseline wandering and the above noises are removed by taking two approximation level coefficients such as A4 and A10 of Daubechies wavelet and subtraction of the two. Because of increasing the levels of decomposition the baseline wander gets corrected automatically.
4.2 R peak detection
Peaks o f the R waves in signals fro m the MLII lead have the largest amp litudes among other leads. In order to detect the peaks, specific details o f the signal were selected. Details 2^3 – 2^5 were kept and all the details were removed. This procedure r e mo v e s low frequencies and h i g h frequencies. The attained signal samples were then squared. High amplitude transitions o f the signal were then more noticeable, even if R peaks are deformed. Then a practically lo wer limit is applied on the signal to remove unrelated noisy peaks. Since n o subsequent beats will occur in less than 0.25 second, pseudo-beats are also removed. Detection of R peaks is very important because they define the cardiac beats. Heart rate is the important parameter that is detected for analyzing the abnormality in the heart. Heart rate is calculated based on R-R interval.
4.3 QRS complex extraction
The detection o f the QRS complex is the most important task in auto matic ECG signal analysis. Q and S points are detected after detecting the R peak by the slope inversion method.
For QRS complex extraction the d e n o i s e d ECG signal i s d e c o m p o s e d into 6 levels b y using DWT and the approximatio n (A4 and A6) coefficients are reconstructed separately. By subtracting A6 from the A4 QRS complex can be extracted.
V.
R
ESULTS5.1 Matlab Results
The simulation for the ECG signal processing was done in MATLAB b y obtaining both the normal as well as abnormal data using wavelet transform.
The simulation results from MATLAB are shown in Fig.5,6 &7
Fig.4Experimental setup
Fig.5 (a) ECG signal, (b) baseline correct signal, (c) denoised signal,
International Journal of Emerging Technology and Advanced Engineering
Website: www.ijetae.com (ISSN 2250-2459, Volume 2, Issue 2, February 2012)Fig. 6 QRS detected signal
Fig.7 Extracted QRS complex
5.2 LabVIEW Results
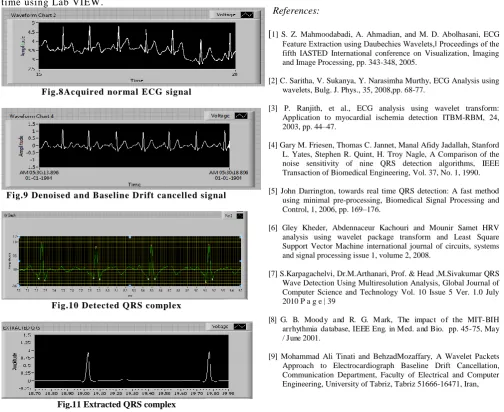
[image:4.595.47.552.350.762.2]ECG signals are acquired using DAQ and it is given to LabVIEW tool. The algorithm for R peak detectio n and QRS complex extraction is implemented in real time using Lab VIEW.
Fig.8Acquired normal ECG signal
Fig.9 Denoised and Baseline Drift cancelled signal
Fig.10 Detected QRS complex
Fig.11 Extracted QRS complex
V.
C
ONCLUSIONIn this paper, we have proposed an a l gor it hm for QRS complex feature extraction system based on the discrete wavelet transform. The Wavelet based signal processing allows taking advantage of characteristics of time-scale analysis. This wavelet approach proved to be an efficient method for the R peak detection and QRS extraction. The feature extraction using Daubechies wavelets is the basic for auto matic QRS abnormal detectio n. R peak detection a n d Q R S c o m p l e x d e t e c t i o n algorithm were implemented, to determine the heart rate, and several related abnormalities such as Tachycardia and Brad ycardia. To make the system more accurate and to implement in real time, signals are processed and work is done in Lab VIEW for better results.In future we will collect more data from patients with certain heart diseases and validate our algorithm.
References:
[1] S. Z. Mahmoodabadi, A. Ahmadian, and M. D. Abolhasani, ECG
Feature Extraction using Daubechies Wavelets,‖ Proceedings of the fifth IASTED International conference on Visualization, Imaging and Image Processing, pp. 343-348, 2005.
[2] C. Saritha, V. Sukanya, Y. Narasimha Murthy, ECG Analysis using wavelets, Bulg. J. Phys., 35, 2008,pp. 68-77.
[3] P. Ranjith, et al., ECG analysis using wavelet transform: Application to myocardial ischemia detection ITBM-RBM, 24, 2003, pp. 44–47.
[4] Gary M. Friesen, Thomas C. Jannet, Manal Afidy Jadallah, Stanford L. Yates, Stephen R. Quint, H. Troy Nagle, A Comparison of the noise sensitivity of nine QRS detection algorithms, IEEE Transaction of Biomedical Engineering, Vol. 37, No. 1, 1990.
[5] John Darrington, towards real time QRS detection: A fast method using minimal pre-processing, Biomedical Signal Processing and Control, 1, 2006, pp. 169–176.
[6] Gley Kheder, Abdennaceur Kachouri and Mounir Samet HRV analysis using wavelet package transform and Least Square Support Vector Machine international journal of circuits, systems and signal processing issue 1, volume 2, 2008.
[7] S.Karpagachelvi, Dr.M.Arthanari, Prof. & Head ,M.Sivakumar QRS Wave Detection Using Multiresolution Analysis, Global Journal of Computer Science and Technology Vol. 10 Issue 5 Ver. 1.0 July 2010 P a g e | 39
[8] G. B. Mood y and R. G. Mark, The impact of the MIT-BIH arrhythmia database, IEEE Eng. in Med. and Bio. pp. 45-75, May / June 2001.
International Journal of Emerging Technology and Advanced Engineering
Website: www.ijetae.com (ISSN 2250-2459, Volume 2, Issue 2, February 2012)221
[10] Gley Kheder, Abdennaceur Kachouri and Mounir Samet, HRV analysis using wavelet package transform and Least Square Support Vector Machine,International journal of circuits, systems and signal processing Issue 1, Volume 2, 2008.
[11] Zine-Eddine Hadj Slimane , Amine Nait-Ali , Digital Signal
Processing, QRS complex detection using Empirical Mode Decomposition.
[12] S.Sumathi1, Dr.M.Y. Sanavullah, V.M.K.V. Engineering College, Salem, Comparative Study of QRS Complex Detection in ECG Based on Discrete Wavelet Transform, International Journal of Recent Trends in Engineering, Vol 2, No. 5, November 2009,
[13] A. K. M. Fazlul Haque, Md. Hanif Ali, M. Adnan Kiberand Md.
Tanvir Hasan, Detection of small variations of ECG features using wavelet, Department of Computer Science and Engineering, Jahangirnagar University, Dhaka, Bangladesh, VOL. 4, NO. 6, AUGUST 2009 ISSN 1819-6608 ARPN Journal of Engineering and Applied Sciences.
[14]. National Instruments, Lab VIEW User Manual, National Instruments Corporation, 1996. And Advanced Signal Processing Toolkit (ASPT) and the Digital Filter Design Toolkit (DFDT)
[15].P.Manimegalai,AshimaaSahoo,Dr.K.Thanushkodi, Wavelet based cardiovascular parameters estimation system using ECG and PPG signals, European Journal Of scientific Research Vol65 issue4,December 2011.