Journal of Chemical and Pharmaceutical Research, 2017, 9(10):59-69
Research Article
CODEN(USA) : JCPRC5
ISSN : 0975-7384
59
Experimental Investigation of Surface Roughness of SKD11 Die Steel during
Die- Sinking EDM Process using Copper Electrode
Phan Nguyen Huu
*, Duc Nguyen Van and Bong Pham Van
Hanoi University of Industry, Cau Dien Street, Bac Tu Liem District, Hanoi, Vietnam _____________________________________________________________________________
ABSTRACT
Die-sinking electrical discharge machining (EDM) is widely used in the process of making die casting moulds, plastics moulding and forging dies. But low machining efficiency and poor surface quality of die- sinking EDM are the major drawbacks of this process that restricts its use in mechanical manufacturing. Therefore it is of great importance to improve the machining efficiency and surface quality of EDM. In this article, a surface roughness (SR) study on die- sinking EDM of SKD11 die steel has been carried out. Response surface methodology (RSM) has been used to plan and analyze the experiments. Current (I), pulse on time (Ton) and voltage (U) were chosen as process parameters to study the die- sinking EDM performance in term of SR. The results indicated that in order to obtain a low value of Ra within the work interval of this study, I and Ton should be fixed as low as possible, and conversely, the larger the selected U. And the optimal value of Ra was 0.44 m at optimal process parameters I = 1 A, U=60 V and Ton=9 s. The mathematical model for the SR can be effectively employed for the optimal selection of the die- sinking EDM process parameters. Empirical tests show that the model can calculate quite accurately predicted by SR. EDS, XRD and microstructure analysis has been completed to understand the form of white layer on the surface of the workpiece material. Machining surface quality at optimal parameters were analyzed. It has shown that resulting surface quality after die- sinking EDM is good.
Keywords:
Die sinking EDM; Surface roughness; Response surface methodology; White layer
_____________________________________________________________________________
INTRODUCION
60
by the SR, presence of surface cracks, and the white layer thickness, etc. The SR in EDM is associated with the distribution of the craters formed by the electric sparks [1]. That only 15% of the molten workpiece material is flushed away by the dielectric, and the remaining material resolidifies on the EDM surface due to fast cooling rate generated by the dielectric [2]. The optimum condition for SR of AISI H13 die steel after die- sinking EDM with copper electrode was obtained at low I, Ton and pulse off time (Tof), and it was concluded that the I is the major factor affecting both the responses, MRR and SR [3]. The prime advantage of employing RSM is the reduced number of experimental runs required to generate sufficient information about a statistically adequate result. Applied the RSM to investigate the effect of four controllable input variables namely: I, Ton, Tof and applied U on die- sinking EDM surface [4]. Experiments were conducted on AISI D2 tool steel with copper electrode, and the results were analyzed using ANOVA for the level of their significance. Effect of the workpiece hardness on the SR of AISID2 die steel material in die- sinking EDM was studied [5]. SR obtained is marginally influenced by the workpiece hardness. The attempt to focus their attention on the development of a comprehensive mathematical model for correlating the interactive and higher order influences of various die- sinking EDM parameters through RSM, utilizing the relevant experimental data as obtained through the experimentation of SR [6]. For the experimentation, grey relational analysis and RSM were used, and analysis of results for SR showed that the Ton and Tof have the highest impact on it [7]. A mathematical model has been formulated by applying RSM in order to estimate the machining characteristics such as MRR, TWR and SR in die- sinking EDM with copper electrode [8]. The objective was to identify the significant process parameters that affect the output characteristics. Modelling, optimization and to develop of mathematical model of MRR in die- sinking EDM for Ti-5Al-2.5Sn using RSM [9]. I, Ton, U and Toff was considered as input parameter to correlate with MRR. It was observed that the developed model was within the limits of the agreeable error and I effectively influences the performance measures. SR in EDM increases with the increase of I, Ton, SiC percentage, and gap voltage [10]. The correlation between process operating factors and performance indicators had determined, such as SR and MRR using two experimental approaches: Taguchi methodology and RSM [11]. Results analysis showed that the laser pulse energy and frequency are the most important operating factors. MRR is directly proportional to linear effects of the pulse energy and frequency, while the SR is inversely proportional to them. A mathematical models of the MRR and SR to correlate the dominant machining parameters, including the I, Ton, duty factor, and wire speed, in the Wire EDM process of aluminium oxide based ceramic material (Al2O3 + TiC) [12]. It has been concluded that the proposed mathematical models in this study would fit and predict values of the performance characteristics. The significant parameters that critically affect the performance characteristics are examined.
An experimental investigation is presented to explore the surface integrity of the die- sinking EDM surface. Parametric analysis has been carried out by conducting a set of experiments using SKD11 die steel workpiece with copper electrode. The investigating factors were I, Ton, and U. The effect of the machining parameters on the responses such as SR is studied and investigated. Designing and planning an experimental investigation to study the effects of EDM parameters on SR of the selected workpiece material, and analyze and verify the experimental results by using the RSM. EDS, XRD and microstructure analysis has been completed to understand the form of the workpiece material surface layer at optimal process parmaters.
EXPERIMENTAL SECTION
61
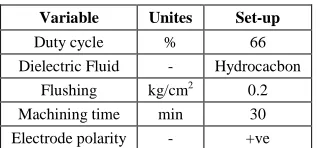
Table 1: Machining parameters
Variable Unites Set-up
Duty cycle % 66
Dielectric Fluid - Hydrocacbon
Flushing kg/cm2 0.2
Machining time min 30
Electrode polarity - +ve
[image:3.612.193.420.293.389.2]Experiments were conducted to study the effects of four machining parameters: I, Ton and U on SR of SKD11 die steel in die- sinking EDM. The Central Composite Design was used to conduct the experiments with three variables, having eight cube, three central points, in total of 11 runs in three blocks (Minitab16). The different levels of factors considered for this study are illustrated in Table 2. Table 3 presents run order, point type, block, the various combination of input parameters and the response SR obtained from these experimentations. SR was measured using a SJ-400 from Mitutoyo, Japan (Figure 1). SR is evaluated through Ra, and three readings were taken for each work specimen to compute the final, average measurement. The rest of the analysis was carried out on samples using a scanning electron micro-scope (SEM, model JSM 6490, JEOL, Japan). To analyze the phase composition of the surfaces, selected workpieces were analyzed using X–ray diffractometry (XRD) over a 2θ range from 5° to 85° with a model Axiovert 40MAT from Carl Zeiss, Germany. The chemical compositions of the machined surfaces were analyzed using energy-dispersive X-ray spectroscopy (EDS, model JSM–6490LA, JEOL, Japan).
[image:3.612.187.428.401.668.2]Figure 1: Electrodes and workpiece used
Table 2: Input variables used in the experiment and their levels
Variable Unites Set-up
-1 0 1
Voltage (U) V 40 50 60
Current (I) A 1 2 3
Pulse on time (Ton) (Ton)(Ton) µs 9 18 25
Table 3: Experimental strategy with obtained response
No exper. X1 X2 X3 U (V) I (A) Ton (µs) Ra (µm)
1 -1 -1 -1 40 1 9 0.485
2 0 0 0 50 2 18 0.985
3 1 1 1 60 3 25 1.242
4 1 -1 1 60 1 25 0.39
5 -1 1 1 40 3 25 1.393
6 -1 -1 1 40 1 25 0.54
7 1 -1 -1 60 1 9 0.407
8 -1 1 -1 40 3 9 0.893
9 0 0 0 50 2 18 0.957
10 0 0 0 50 2 18 0.985
11 1 1 -1 60 3 9 0.845
Respone Surface Methodology
62
independent variables influence a dependent variable or response, and the goal is to optimize this response. In many experimental conditions, it is possible to represent independent factors in quantitative form. In this work, RSM has been applied for developing the mathematical models in the form of multiple regression equations for the quality characteristic in die- sinking EDM. In applying the response surface methodology, the dependent variable is viewed as a surface to which a mathematical model is fitted. For the development of regression equations related to various quality characteristics of die- sinking EDM, the second order response surface has been assumed as:
k k k
2
0 i i ii i ij i j
i=1 i=1 i,j=1, i j
Y=b +
b x +
b x +
b x x
(1)Where Y is the corresponding response (SR produced by the various process variables of die- sinking EDM), xi (1,
2, …, k) is the input variables (xi are coded levels of k quantitative process variables), 2
x
i and xixj are the squaresand interaction terms, respectively, of these input variables. The unknown regression coefficients are b0, b1, b2, .., bij.
In order to estimate the regression coefficients, a number of experimental design techniques are available.
Minitab16 (a statistical software package) was used to estimate the coefficient of regression Equation 1 from the data obtained from the experiments. The response surface models are developed, which are used to predict the results by isoresponse contour plot and 3D response surface plots to study the main effect of the variables and the mutual interactions between the variables of the responses.
RESULTS AND DISCUSSION
The Analysis of Variance (ANOVA) of SR
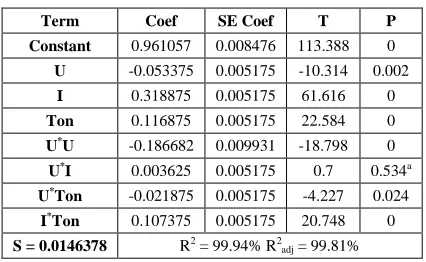
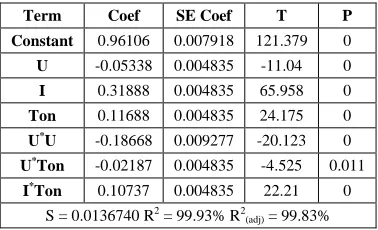
The effect of the machining parameters (I, Ton and U) on the response variable SR was evaluated by conducting experiments. Minitab software was used to find out the relationship between the input factors and the response SR. And the full quadratic model is considered for further analysis in this study. Table 4 represents the regression coefficients in coded units and its significance in the model. The columns in the table correspond to the terms, the value of the coefficients (Coef.), and the standard error of the coefficient (SE Coef), t-statistic and p-value to decide whether to reject or fail to reject the null hypothesis. To test the adequacy of the model, with a confidence level of 95%, the p-value of the statistically significant term should be less than 0.05. The terms marked “a” in the last column of the table are exceeding 0.05 value. Thus, these terms are insignificant and therefore eliminated for the further analysis. The blocking does not have any significant effect on the response, which reveals that the uncontrollable factors of the experiment conducted were held constant. The backward elimination process discards the insignificant terms to adjust the fitted quadratic model. The model, with rest of the terms after elimination, is presented in Table 5. After elimination, the values of R2 and R2adj are 99.93% and 99.83%, respectively. The
truncated model has lower R2 than that of full quadratic model (99.94%), and R2adj value is 99.81%, exhibiting
[image:4.612.200.413.510.641.2]significance of relationship between the response and the variables and the terms of the adequate model after the elimination are U, I, Ton, U2, U*Ton and I*Ton.
Table 4: Estimated regression coefficients for SR
Term Coef SE Coef T P
Constant 0.961057 0.008476 113.388 0
U -0.053375 0.005175 -10.314 0.002
I 0.318875 0.005175 61.616 0
Ton 0.116875 0.005175 22.584 0
U*U -0.186682 0.009931 -18.798 0
U*I 0.003625 0.005175 0.7 0.534a
U*Ton -0.021875 0.005175 -4.227 0.024
I*Ton 0.107375 0.005175 20.748 0
S = 0.0146378 R2 = 99.94% R2
63
Table 5: Estimated regression coefficients for SR (after backward elimination)
Term Coef SE Coef T P
Constant 0.96106 0.007918 121.379 0
U -0.05338 0.004835 -11.04 0
I 0.31888 0.004835 65.958 0
Ton 0.11688 0.004835 24.175 0
U*U -0.18668 0.009277 -20.123 0
U*Ton -0.02187 0.004835 -4.525 0.011
I*Ton 0.10737 0.004835 22.21 0
S = 0.0136740 R2 = 99.93% R2
(adj) = 99.83%
ANOVA is used to check the sufficiency of the second-order model, which includes test for significance of the regression model, model coefficients and test for lack-of- fit. Table 6 summaries the ANOVA of the model that comprises of two sources of variation, namely, regression and residual error. The variation due to the terms in the model is the sum of linear and square terms whereas the lack of fit and pure error contribute to residual error. The table depicts the sources of variation, degree of freedom (DF), sequential sum square eror (Seq SS), adjusted sum square error (Adj SS), adjusted mean square error (Adj MS), F statistic and the p-values in columns. The p-value of lack of fit is 0.699, which is ≥ 0.05, and certainly indicate that there is statistically insignificant “lack of fit” at 95% confidence level. However, the p-value of regression model and its all linear and square terms have p-value 0.000, hence they are statistically significant at 95% confidence and thus the model adequately represent the experimental data.
Table 6: Analysis of variance for SR
Source DF Seq SS Adj SS Adj MS F P
Regression 6 1.12999 1.13 0.18833 1007.2 0
Linear 3 0.95821 0.9455 0.31517 1685.6 0
U 1 0.02279 0.0228 0.02279 121.89 0
I 1 0.81345 0.8135 0.81345 4350.5 0
Ton 1 0.12197 0.1093 0.10928 584.44 0
U*U 1 0.07571 0.0757 0.07571 404.93 0
U*Ton 1 0.00383 0.0038 0.00383 20.47 0.01
I*Ton 1 0.09224 0.0922 0.09224 493.29 0
Residual Error 4 0.00064 0.0006 0.00021 - -
Lack-of-Fit 2 0.00023 0.0002 0.00011 0.43 0.7
Pure Error 2 0.00052 0.0005 0.00026 - -
Total 10 1.13073 - - - -
Multi-regression analysis was performed to the data to obtain a quadratic response surface model and the equation thus obtained in uncoded unit is (2),
SR = -4.10131 + 0.18599*U + 0.09070*I + 0.00143*Ton –0.00186*U2 – 2.7343e-04*U*Ton + 0.01342*I*Ton(2)
Effect of Process Parameters on SR
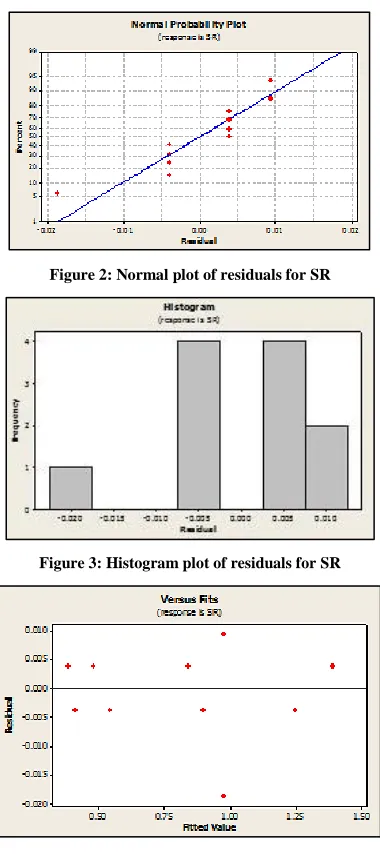
[image:5.612.179.433.336.501.2]64
Figure 2: Normal plot of residuals for SR
Figure 3: Histogram plot of residuals for SR
Figure 4: Plot of standardised residuals vs. fitted value for SR
65
Figure 5: Effect of factors on SR
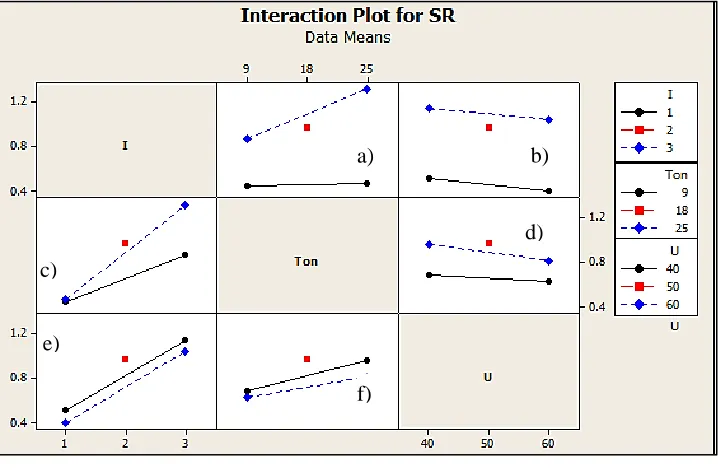
[image:7.612.127.486.327.562.2]Figure 6 contains two interaction plots for various two-factor interactions between I, U and Ton. Each pair of the factor is plotted keeping the other factors constant at the mean level. In each plot, the factors of interest are varied in three levels, low, medium and high levels. If the lines are nonparallel, an interaction exists between the factors (Figure 6). The greater the degree of departure from parallelism, the stronger is the interaction effect. It can be seen in the figure that the most important interaction effect is produced between I and Ton (Figure 6).
Figure 6: Interaction effect of factors on SR
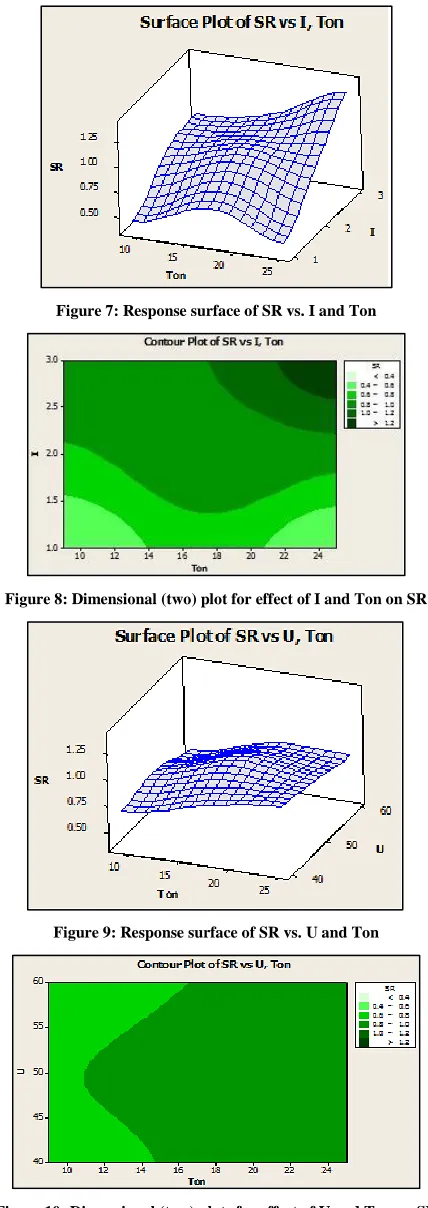
Figures 7 and 8 response surface for Ra in relation to the machining parameters of I and Ton. From the figure, it is unambiguous that Ra value is more with higher I and longer Ton, the value Ra tends to increase significantly with the increase in I for any value of Ton. This can be attributed to their dominant control over the input energy. A higher I and longer Ton may cause more frequent breakdown of the dielectric medium, and hence repeated melt expulsion with stronger spark. Thus, due to a higher temperature larger craters are formed on the machined surface. Hence, minimum Ra is obtained at low current (1 A) and Ton (9 s). Figures 9 and 10 shows that U*Ton interaction has affected SR, its influence is much smaller than the effect of I*Ton. Minimum Ra is obtained at low pulse on- time (9 s) and high voltage (60 V). From these observations, it can be concluded that I and Ton are directly proportional to the SR as compared to U, and for U*Ton the effect is very less as compared to the I*Ton.
a)
b)
c)
d)
e)
66
Figure 7: Response surface of SR vs. I and Ton
Figure 8: Dimensional (two) plot for effect of I and Ton on SR
[image:8.612.198.412.70.674.2]Figure 9: Response surface of SR vs. U and Ton
67
Confirmation ExperimentsThe estimated value of the Ra under optimal conditions: U=60 V, I=1A and Ton=18 s. After the selection of optimal level of the process parameters, the last step is to predict and verify the improvement of the response using the optimal level of the machining parameters. Confirmation experiments were carried out using the optimal process parameters as Current: 1 A, Voltage: 60 V, and Pulse on time: 9 µs. Table 7 shows the percentage of error present for experimental validation of the developed model for the responses with optimal parametric setting. Where SR are the difference between the experimentally observed data and the model predictions.
Table 7: Experimental validation of developed model with optimal parameter setting
Level Ra at optimal parameters (µs)
Predicted value Experimental value % difference
U = 60 V, I=1A, Ton= 9 ms 0.44 0.407 -7.644
Analysis of Surface Layers of Machined Surface at Optimal Parameters
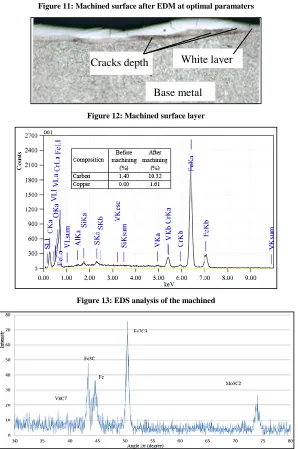
Assuming that each spark leads to the formation of a spherical crater on the surface of the workpiece, the volume of metal removed per crater will be proportional to the cube of the crater depth. The surface accumulated many small craters created by the sparks generated during the pulse cycle, as shown in Figure 11. The craters were on the radius of curvature created when the melting and evaporating materials affected by the dielectric fluid were simultaneously quenched and caused the outer surface tension. The surface produced by EDM consists of a multitude of small craters. This may help in oil retention and better lubrication, especially for components where lubrication is a problem. The random distribution of the craters does not result in an appreciable reduction in fatigue strength of the components. The white layer contains a high density of microscopic cracks that run across the total depth of the white layer is shown in Figure 12, only seldom continuing into the layers beneath. The cracks are mostly perpendicular to the surface of the workpiece. These cracks contain oil, which facilitates oil to exist in the surface during work, this reduces friction and increases the abrasion resistance of the mould surface.
The EDS analysis of the white layer showed the presence of major constituent elements such as Fe, C, Mn, Si, V, Cr, and Mo, also in addition to Cu (from the Cu electrode), as shown in Figure 4. The peaks corresponding to the different elements are shown in Figure 13. The Cu peaks confirm the presence of tool material in the deposited layer. The carbon content on the white layer increased greatly from 0.40% to 10.32% for Cu electrode. This is because, during the pulse, the thermal energy of the emitted sparks generated carbon cracking oil, thereby creating the carbon that entered the machined surface. The increase in carbon content improves the hardness and strength of the surface but reduces the toughness and ductility. The appearance of the electrode materials on the machined surface – Cu electrode: from 0.054 to 1.61% is the result of the melted and evaporated electrode materials moving and sticking to the surface of the workpiece. An XRD analysis was carried to confirm the transfer of tool material from the electrode and of carbon from the dielectric fluid to the workpiece surface and also to identify the phases of any compounds formed during the EDM process; these results are shown in Figure 14. Various compounds formed on the surface of the workpiece. The pattern indicated the presence of iron carbide (Fe7C3 and Fe3C), molybdenum
carbide (Mo3C7), and vanadium carbide (V8C7). The presence of Fe7C3 and Fe3C increase the hardness of the
machined surface. The corrosion resistance and hardness of the machined surface can also be improved by Mo3C7
and V8C7. Increased Cu content can improve the corrosion resistance. In EDM process, the change in surface quality
68
[image:10.612.130.484.73.219.2]a) SEM image at 100 x b) SEM image at 400 x
Figure 11: Machined surface after EDM at optimal paramaters
Figure 12: Machined surface layer
Figure 13: EDS analysis of the machined
Figure 14: XRD patterns of the machined surface
White layer
Base metal
Cracks depth
Cracks
Cracks
[image:10.612.160.458.230.679.2]69
CONCLUSIONIn this study, the influence of the most significant factors on SR has been studied for SKD11 die steel. RSM design was used to conduct the experiment with I, Ton, and U as input parameters. The ranges of these parameters were chosen which are widely used by machinists to control die- sinking EDM machine. The input factors that significantly influenced the output responses were I, Ton, U, square of U, interaction between I and Ton, and interaction between U and Ton with a confidence level of 95%. The result reveals that in order to obtain a low value of Ra within the work interval of this study, I and Ton should be fixed as low as possible, and conversely, the larger the selected voltage. However, the developed mathematical model for the Ra can be effectively employed for the optimal selection of the die- sinking EDM process parameters to achieve good surface of SKD11 die steel workpieces (2). The error between experimental and predicted values at the optimal combinations of parameters setting for Ra is 7.64%. This confirms proper reproducibility of experimental conclusion. Analyzing the quality of the surface layer after die sinking EDM, its results are good for the working condition of the mould.
ACKNOWLEDGEMENTS
This research work was funded and supported by HaUI-Foxcom Center for Technical Tranining in the Ha Noi University of industry. To obtain the results of this research, the authors would like to thank to Faculty of Mechanical Engineering – Hanoi University of Industry – Vietnam, Institute of Materials Science - Vietnam Academy of Science and Technology who helped during the research process.
REFERENCES
[1] JG Lopez; P Verleysen; J Degrieck. Engng Mater Struct. 2012, 35, 1120-1132. [2] MK Pradhan; CK Biswas. Int J Machin Machinability Materials. 2011, 9, 66-85.
[3] A Jaharah; C Liang; MR Wahid; CC Hassan. Int J Mech Materials Eng. 2008, 3(1), 25-29. [4] MK Pradhan; CK Biswas. Int J Eng Appl Sci. 2009, 5, 346-351.
[5] JD Marafona; A Araujo. Int J Machine Tools Manuf. 2009, 49(9), 744-748.
[6] R Atefi; N Javam; A Razmavar; F Teimoori. Res J Appl Sci Eng Technol. 2012, 4(10), 1287-1294. [7] A Bergaley; N Sharma. Int J Innovat Technol Explor Eng. 2013, 3(3), 44-48.
[8] S Gopalakannan; T Senthilvelan; K Kalaichelvan. Adv Materials Res. 2012, 488-489, 856-860.
[9] MM Rahman, MAR Khan, K Kadirgama, MM Noor, RA Bakar. Mathematical modeling of material removal rate for ti-5al-2.5sn through edm process: A surface response method, European Conference of Mechanical Engineering, ECME’10, European Conference of Control, ECC’10, 2010, 34-37.
[10] SS Habib. Appl Mathematical Modelling. 2009, 33(12), 4397-4407.