IOP Conference Series: Materials Science and Engineering
PAPER • OPEN ACCESS
Strength development of pervious concrete
containing engineered biomass aggregate
To cite this article: A A M Sharif et al 2017 IOP Conf. Ser.: Mater. Sci. Eng. 271 012002
View the article online for updates and enhancements.
Related content
The influence of aggregates type on W/C ratio on the strength and other properties of concrete
J Malaiskiene, G Skripkiunas, M Vaiciene et al.
-Strength Development of Lime Treated Artificial Organic Soil
S W Yeo, F N L Ling, A Sulaeman et al.
-Compressive Strength and Modulus of Elasticity of Concrete with Cubed Waste Tire Rubbers as Coarse Aggregates
Y Haryanto, N I S Hermanto, G Pamudji et al.
1234567890
GCoMSE2017 IOP Publishing
IOP Conf. Series: Materials Science and Engineering 271 (2017) 012002 doi:10.1088/1757-899X/271/1/012002
Strength development of pervious concrete containing
engineered biomass aggregate
A A M Sharif 1, S Shahidan1,H BKoh1, A Kandash1and S S Mohd Zuki1
1
Jamilus Research Center, Faculty of Civil and Environmental Engineering, Universiti Tun Hussein Onn Malaysia, Johor Bahru Batu Pahat.
Corresponding author: [email protected]
Abstract. Pervious concrete with high porosity has good permeability and low mechanical strengths are commonly used in controlling storm water management. It is different from normal concrete. It is only containing single size of coarse aggregate and has lower density compared with normal concrete. This study was focused on the effect of Engineered Biomass Aggregate (EBA) on the compressive strength, void ratio and water permeability of pervious concrete. EBA was prepared by coating the biomass aggregate with epoxy resin. EBA was used to replace natural coarse aggregate ranging from 0% to 25%. 150 mm cube specimens were prepared and used to study the compressive strength, void ratio and water permeability. Compressive strength was tested at 7, 14 and 28 days. Meanwhile, void ratio and permeability tests were carried out on 28 days. The experimental results showed that pervious concrete containing EBA gained lower compressive strength. The compressive strength was reduced gradually by increasing the percentage of EBA. Overall, Pervious concrete containing EBA achieved higher void ratio and permeability.
1. Introduction
Concrete is considered as major cause of natural materials deployment. However there are many by-product materials which are being problematic to the environment as being waste material. Biomass aggregate (BA) is conceded as by-product material from the industrial effluents therefore, it is being dumped into the landfills apart from that, and biomass can be recycled to be used in the production of concrete as biomass aggregate [1-5]. Biomass aggregate is used in this study. It was estimated in 1998 that more than 390 million tons of biomass was produced annually but its use was less than 15%. Production of biomass will increase especially in countries such as China and India. It is now estimated that about 780 million tons of biomass was produced in 2010 [3, 5-8]. Biomass aggregate (BA) is produced from the biomass wastes which used to generate heat in the furnace at around 800 C for the manufacturing process. After the heat generation procedure, the remaining biomass waste ranging from 10% to 20% and the wastes are left and it becomes aggregate after cool down. This kind of aggregate can define as biomass aggregate (BA) and it is potentially become the sustainable material for concrete [6, 9, 10].
2
1234567890
GCoMSE2017 IOP Publishing
IOP Conf. Series: Materials Science and Engineering 271 (2017) 012002 doi:10.1088/1757-899X/271/1/012002
sand. In the past of 30 years, pervious concrete has been increasingly used in the United States, and among the Best Management Practices (BMP) recommended by the Environmental Protection Agency (EPA). By capturing storm water and allowing it to seep into the ground, pervious concrete is instrumental in recharging groundwater and reducing storm water runoff. The use of pervious concrete in building site design can also aid in the process of qualifying the building for Leadership in Energy and Environmental Design (LEED) Green Building Rating System credits [7, 8, 12, 14]. Innovative development of engineered biomass aggregate pervious concrete for sustainable construction is the main aim of this research.
2. Material and procedure
All the procedure and method preparation have been comply with the ASTM and EN BS standard [15-18].
2.1. Materials
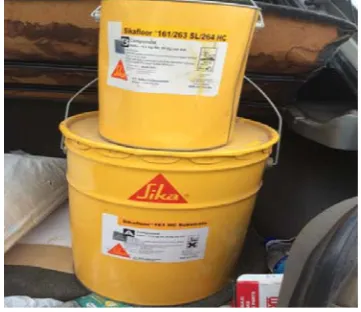
[image:3.595.207.388.395.551.2]The constituent materials used in this research were composite cement, crushed granite aggregate with a nominal size of (8-20) mm, water, superplasticizers (SP) and engineered biomass aggregate (EBA).Engineered biomass aggregate (EBA) was produced by immersing the biomass aggregate with epoxy resins and hardener. Once epoxy resins are hardened, it will produce a coating layer on the surface of biomass aggregate. The coated biomass aggregate is named as engineered biomass aggregate (EBA). The epoxy resins, hardener, biomass aggregate and engineered biomass aggregate (EBA) are shown in figure 1 and figure 2 respectively.
[image:3.595.140.420.400.716.2]Figure 1. Epoxy resin and hardener.
1234567890
GCoMSE2017 IOP Publishing
IOP Conf. Series: Materials Science and Engineering 271 (2017) 012002 doi:10.1088/1757-899X/271/1/012002
2.2. Producing engineered biomass aggregate
The EBA is produced by mixing the epoxy resin (Sikafloor-161 HC) with the hardener [7]. Before mingling the hardener with the epoxy resin, the epoxy resin needs to be mixed up. A 0.42 kg of hardener was mixed with 1.52 kg epoxy resin inside a small pan and mingles it very well for a short time. 8 kg of biomass aggregate was mixed with the 2 kg of epoxy resin and hardener inside a pan to produce the EBA. After mixing, the EBA are taken out of the pan for drying, and underlid by plastic to avoid sticking to the plate surface. The EBA should be left on the room temperature for 24 hours to ensure well drying, and then collect the EBA after 24 hours drying period.
2.3. Mix design
[image:4.595.119.476.354.470.2]Six pervious concrete mixes, as shown in table 1 were prepared. Since, there is no existing standard method of designing concrete mixes incorporating engineered biomass aggregate, the method of mix design proposed by [6]. The previous research [6, 19] was employed to design a pervious concrete mix with engineered biomass aggregate coated with plastic bag. The mix was designed to have a 28-day target compressive strength of 10 MPa. Superplasticizer of 1 liter/100 kg cement was used to increase the workability of the low water cement ratio pervious concrete mixtures.
Table 1. Mix design for pervious concrete by adding EBA.
2.4 Specimens and tests
Concrete cubes of 150 x 150 x 150 mm were used to evaluate the compressive strength, water permeability and void ratio. All hardened concrete cube specimens will be subjected to water curing. The number of specimens used in the tests and the distribution is tabulated in table 2.
Table 2. Number of specimens.
Specimen Test Number of specimens
7-day 14-day 28-day
150 x 150 x 150 mm cube compressive strength 3 3 3
150 x 150 x 150 mm cube water permeability - - 3
150 x 150 x 150 mm cube void ratio - - 3
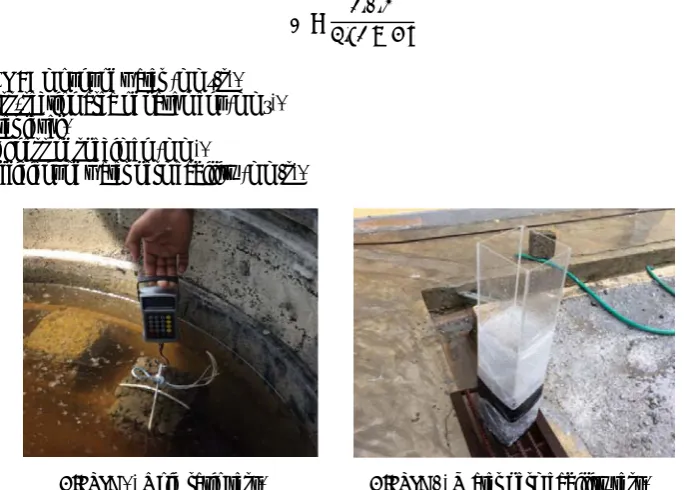
Compressive strength test was conducted based on BS EN 12390-3: 2009 [9]. Three cubes were tested for each age. Concrete cubes used for void ratio are the same cubes used for the 28 day compressive strength test. Void ratio test (figure3) was carried out at 28 day accordance to BS EN 12390-7: 2009 [10]. Void ratio of pervious concrete is defined as the percentage of the total volume of void to the total volume of specimen. It was calculated based on the following equation,
Void Ratio (%) = 1 − () 100 (1)
Mix Percentage Water Cement C.A EBA SP1%
M1 100% N.A 114 380 1620 --- 3.8
M2 95 NA,5EBA 114 380 1539 81 3.8
M3 90 NA,10EBA 114 380 1385 154 3.8
M4 85 NA,15EBA 114 380 1177 208 3.8
M5 80 NA,20EBA 114 380 942 236 3.8
4
1234567890
GCoMSE2017 IOP Publishing
IOP Conf. Series: Materials Science and Engineering 271 (2017) 012002 doi:10.1088/1757-899X/271/1/012002
Where,as ;
W1 is the weight of specimen submerged under water (kg)
W2 is the weight of specimen at a saturated surface dry condition (kg) V is the volume of specimen (m³)
ρ is the density of water in (kg/m³)
Permeability test was carried out according to JCI-SPO3-1 (Japan Concrete Institute) standard. Permeability test was conducted on the 150 mm pervious concrete cubes at 28 days. Figure 4 shows the water permeability test equipment. It was calculated based on the following equation:
=
( + )
(2)
Where, Q: Amount of water (mm³/s). A: Cross-section area of pavement (mm²). H: Water level.
L: Thickness of specimen (mm).
K: Coefficient of water permeability (mm/s).
Figure 3. Void ratio test. Figure 4. Water permeability test.
3. Result and discussion
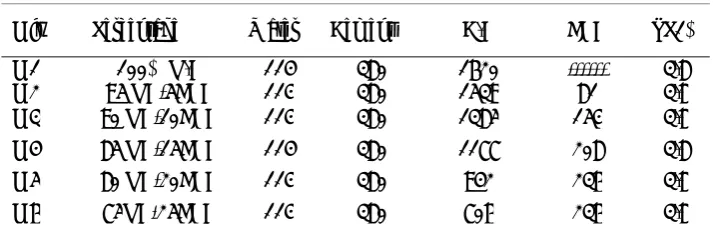
[image:5.595.121.466.257.502.2]Table 3 shown below summarizes the tests conducted on this study, which are, density, void ratio, water permeability, flow rate and compressive strength test. Compressive strength was tested at 7, 14 and 28 days. Meanwhile, void ratio and permeability tests were carried out on 28 days.
Table 3. Values of all tests.
Type of
Mix Percentage
Density (kg/ m³)
Void ratio %
Flow rate (mm/s)
Compressive Strength (MPa)
7days 14days 28days
M1 100% N.A 1956 21.8 8.87 9.4 8.4 13.6
M2 95NA,5EBA 1985 15.3 9.62 4.5 6.3 2.6
M3 90NA,10EBA 1828 25.3 10 10.7 9.7 6
M4 85NA,15EBA 1843 24.7 11 7.4 6.4 6.8
M5 80NA,20EBA 1766 26.8 11.8 4.7 3.3 8.1
[image:5.595.96.500.595.695.2]1234567890
GCoMSE2017 IOP Publishing
IOP Conf. Series: Materials Science and Engineering 271 (2017) 012002 doi:10.1088/1757-899X/271/1/012002
3.1. Density
Table 3 shows the results of density when adding different percentages of EBA. Decreases of densities were recorded when adding EBA to the mix, and the reason behind this decrease is the lower density of EBA comparing to the normal aggregate. Only the second mix M2 recorded an increase of density, though it included EBA. The maximum density recorded were the M2 mix which included 5% of EBA, while the lowest density were recorded for the M5 mix, which included 20% of EBA.
3.2. Compressive strength
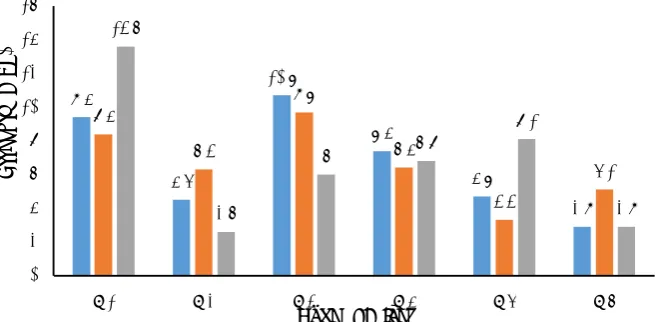
Figure 5, summarized the values of compressive strengths for all mixes at 7, 14 and 28 days of curing. From the Figure, it can be observed that the increase of percentage of EBA resulted in decreasing the values of compressive strength, since the EBA has low strength comparing to the normal aggregate. Only M3 showed an increase of the compressive strength, though it included 10% of EBA. The highest value were recorded for M1 mix that includes 0% engineered biomass aggregate at 28 days of curing time, while the lowest value were also recorded for the mixture with 5% of engineered biomass aggregate at 28 days of curing time, with the value of 2.6 MPa. 2.6 MPa, which were recorded for the
[image:6.595.130.458.357.518.2]5% engineered biomass aggregate mixture at 28days of curing time.
Figure 5. Compressive strength of EBA for 7, 14 and 28 days.
Based on the previous study conducted by [6] which was conducted about the biomass aggregates wrapped with plastic, and recorded an increase of the compressive strength with the increase of engineered biomass aggregates values. It can be observed that the biomass aggregates wrapped with plastic resist solving with water and helped in increasing the compressive strength, while the epoxy resin with hardened need to be studied to observe the effect of water to it, since the compressive strength decreased with the increase of biomass aggregates immersed with epoxy resin and hardened and also with the increase of curing time [6].
3.3. Total void ratio
Table 3 shows the results of void ratio for various mixes including different percentages of EBA. Basically, the increase of EBA will lead to increase of void ratio. The reason behind the increase of void ratio is the absence of the aggregate in the mixes, giving a space for voids. The highest values of void ratio were obtained at M5 which included 20%, while the lowest values were obtained at M2 which included 5% of EBA.
9.4 4.5 10.7 7.4 4.7 2.9 8.4 6.3 9.7 6.4 3.3 5.1 13.6 2.6 6 6.8 8.1 2.9 0 2 4 6 8 10 12 14 16
M1 M2 M3 M4 M5 M6
Str en g th (M P a )
Type of Mixes
6
1234567890
GCoMSE2017 IOP Publishing
IOP Conf. Series: Materials Science and Engineering 271 (2017) 012002 doi:10.1088/1757-899X/271/1/012002
3.4. Water permeability test
Determining the time for the water to pass through the cubes is called the water permeability. The test was conducted using a tube with specific dimensions to calculate discharge time. From table 3, it can be observed the higher the percentage of EBA, the higher the water permeability. M6 which included 25% of EBA recorded the highest value of water permeability, while the M1, which include 0% of EBA recorded the lowest value of water permeability. The behind the increase of water permeability with the increase of EBA percentage is the smooth surface of the EBA, which allow the water to move in a faster rate.
4. Conclusion
To sum up, the addition of Engineered Biomass Aggregate (EBA) lead to an increase of void ratio and water permeability, and thus decrease the compressive strength of the pervious concrete. Engineered Biomass Aggregate (EBA), as a partial replacement of conventional biomass aggregates, tends to increase the water permeability, and this increase of water permeability results in decreasing the compressive strength, except for the M3 that contains 10% of EBA which results in increasing the compressive strength. Void ratio was affected by the replacement of EBA. Void ratio tended to increase by the addition of EBA, except for the M2 mix that contains 5% of EBA. In terms of compressive strength, the optimum percentage was 10% EBA, which recorded the highest value of compressive strength. The mix that included 20% EBA recorded the highest value of void ratio, while the optimum mix that recorded the highest value of water permeability was the mix included 25% EBA.
5. References
[1] Montes F and Haselbach L 2006 Measuring hydraulic conductivity in pervious concrete, Environ. Eng. Sci.23 960-969
[2] Shahidan S, Isham I and Jamaluddin N 2016 A review on waste minimization by adopting in
self-compacting concrete MATEC Web of Conf. vol 47 (Paris: EDP Sciences) 01003
[3] Lee Y L and Krishna R N 2014 Biomass aggregate geopolymer concrete–Malaysia experience,
Int. J. Civ. Eng. Technol. (IJCIET)5 340-356
[4] Teraiya D, Doshi U, Viradiya P, Yagnik A and Joshi T 2015 To develop method to find out
permeability and void ratio for pervious concrete, Int. J. Res. Eng. Technol.(IJRET) 4 177–
182
[5] Ali N, Zainal N A, Burhanudin M K, Abdul Samad A A, Mohamad N, Shahidan S and Abdullah S R 2016 Physical and mechanical properties of compressed earth brick ( CEB )
containing sugarcane bagasse ash MATEC Web of Conf. vol 47 (Paris: EDP Sciences) 01018
[6] Shahidan S, Koh H B, Sharif Alansi A M and Loon L Y 2016 Strength development and water
permeability of engineered biomass aggregate pervious concrete MATEC Web of Conf. vol
47 (Paris: EDP Sciences) 01007
[7] Unnikrishnan K P and Thachil E T 2006 Studies on the Toughening of Epoxy Resins PhD Thesis
(India: Cochin University of Science and Technology) pp 1 - 126
[8] Shahidan S, Mohd Zuki S S, Rahim M A, Ali N and Mohamad N 2016 Amplitude distribution
of emission wave for cracking process MATEC Web of Conf. vol 47 (Paris: EDP Sciences)
02013
[9] Lee Y L, Goh K S, Koh H B and Bakar I 2009 Foamed aggregate pervious concrete – an option
for road on peat Proc. of MUCET 2009, Malaysian Technical Universities Conf. on
Engineering and Technology (Pahang, Malaysia) (Malaysia: Malaysian Technical Universities Network (MTUN)) pp 1 - 4
[10] Shahidan S, Leman A S, Senin M S and Hannan N I R R 2017 Suitability of coconut shell
concrete for precast cool wall panel-A review MATEC Web of Conf. vol 87 (Paris: EDP
1234567890
GCoMSE2017 IOP Publishing
IOP Conf. Series: Materials Science and Engineering 271 (2017) 012002 doi:10.1088/1757-899X/271/1/012002
[11] Khalid F S, Herman H S and Azmi N B 2017 Properties of sugarcane fiber on the strength of
the normal and lightweight concrete MATEC Web of Conf. vol 103 (Paris: EDP Sciences)
01021
[12] Luckett K 2009 Green Roof Construction and Maintenance (USA: McGraw-Hill Companies,
Inc.) pp 1-175
[13] Zaetang Y, Sata V, Wongsa A and Chindaprasirt P 2016 Properties of pervious concrete
containing recycled concrete block aggregate and recycled concrete aggregate, Constr. Build.
Mater.111 15-21
[14] Ramzi N I R, Shahidan S, Maarof M Z and Ali N 2016 Physical and Chemical Properties of
Coal Bottom Ash (CBA) from Tanjung Bin Power Plant IOP Conference Series: Materials
Science and Engineering vol 160 (United Kingdom: IOP Publishing) 12056
[15] ASTM-C128-97 2007 Standard Test Method for Relative Density (Specific Gravity) and
Absorption of Fine Aggregate (USA: ASTM International) vol. 04 pp. 1–5
[16] ASTM: C33-02 2010 Standard Specification for Concrete Aggregates (USA: ASTM
International) pp 1–11
[17] ASTM: C29/C29M-09 2009 Standard Test Method for Bulk Density (‘Unit Weight’) and Voids
in Aggregate (USA: ASTM International) pp 1–5
[18] BS EN 12390-3 2009 Testing Hardened Concrete: Compressive Strength of Test Specimens
(London: British Standard Institution) pp 1-22
[19] Senin M S, Shahidan S, Leman A S and Hannan N I R R 2016 Analysis of physical properties and mineralogical of pyrolysis tires rubber ash compared natural sand in concrete material IOP Conference Series: Materials Science and Engineering vol 160 (United Kingdom: IOP Publishing) 12053
Acknowledgement
The authors acknowledge the technical and financial support provided by Universiti Tun Hussein Onn Malaysia and Grant Vot (U523).