Spectral Filtering of Photovoltaic Cells Using Novel
Bio-Filter: Silver Coated Ixora Extract Using
Methanol Solution
Emetere Moses E.1,2,*, Adeyemo Nehemiah1
1
Department of Physics, Covenant University Canaan Land, Nigeria
2
Department of Mechanical Engineering Science, University of Johannesburg, South Africa
Received August 25, 2019; Revised September 24, 2019; Accepted October 5, 2019
Copyright©2019 by authors, all rights reserved. Authors agree that this article remains permanently open access under the terms of the Creative Commons Attribution License 4.0 International License
Abstract
Photovoltaic (PV) solar panel imported into Africa was observed to have low lifespan due to the spectrum of harmful solar radiation hitting the surface of the PV panel. In this research, the bio-filter was synthesized using plant extract and silver. The dark room experiment was carried out to examine capacity of the PV panel accept specific radiations. The bio-filter was sprayed on the PV panel and the measurement for a sprayed and unsprayed PV panel were obtained. It was discovered that the bi-filter was effective to stabilize the measured parameters such as current, voltage and power.Keywords
Photovoltaic, Bio-Filter, Spectral Filtering, Solar Energy, Energy1. Introduction
Photovoltaic (PV) cell technologies do not discharge or emit greenhouse gases directly and can save over 30 million tons of carbon per exajoule of electricity generated in comparison to natural gas turbines running at about 45% efficiency. Unlike fossil fuels, it is eco-friendly and have existed for over a thousand years. Photovoltaic cell (PV) is categorized by constraints that are determined by the producers when tested under the Standard Test Conditions (STC), that is irradiance of 1000 W/m2, constant temperature of the cells at 25◦C, and the AM1.5 standard sunlight spectrum [1,2]. Though, these parameters cannot be used to estimate the energy output of a module under real operating conditions, because of different environmental factors, geographical location of the module and spectral response of each PV technology that will affect the module in a real operating condition[1-3]. Thin-film and other advanced technologies will have a
large input in the output improvement of PV cells in the nearest future. However, research already shows that the mono and poly-crystalline silicon cells of about 85%–90% vastly represent the PV market [3,4].
systems are incredibly low due to weak government aid.
2. Materials and Method
The materials used for the experiment includes: monocrystalline panel (3watt), solarimeter, silver Nitrate (Ag2(NO3)), colour filters, polycrystalline panel (4 watt),
halogen lamp, methanol solution, multimter, weighing balance, beaker and data logger.
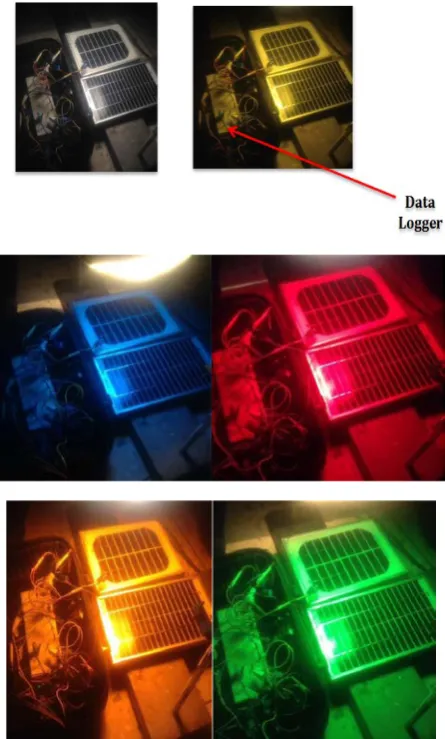
[image:2.595.63.286.249.619.2]The dark room experiment was carried using different colour filter as shown in Figure 1. Different colour filter was used to filter the spectra of light hitting the solar panel.
Figure 1. Spectral filtering using colour filter in the dark room
The data logger was used to measure desired parameters such as radiation, current, voltage and power for two types of PV panels i.e. monocrystalline and polycrystalline. A data logger records and saves all readings gotten from the PV panels in an SD card. The dark room experiment is to help understand the result gotten from the darkroom when compared with the data or result gotten from the silver coated plant extract The colour of the filters used for the
experiment are yellow, white, blue, orange, green, yellow and red. The filters were selected from the component of visible radiation (VIS) whose wavelength range is between 400 nm and 800 nm, which can be perceived by the human eye. The target of the biofilter is to screen-out infra-red radiation. infrared (IR) radiation covers the wavelength range above 800 nm and is subdivided in IR-A, IR-B and IR-C ranges
The biofilter was synthesized in the laboratory using ixora flower extract and silver oxide. The ixora flower were gotten around the Ota environ, Nigeria (Figure 2a). The flowers were divided into four parts. Each portion of the flower was grinded (using electronic blender) in 25ml of water (H2O), methanol (CH3-OH), ethanol (C2H5 -OH) and
butanol (C4H9-OH). After blending, extracts were filtered
out and mixed with 1.84g/mole of silver oxide (Ag2O) and
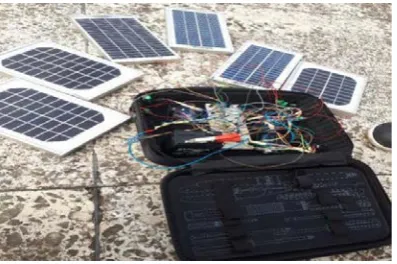
[image:2.595.306.536.391.703.2]then left for a day so that the silver oxide can dissolve with the mixture. The filtrate was not heated to conserve vital chemical components. The filtrate was sprayed on the PV module as illustrated in Figure 2b. The two-polycrystalline PV panels (i.e. one panel sprayed with the biofilter and the second panel not sprayed) and four monocrystalline panels (i.e. two sprayed with the biofilter and the other two panels not sprayed) were connected to the data logger as shown in Figure 3.
Figure 2a. Ixora flower
Figure 3. Experimental set-up for field measurement
Figure 2b explains the essence of the experimentation as the bio-filter is expected to be sprayed over the PV module with high precision. However in this research, the precision on the thickness of the layer was not measured but can be estimated by knowing the volume of liquid sprayed on the PV module. The simplest way of knowing the expected thickness of the bio-filter is:
𝑇ℎ𝑖𝑐𝑘𝑛𝑒𝑠𝑠 =𝑆𝑢𝑟𝑓𝑎𝑐𝑒 𝑎𝑟𝑒𝑎 𝑜𝑓 𝑃𝑉 𝑀𝑜𝑑𝑢𝑙𝑒𝑉𝑜𝑙𝑢𝑚𝑒 𝑜𝑓 𝑏𝑖𝑜 − 𝑓𝑖𝑙𝑡𝑒𝑟
It is recommended that for a more precise determination of the uniform thickness of the biofilter, spray pyrolysis should be used.
3. Results and Discussion
[image:3.595.72.528.379.565.2]Figure 4 shows the dark room experiment when the polycrystalline panels are connected in parallel. It was observed that the white, orange, yellow and red colour filters generated high values of power. The white colour filter had the normal trend expected. The orange, yellow and red colour filters had a unique power pattern. In other words, the colour filter experiment shows that the PV panel responds to certain colours. This result agrees with already established research in this area of study [17]. Also, theoretical, the wavelength of the preferred colour filter corroborates the choice of the filter. The wavelength of red falls between 622 and 780 nanometers, while that for orange is 597 to 622 nanometers. The wavelength for yellow is 577 to 597 nanometers. Hence the need to choose plant extracts of such colour as bio-filter.
The graph below (Figure 5) shows the UV radiation (w/m2) against time (sec) plot of the silver coated ixora extract in methanol solution for the polycrystalline panel. The graph shows stability over the time a period of time (1000-4300 sec). The UV over the period had an average of 16W/m2. It is observed that there were positive fluctuations at time between 5000 and 8000 sec. Also, there were negative fluctuations of UV between 4400 and 6000 sec. It can therefore be said that the graph is both stable and transient in nature. The trend of UV radiation is very important in research as it has both beneficial and harmful effects depending upon the type of organism or material (e.g. PV cells), wavelength region (UVA, UVB, or UVC) and irradiation dose (i.e. intensity within a specified duration). In this case, the radiation was found in the UVC i.e. hard UV. This event is common to tropic region were solar irradiance are interfered by cloud movement or modulating corrective weather system [10].
Figure 5. UV radiation (w/m2) against Time (sec) (polycrystalline panel)
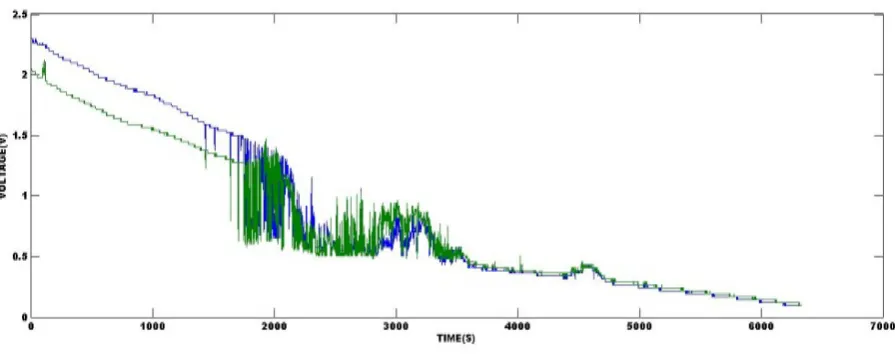
The graph below (Figure 6) shows the voltage (V) against time (sec) plot of the silver coated ixora extract in methanol solution for the polycrystalline panel. The graph is both a linear and a transient graph, it shows a stable linear decrease at time 0-1700 sec and also at time 4000-6200 sec. The perturbations in the graph show the transient portion of solar radiation over the research site. The blue colour shows the coated panel while the green shows the uncoated panel for the polycrystalline panel. From the graph it can be observed that the voltage of both panels gave almost the same result, but there was a slight increase in the voltage of the coated PV panel.
Figure 6. Voltage (V) against Time (sec) of silver coated ixora extract in methanol solution for the polycrystalline panel
[image:4.595.75.523.488.665.2]Figure 7. Current (A) against Time (sec) of silver coated ixora extract in methanol solution for the polycrystalline panel
The graph below (Figure 8) shows the power (W) against time (sec) plot of the silver coated ixora extract in methanol solution for the polycrystalline panel. The blue colour shows the coated panel while the green shows the uncoated panel for the polycrystalline panel. From the graph it can be observed that the power generated in both panels have almost the same result, this is because there has already been an increase in the currents and voltages of the polycrystalline panels. The graph is both linear and transient in nature. This means that though the bio-filter cannot control the trend of the solar radiation, it has the ability to make irradiance assimilation smoother.
Figure 8. Power (W) against time (sec) of the silver coated ixora extract in methanol solution for the polycrystalline panel.
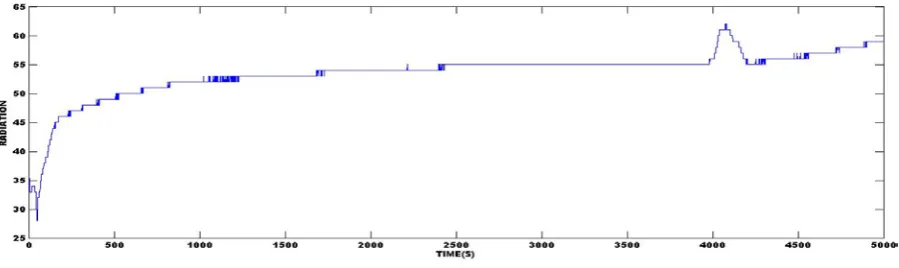
The graph below (Figure 9) shows the UV radiation (w/m2) against time (sec) plot of the silver coated ixora extract in methanol solution for the monocrystalline panel. The graph shows a stepwise increase in UV radiation. The UV over the period was at its peak at (4000 – 4200 sec) and measured as 62W/m2.
[image:5.595.74.523.376.522.2] [image:5.595.75.525.602.736.2]The graph below (Figure 10) shows the voltage (V) against time (sec) plot of the silver coated ixora extract in methanol solution for the monocrystalline panel. The blue colour shows the coated panel while the green shows the uncoated panel for the polycrystalline panel. From the graph it can be observed that there was a drastic increase in the voltage output of the coated panel i.e. >10% voltage increase. However, both panels had stepwise increase at some points and its peak at 4000 – 4300 sec. This graph shows that the bio-filter was effective to screen the harmful spectra and allow the panel function at optimized state.
Figure 10. Voltage (V) against Time (sec) of the silver coated ixora extract in methanol solution for the monocrystalline panel.
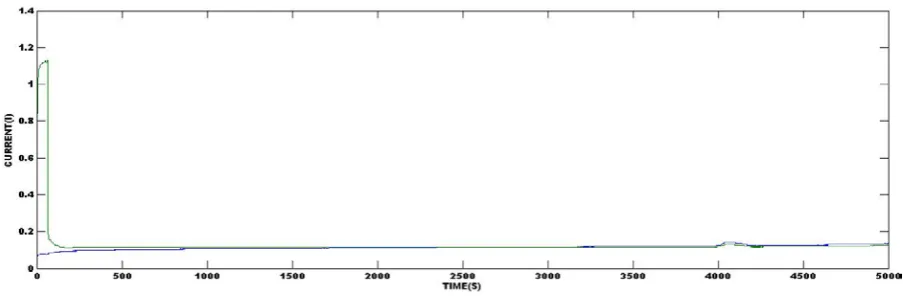
The graph below (Figure 11) shows the current (A) against time (sec) plot of the silver coated ixora extract in methanol solution for the monocrystalline panel. The blue colour shows the coated panel while the green shows the uncoated monocrystalline PV panel. From the graph it can be observed that the current for the coated panel at 200 – 500sec was very high then started drop with respect to time as radiation reduced until it became lower than the uncoated panel. Most time high surface temperature can be responsible for this kind of current generation [18].
Figure 11. Current (A) against Time (sec) of the silver coated ixora extract in methanol solution extract for the monocrystalline panel.
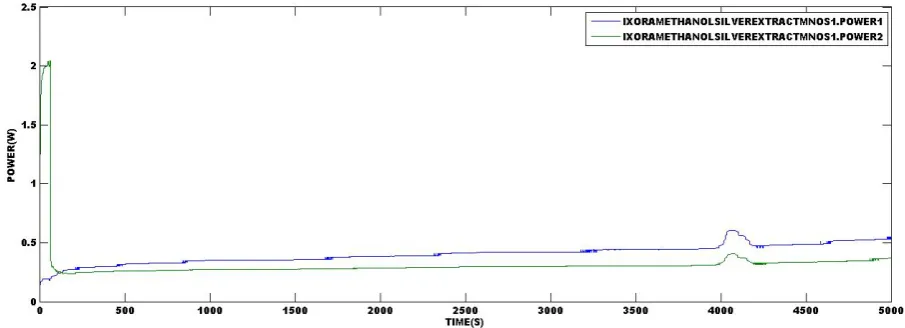
[image:6.595.73.525.394.544.2]Figure 12. Power (W) against Time (sec) of the silver coated ixora extract in methanol solution for the monocrystalline panel.
4. Conclusions
From the research, it can be affirmed that the bio-filter was very effective to increase the voltage output of the monocrystalline and polycrystalline PV panel to >10%. Hence, the bio-filter was effective to screen the harmful spectra and allow the panel function at optimized state. The optimized state may include the application of state-of-the-art equipment for the synthesis of the bio-filter. Also, the biomass selection and component extraction should be well defined to maintain the red, orange or yellow extract. However, this research can still be improved in certain ways and as such, it is highly recommended that solar PV panel manufacturing companies should improve this experiment by making a sheet coated with the silver coated plant extracts to improve PV patronage in Africa.
Acknowledgements
The authors wish to appreciate Covenant University for partial sponsorship.
REFERENCES
Janos T., and Elza K. (2008). Study of interconnections of [1]
solar cell within a solar panel to tackle the shading problem. Physical review, 18(1): 127-134
Arnulf J. W., Fabio M. F., and Sándor S. (2015). Exploiting [2]
existing Dams for solar PV system installations. Journal of the American Astronomical Society, 7(9): 12340-12358
Hugo A., Tiago M., Antonio V., Diana G., Manuel J.M., and [3]
Schimidt A. (2015). Thin film silicon PV cell. Physical review, 5(9): 364-382
Brennan M. P.,Abramase A. L., Andrews R. W., and [4]
Pearce J. M. (2014). Effects of spectral albedo on solar
photovoltaic devices. International Journal and scientific and engineering research, 124: 111-116
J. Amankwah-Amoah, (2015), Solar energy in Sub-Saharan [5]
Africa: the challenges and opportunities of technological leapfrogging, Thunderbird Int Bus Rev, 57: 15-31
Yomi Kazeem, (2018), The biggest obstacle to deploying [6]
solar energy in Africa is skepticism in high places, https://qz.com/africa/1238545/the-biggest-obstacle-to-depl oying-solar-energy-in-africa-is-skepticism-in-high-places/ (Acessed 7th August, 2019).
Wang, A. (2013). The Search for Sustainable Legitimacy: [7]
Environmental Law and Bureaucracy in China. Harvard Environmental Law Review, 37: 365
Kostka, G., and W. Hobbs (2012). Local Energy Efficiency [8]
Policy Implementation in China: Bridging the Gap between National Priorities and Local Interests. The China Quarterly, 211: 765–785.
Emetere M. E., Okoro U., Etete B., and Okunbor G., (2016), [9]
Free energy option and its relevance to improve domestic energy demands in southern Nigeria, Energy Reports, 2, 229–236.
Emetere, M. E., and Akinyemi M. L., (2015) Weather Effect [10]
on Photovoltaic Module Adaptation in Coastal Areas, International Journal of Renewable Energy Research, 5(3), 821-825
Moses E. Emetere, Marvel L. Akinyemi, and Etimbuk B. [11]
Edeghe, (2016). A Simple Technique for Sustaining Solar Energy Production in Active Convective Coastal Regions, International Journal of Photoenergy 2016, 3567502, 1-11, http://dx.doi.org/10.1155/2016/3567502
Arnulf J. W., Fabio M. F., and Sándor S. (2015). Exploiting [12]
existing Dams for solar PV system installations. Journal of the American Astronomical Society, 7(9): 12340-12358
Daniela D., Gina B., Björn M., and Christian R. (2014). [13]
Impact of solar spectral irradiance on the yield of different PV technologies. Fraunhofer ISE, Fraunhofer Institute for Solar Energy Systems, Heidenhofstrasse, Germany, 132: 431-442
Huiye Q, Jianfei J, Ping Y, Tingge D, Jianyi Y, Hui Y, and [14]
filter, Department of Mechanical and Electrical Engineering, Longyan University, China, 41(11): 2450-2453
Brennan M. P.,Abramase A. L., Andrews R. W., and [15]
Pearce J. M. (2014). Effects of spectral albedo on solar photovoltaic devices. International Journal and scientific and engineering research, 124: 111-116
Evaldo C. G., Pedro M. S., and Teófilo M. S. (2017). [16]
Spectral Response of Polycrystalline Silicon Photovoltaic Cells under Real-Use Conditions, Renewable Energy Center, School of Engineering, São Paulo State University (UNESP),10(8): 1178-1190
Gouvêa, E. C., Sobrinho, P. M., & Souza, T. M. (2017). [17]
Spectral Response of Polycrystalline Silicon Photovoltaic Cells under Real-Use Conditions. Energies, 10(8), 1178.
M Emetere, S Sanni, O Dauda, A Akinsiku, O Osunlola, [18]