EVALUATE HORIZONTAL WELL PRODUCTION PERFORMANCE IN
HEAVY OIL RESERVOIRS
Hisham Kh. Ben Mahmud1, Ian H. Sheng2 and Mian U. Shafiq1 1Department of Petroleum Engineering, Curtin University, Sarawak, Malaysia
2Sarawak Shell Berhad, Miri, Sarawak, Malaysia E-Mail: [email protected]
ABSTRACT
Inconsiderable fraction of the hydrocarbon can be produced by the natural drive of the reservoir. Practical knowledge has proven that when the reservoir pressure is depleted, the recovery factor nearly reaches 20%. Some of heavy fluid reservoirs cannot be produced by all natural energy drivers. As a result, improved oil recovery is introduced as a strategy to increase oil recovery. Prior implementing an improved oil recovery process in a field, it is essential to investigate its potential for achievement. However, the objective of this project is to evaluate the improved oil recovery in a sandstone reservoir is considered in this study. GEM compositional reservoir simulator has been utilized, having injection and production wells. A model is developed to perform history matching with a field production data to verify the model results and to examine an improved oil recovery method on cumulative production and recovery factor. The results showed that the water flooding has insignificant impact on the cumulative oil production, while implementing horizontal production wells had improved and doubled the reservoir performance by a factor of 2 and reducing oil saturation from 80% to 30%.
Keywords: improved oil recovery, modeling, cumulative oil production, CMG, recovery factor, oil saturation.
INTRODUCTION
Improved oil recovery (IOR) is a method of oil extraction that assists in recovering additional oil from mature oil fields via implementing different technologies. The majority of reservoirs are subjected to various IOR processes following the primary recovery. The natural driving mechanism of the reservoir controls the ultimate recovery of petroleum during primary phase of production; such solution gas drive, gas-cap drive, liquid and rock compressibility drive, natural water influx, and combination of these drives. Primary oil recovery from reservoirs is affected by reservoir rock and fluid properties, and formation heterogeneities.
Techniques of improved oil recovery methods are classified to a couple of groups, which are secondary production and enhanced oil recovery (EOR) methods. Secondary production methods involve fluid injection, and they are targeted at providing further energy in order to increase the production level once well production rates decline during primary recovery. Such processes consist of water flooding and natural gas injection that can recover up to 20–60% of stock tank oil in place (STOIIP). Since a considerable amount of oil is left after primary and secondary production schemes, the ideal aim of EOR processes is to mobilize the “residual” oil capacity in the reservoir and reduce the operational expenditure, while maximizing the return on capital. This process can be attained by enhancing microscopic oil displacement and volumetric sweep efficiencies. Oil displacement efficiency can be augmented by reducing oil viscosity, capillary forces or interfacial tension with a particular flooding method. Processes here include all techniques, which utilize external sources of energy and/or materials to improve oil recovery that cannot be produced economically by conventional means; they are broadly classified as thermal (steam flooding, hot water flooding,
and in situ combustion) and non-thermal (chemical flood, miscible flood, and gas drive) Suman et al., 2014). Alternatively, enhanced oil recovery methods are called tertiary oil recovery processes, which can generate an additional of 35–75% STOIIP from the reservoir.
Therefore, EOR techniques have significantly increased in the last 20 years due to depleting reservoirs. It is a fact that approximately 70% of the oil and gas production in the world comes from the matured oil fields; therefore, this number indicates the potential for investments in EOR. Furthermore, the exploration rate of new fields has declined over the years due to several factors such as higher exploration cost, and drop oil price (Alvarado, 2010). Many studies are available into open literature, have been conducted to investigate the performance of various methods of IOR (Crawford, 1971; Taber, 1997; Mathiassen, 2003; Barillas et al., 2008; Meyer, 2009; Amao, 2009; Zakirov et al., 2012; Suman et al., 2013, Hasanvanda and Golparvar, 2014; Cavanagh and Ringrose, 2014).
The objective of this paper is to evaluate the additional oil recovery in which recovery processes considered include water injection and drilling horizontal and vertical wells in a depleted sandstone oil reservoir in which a reservoir model (GEM) was developed using history matching with field production data in order to verify the model results. It is effective for modelling any type of reservoir where the importance of the fluid composition and their interactions are essential to the understanding of the recovery process. The study will not explain the effect of reducing CO2 emission and
METHODOLGY
Description of the reservoir model
[image:2.612.317.539.110.386.2] [image:2.612.76.294.234.371.2]In this paper, a compositional simulation model was built using CMG GEM module (Version 2009.11, Computer Modelling Group Limited). The reservoir simulation model was 3-Dimensional (3D) with a real field production history. The reservoir model consists of 3,500 grids, with grid blocks of 25 × 35 × 4 and corresponding dimensions of 9022 × 14354 × 587 ft. Figure-1 displays the reservoir model used in this study in 3D.
Figure-1. 3-D grid model of an oil field with production and injection wells.
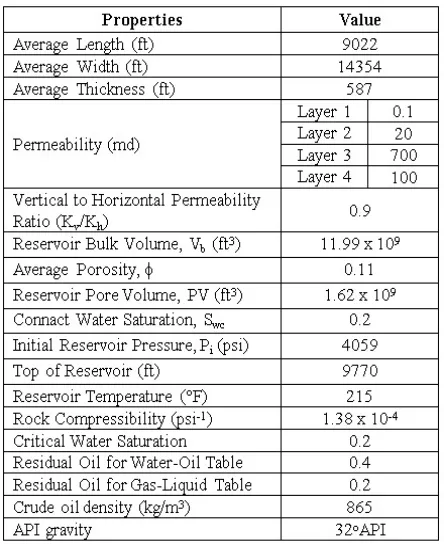
[image:2.612.314.538.571.716.2]The reservoir model is assumed to have homogeneous porosity and permeability in all directions where the average porosity is calculated to be 11% but each layer has its permeability value. The producer wells were positioned at the middle and right grid blocks as shown in Figure-1where the injector well was allocated at various locations to investigate its effect. The available data for the crude oil includes its composition, density, and viscosity are presented in Table-1. The PVT model was constructed using CMG Winprop module (Version 2009.11) and tuned based on the available information. The model temperature in all the simulation runs was selected to be constant at 215°F. The general properties of the simulation model are presented in Table-2.
Table 1. The composition of reservoir fluid.
Table 2. Reservoir model and fluid properties.
The aquifer layer is implemented underneath the oil layer using data related to the aquifer system into GEM simulator. This statement has supported by the high water cut of 40% at the initial production period of nine months as shown in (Figure-2). Also it can be seen that the water cut reaches almost 80% in 1998, which indicates the reservoir is supported by a strong water layer, therefore; this reservoir is classified as water drive mechanism where an additional material balance calculation is done to confirm the theory (refer to Appendix A). Moreover, no flow boundary conditions were assumed at the boundaries surrounding the reservoir in which reservoir edges could also be considered as a constant pressure boundary, however; there is no information along the boundaries of the reservoir.
History matching
A history matching run was used to verify simulation data with the field data. The oil rate and cumulative water production data were matched simultaneously on two production wells named Well 2 and 8 using the oil rate as a controlling parameter. Figure-3 and 4 display the final results of history matching for the simulated monthly oil and water production rate well data. The oil water relative permeability data was obtained at the end of the history matching study by a trial and error process. No liquid and gas relative permeability data were present. Thus, a gas relative permeability curve was generated by CMG’s GEM corresponding relative permea-bility generation tool. The relative permeapermea-bility curves of gas and water incorporated in the simulation model are shown in (Figure-5). It was assumed that the curves are the same for drainage and imbibitions. The capillary pressure among the oil and water was neglected for this study.
Figure-3. Water production history matching.
Figure-4. Oil production history matching.
Improved oil recovery (IOR) method
In this study, the reservoir was simulated to be depleted naturally. In the normal scenario, when the reservoir is unable to produce by the natural energy, water flooding is introduced to recover the oil, till the producer well is shut-in at the economic constraint. However, the condition of this reservoir is different from the usual case due to the presence of a strong water aquifer, which is characterized as water drive reservoir. Hence, the reservoir pressure is maintained by the aquifer and water injection would not have significant impact on the oil production.
As seen in (Figure-6), the water injection has not improved significantly the reservoir performance due to aquifer presence. On the other hand, the oil saturation in the reservoir is still remaining at high level after ten years of production as shown in (Figure-8a) due to the presence of heavy oil fluid. The consequence of heavy oil properties, it prevents the flow of oil towards the production wells. Therefore, the reservoir is still at the state of initial oil saturation conditions of 80%. Moreover, the oil saturation seen only decreasing around the vertical production wells, while the production from the reservoir boundary is not withdrawn towards existing production wells. Therefore, in order to improve the oil recovery in the secondary stage, two horizontal wells were drilled to increase the contact area with the reservoir in order to maximise the production.
the drilling to take place. The location of two horizontal wells is shown in (Figure-8b). The injector and horizontal wells were drilled in the layer 2 instead of other layers due to the high permeability ratio (Kv/Kh) of 0.9 and all
reservoir layers are in communication with each other. Therefore, the oil from layer 4 is able to flow into the horizontal wells with the aid of gravity forces. However, layer 1 was not chosen due to the low permeability ratio of 0.1 md, which indicates a shale formation.
Figure-5. Relative permeability of (a) oil-gas system and (b) oil-water system.
The result of drilling two horizontal wells shows a significant impact on the oil production where the oil recovery increased to 35% as presented in (Figure-7). Hence, the production was doubled the existing recovery of 18% due to the additional horizontal wells. From (Figure-6), the cumulative oil of 27 MMbbl was achieved at 2006 where the horizontal wells were drilled, while the profit of the oil recovery is equivalent to $1.35 billion US dollar if the oil price is $50 dollar per barrel.
Therefore, the drilling cost of two horizontal wells will be covered, and a high profit can be obtained. After two horizontal wells were drilled, the oil saturation is reduced to between 30–50% as shown in (Figure 8-b). Therefore, as the reservoir approaches the tail of natural
drive production and the remaining saturations have to be produced using EOR method.
Figure-6. Cumulative oil using improved oil recovery approaches.
Figure-7. Oil recovery factor using improved oil recovery approaches.
Figure-8. Oil Saturations: (a) after nine months of production and (b)after two horizontal wells drilled.
CONCLUSIONS
simulation results with the field data. From this research work, the following conclusions were drawn:
The water-injection method demonstrates that it is not preferable technique for such kind of reservoir.
When horizontal production wells were drilled, they show a significant impact on the oil recovers where it becomes double.
A Sensitivity study should be performed in the future to evaluate further petroleum recovery using a tertiary technique since the oil has been produced naturally and using waterflooding.
ACKNOWLEDGEMENTS
The authors would like to acknowledge Computer Modelling Group Ltd Company for allowing us using CMG Software, which is donated for this study.
NOMENCLATURE
REFERENCES
[1] Ahmed, T. P. (2005). Advanced Reservoir Engineering. Oxford, UK: Elsevier Inc.
[2] Alvarado, V. a. (2010). Enhanced Oil Recovery: An Update Review. Energies Journal , 47.
[3] Amao, A. M. (2009). Permian Basin: Historical Review of CO2 EOR Processes, Current Challenges
and Improved Optimization Possibilities. Internation Symposium of the Society of Core Analysts , 6.
[4] Mathiassen, O. M. (2003). CO2 as Injection Gas for
Enhanced Oil Recovery and Estimation of the Potential on the Norwegian Continental Shelf. Norwegin: Norwegian University of Science and Technology.
[5] Meyer, J. P. (2009). Summary of Carbon Dioxide Enhanced Oil Recovery (CO2EOR) Injection Well
Technology. Texas: American Petroleum Institute.
[6] Taber, J. (1997). EOR Screening Criteria Revisited-Part 1: Introduction to Screening Criteria and Enhanced Recovery Field Projects. Mexico: New Mexico Petroleum Recovery Research Center.
[7] Zakirov, I. I.-B. (2012). Water Injection Patterns Optimization Approach on High-Viscous Oil in Russkoye Field. Society of Petroleum Engineers , 13.
[8] Suman, Y. K.-K. (2013). Investigating Improved Oil Recovery in Heavy Oil Reservoirs. World Journal of Engineering and Technology , 9.
[9] Paul B. Crawford (1971). A Review of Many Improved Oil Recovery Methods. Journal of the Japanese Association for Petroleum Technology.
[10]Barillas, J. L. M.; Dutra JR., T. V.; Mata, W. “Improved Oil Recovery Process For Heavy Oil: A Review”. Brazilian Journal of Petroleum and Gas. v. 2, n. 1, p. 45-54, 2008. Vol. 36 (1971) No. 1 P 28-39.
[11]Yogesh Kumar Suman, Ezeddin Shirif, Hussameldin Ibrahim, Abdulsalam Ala-Ktiwi (2014). World Journal of Engineering and Technology, 2014, 2, 23-31.
[12]Andrew Cavanagh and Philip Ringrose (2014). Improving oil recovery and enabling CCS: a comparison of offshore gas-recycling in Europe to CCUS in North America. Energy Procedia 63 ( 2014 ) 7677 – 7684.