Munich Personal RePEc Archive
A comparison of screening mechanisms
for identifying potentially
anticompetitive accountable care
organizations
Pelnar, Gregory
29 July 2011
A Comparison of Screening Mechanisms for Identifying Potentially Anticompetitive Accountable Care Organizations
Gregory J. Pelnar
Compass Lexecon
Abstract: The FTC and DOJ’s Proposed Statement of Antitrust Enforcement Policy Regarding Accountable Care Organizations Participating in the Medicare Shared Savings Program explains how the antitrust agencies will screen accountable care
organizations (ACOs) to identify ones that are potentially anticompetitive and therefore require further review. In contrast to the antitrust screens the agencies have set forth in earlier Statements or Guidelines which are based on market shares
in relevant markets, the Proposed Statement introduces a screen based on market
shares in Primary Service Areas (PSAs). By examining several numerical examples, the proposed ACO screen is compared to some alternatives, including the review thresholds set forth in the 2010 Horizontal Merger Guidelines. The results indicate
areas’ (PSAs) based on an alg
t important
Be careful what you ask for. That is a warning that health care providers may have, in retrospect, wished they had heeded. They sought clarity – preferably blank check antitrust immunity – from the Federal Trade Commission (FTC) and the U.S. Department of Justice Antitrust Division (DOJ) in setting up provider networks called accountable care organizations (ACOs) to participate in Medicare’s Shared Saving Program. Instead, they got the FTC and DOJ’s Proposed Statement of Antitrust Enforcement Policy Regarding Accountable Care Organizations Participating in the Medicare Shared Savings Program (“Proposed Statement”).1
The antitrust agencies could have simply pointed to pre‐existing guidance: their 1996 Statements of Antitrust Enforcement Policy in Health Care2, their 2000
Antitrust Guidelines for Collaborations Among Competitors3, and their 2010
Horizontal Merger Guidelines.4 They could have simply re‐iterated the need for
financial or clinical integration, the ancillarity of joint negotiations with payers, the need for pro‐competitive benefits, the antitrust safety zones based on market share in the relevant market, and so on. Much of the pre‐existing guidance was based on years of careful economic thinking about the issue at hand.
Providers argued there was too much ambiguity as to how the antitrust laws would be applied to the ACOs formed in response to provisions of the 2010
Affordable Care Act. Some providers went so far as to assert that the antitrust laws stood in the way of ACO formation and frustrated the objective of health care
reform. They wanted the antitrust agencies to stand aside; any ACO approved by the Centers for Medicare and Medicaid Services (CMS) to participate in its Shared
Savings Program should not be challenged by the antitrust agencies.
The FTC and DOJ, to their credit, were concerned. They were worried about ACOs that could be little more than cartels. They were worried about the creation of market power via ACO formation. And they were worried about antitrust
conspiracies among ACO members concerning their non‐ACO activities. Their answer was the Proposed Statement.
At least for the purposes of screening ACOs to identify those that warrant closer scrutiny by the antitrust authorities, out went the delineation of the relevant market based on sound economic reasoning, such as the availability of substitutes and the hypothetical monopolist test.5 In came the delineation of ‘primary service
orithm that ignores virtually everything that economic for an analysis of market power.
heory suggests is
1 FTC & DOJ, Proposed Statement of Antitrust Enforcement Policy Regarding
A Organizations Participating in the Medicare Shared S eral Register, vol. 76, no. 75 (April 19, 2011), pp. 21894‐
ccountable Care avings
Program, Fed 902.
2 DOJ & FTC, Statements of Antitrust Enforcement Policy in Health Care (August
1
Antitrust Gui ).
996).
3 FTC & DOJ, delines for Collaborations Among Competitors (April 2000 4 DOJ & FTC, Horizontal Merger Guidelines (August 19, 2010).
5 The Proposed Guidelines explain the screening mechanism to be used to identify
contiguous postal zip codes f percent of its [p ient
The purpose of this study is to explore how the screening of potentially anticompetitive ACOs under the Proposed Statement’s PSA Approach compares with
the results obtained by applying the screens set forth in the antitrust agencies’ arlier uidance.
e
g
I. Comparison of ACO Antitrust Treatment as Set Forth in the Proposed Statement and under the Statements of Antitrust Enforcement Policy in Health Care and the Antitrust Guidelines for Collaborations Among Competitors
Before the 2011 Proposed Statement, health care providers wondering where
the antitrust safety zone is could consult the FTC and DOJ’s 2000 Antitrust Guidelines for Collaborations Among Competitors (“Collaborations”) and find that, “[a]bsent
extraordinary circumstances, the Agencies do not challenge a competitor collaboration when the market shares of the collaboration and its participants
collecti elevant market in
which cvely account for ompetition may be affected.”no more than6 twenty percent of each r
They could also go back further and consult the 1996 Statements of Antitrust Enforcement Policy in Health Care (“1996 Statements”) and find that the antitrust
agencies “will not challenge, absent extraordinary circumstances, an exclusive
physician network joint venture whose physician participants share substantial financial risk and constitute 20 percent or less of the physicians in each physician
specialty with active hospital staff privileges who practice in the relevant geographic market” and that “[g]enerally, relevant geographic markets for the delivery of
physician services are local.”7 They would also find that the agencies “will not
challenge, absent extraordinary circumstances, a nonexclusive physician network
joint venture whose physician participants share substantial financial risk and
constitute 30 percent or less of the physicians in each physician specialty with active
hospital staff privileges who practice in the relevant geographic market.”8 While they
would find no antitrust safety zone for multiprovider networks comprised of different types of health care providers, such as physician‐hospital organizations, they would find an explanation of how to define the relevant market to carry out a rule of reason analysis.
Now they learn that, “[f]or an ACO to fall within the safety zone, independent ACO participants (e.g., physician group practices) that provide the same service (a
“common service”) must have a combined share of 30 percent or less of each common service in each participant’s PSA, wherever two or more ACO participants provide that service to patients from that PSA”, where the PSA is defined as “the lowest number of
rom which the [ACO participant] draws at least 75 at s]” for that service.9
6 p. 26 (emphasis added).
19 phasis added).
Collaborations, supra note 3,
7 96 Statements, supra no
Id., p. 65 (emphasis dded)
te 2, pp. 64‐65 (em
8 a .
relevant geographic market?
The familiar (albeit often contentious) “relevant market” has been replaced by the “primary service area”, which as the Proposed Statement explains “does not
necessarily constitute a relevant antitrust geographic market” but “nonetheless provides a useful tool for evaluating potential competitive effects”, and by “an ACO’s shares of services (i.e., physician specialties, major diagnostic categories (“MDCs”)
for inpatient facilities, and outpatient categories for outpatient facilities) in the relevant PSAs” even though “these services do not necessarily constitute relevant antitrust product markets” but “nonetheless provide a useful tool for evaluating potential competitive effects.”10 In other words, in place of an antitrust safety zone
market share threshold based on the familiar ‘relevant product market’ and
‘relevant geographic market’ there was now one based on health care codes that do not necessarily delineate relevant product markets and geographic areas that do not necessarily delineate relevant geographic markets.
The virtue of the Proposed Statement’s safety zone is that, given the same
data on where each provider draws patients for each service, everyone should get the same answer. This is in marked contrast to questions about relevant markets, where even the most reasonable of people may disagree. Ambiguity as to where economic logic dictates the lines of the relevant market should be drawn has been replaced with precision as to where the lines should be drawn irrespective of economic logic.
But is the safety zone set forth in the Proposed Statement broader or
narrower than the safety zones set forth in earlier guidance? First consider the 1996 Statements. The safety zones have three basic components: (1) a financial
integration requirement, and (2) a market share threshold that is a function of (3) whether the arrangement is exclusive or non‐exclusive. The financial integration requirement may be satisfied by the very fact that the ACO will participate in the Medicare Shared Savings Program, thereby giving each of the ACO’s members a financial interest in the ACO’s success. The Proposed Statements also require certain
types of ACO participants, such as hospitals, to only do so on a non‐exclusive basis, but otherwise does not condition the market share threshold on whether ACO participation is on an exclusive or non‐exclusive basis. The Proposed Statement puts
the safety zone threshold at 30% PSA market share, while the 1996 Statements put it
at a market share of either 20% or 30% of the relevant market. One may be tempted to thus conclude that the safety zones specified in the two documents are not so different.
Does the Proposed Statement set forth a safety zone which is more, less, or
equally strict as the Collaborations? If an ACO’s PSA is its relevant geographic
market and assuming the service in question constitutes the relevant product
market, then the former’s 30% threshold exceeds the latter’s 20% threshold, so that the Proposed Statement sets forth a broader safety zone than the Collaborations.
However, what if we retain the assumption that the service in question is the relevant product market and now assume an ACO’s PSA is not necessarily its
Once again, one may be tempted to conclude that the
Propose
in the C
d Statement sets forth a safety zone that is at least as broad as that set forth ollaborations.
fact, neither conclusion is warranted, as some simple examples illustrate. In
xample 1:
E
Zip code
1 2 3 4
Provider J’s Medicare revenue for service s(dollars) 40 35 15 10
Medicare revenue for servic es to all providers (dollars) 100 100 100 100
Provider J’s PSA for service s consists of zi codes 1 &2p . 11
Provider J’s PSA market share for service s = 37.5%.12
If the PSA is the relevant market (RM), then J’s RM market share for service s= 37.5%.13
If, instead, RM is the union of the PSA and zip code 3, then J’s RM market share for service s = 30%.14
Consider a provider that provides a particular service in four zip codes (see Example 1). The provider receives $40 from its Medicare patients in zip code 1, $35 from those in zip code 2, $15 from those in zip code 3, and $10 from those in zip code 4. The provider’s PSA consists of zip codes 1 and 2, since 75% of its revenue for that service comes from those two zip codes. The provider’s market share in its PSA depends on the total Medicare revenue for service s in J’s PSA. Example 1 assumes
$100 of Medicare revenue for each zip code. Therefore, J’s PSA market share is 37.5%.
How does this PSA market share compare to the market share for the
relevant market? It all depends on what the relevant market is. The relevant market determination depends on numerous factors, such as the willingness of patients to switch providers. To keep the examples simple, I simply assume the relevant market is the PSA plus one or more additional zip codes. In Example 1, the relevant market is assumed to be zip codes 1, 2, and 3, so J’s market share in the relevant market is 30%. Thus, in Example 1, J’s PSA market share is greater than its market share in the relevant market. This suggests that the Proposed Statement’s PSA approach
overstates market shares in the relevant market and therefore results in a narrower safety zone. Is this result true in general? No.
In fact, J’s PSA market share may be greater or less than its RM market share. Example 2 is an example where it is less. The only difference between Examples 1 and 2 is that Medicare revenue for service s to all providers for zip code 3 is 20
nstead of 100. Now J’s RM market share is 40.9%, while its PSA market share is
i
37.5%.
11 The PSA is defined as the fewest number of contiguous zip codes that account for
at 5, which
0 + 35). least 75% of the provider’s revenue. So 75% of (40+35+15+10) is 7
equals the sum of the provider’s revenue from zip codes 1 and 2 (i.e., 4
12 Provider J’s PSA market share = 100*(40+35)/(100+100) = 37.5%. 13 Id.
Example 2:
Zip code
1 2 3 4
Provider J’s Medicare revenue for service s(dollars) 40 35 15 10
Medicare revenue for servic es to all providers (dollars) 100 100 20 100
Provider J’s PSA for service s consists of zi codes 1 &2p . 15
Provider J’s PSA market share for service s = 37.5%.16
If PSA is the relevant market (RM), then J’s RM market share for service s = 37.5%.17
If instead RM is the union of the PSA and zip code 3, then J’s RM market share for service s = 40.9%.18
E
xamples 1 and 2 lead to the following proposition:
Proposition 1: A provider’s PSA market share may either overstate or understate its arket
m share in its relevant market. 19
The implication of Proposition 1 is that, except in special cases, one cannot RM conclude that the PSA market share systematically overstates or understates the market share.
The PSA Approach also produces market shares that behave in ways that hinder the drawing of inferences about market power. Holding a provider’s PSA Medicare revenue constant, increasing its Medicare revenue in an adjacent zip code may cause the provider’s PSA market share to fall. In other words, increasing a provider’s revenue can cause its PSA market share to decline. This seems
counterintuitive because larger providers would be expected to have larger market shares. Yet, under the PSA Approach, this is not necessarily the case because
increasing the provider’s revenue may expand its PSA. This point is illustrated in Example 3.
15 eTh calculation is the same as in Example 1. Supra note 11. 16 The calculation is the same as in Example 1. Supra note 12. 17 Id.
18 Provider J’s RM market share = 100*(40+35+15)/(100+100+20)=40.9%. 19 There are special cases where the direction of the bias can be determined. For
example, if Medicare revenue to all providers for service s is the same for each zip
code, then the PSA market share must be greater than or equal to the RM market share due to the way the PSA is constructed (i.e., by summing a non‐increasing
Example 3
Zip code PSA20
(zip codes)
J’s PSA M
Sharearket Provider J’s Medicare revenue for service s
(dollars): 1 2 3 4 5
Scenario I 60 3 2 1 1 1 60.0%
Scenario II 60 30 2 1 1 1,2 45.0%
Scenario III 60 30 30 1 1 1,2,3 40.0%
Scenario IV 60 30 30 30 1 1,2,3 40.0%
Scenario V 60 30 30 30 30 1,2,3,4 37.5%
Medicare revenue for service s to all
rovider
p s (dollars) (all scenarios) 100 100 100 100 100
Notice that in each subsequent scenario, Provider J’s Medicare revenue from service s is much higher in the adjacent zip code than in the previous scenario. One
may suspect that if all zip codes are of equal size (in terms of total Medicare revenue for service s to all providers), then J’s market share will increase in each subsequent
cenario. In fact, however, the PSA market share does exactly the opposite. It falls. xample 3 leads to the following proposition.
s E
Proposition 2: A provider’s PSA market share can decline as it generates more and jacent zip co
more revenue in ad des.
The Proposed Statement sets forth thresholds for safety zones and mandatory
review based on PSA market shares. However, when applied to Provider J in Example 3, some peculiar results emerge.
First, notice that in Scenario I, Provider J appears to be able to attract only those patients who are unwilling to travel even one zip code away to receive service s. In contrast, in Scenario V, Provider J draws exactly the same patients in zip code 1 but also draws a significant number of patients from each of the other zip codes as well. Yet, if any other provider K attempts to form an ACO with Provider J in
Scenario I, the ACO will be subject to mandatory review (if K receives any Medicare revenue for service s in zip code 1 since the ACO’s market share in J’s PSA will
exceed 50%) or the dominant provider limitation21 (if K does not receive any
Medicare revenue for service s in zip code 1). Yet, suppose K earns $2 in Medicare
revenue for service s in each of the five zip codes. Then K can form an ACO with J in
neither mandatory review (since the ACO’s market Scenario V and be subject to
20 For an explanation of how PSAs are determined, see supra note 11.
21 As set forth in the Proposed Statement, the dominant provider limitation “applies
to any ACO that includes a participant with a greater than 50 percent share in its PSA of any service that no other ACO participant provides to patients in that PSA.” A ‘dominant provider’ “must be non‐exclusive to the ACO to fall within the safety zone.” In addition, “to fall within the safety zone, an ACO with a dominant provider cannot require a commercial payer to contract exclusively with the ACO or
In other words, if potential A
H
share in J’s PSA will be 39.5% and thus fall below the 50% threshold) nor the
dominant provider limitation (since K and J provide service s in each other’s PSA).22
In other words, in at least some cases, the Proposed Statements would screen ACOs
involving Provider J in Scenario I as of more antitrust concern than the same ACOs involving Provider J in Scenario V. Yet, it would seem that the latter should raise more antitrust concerns.
The implication is that the Proposed Statement’s PSA Approach may flag
ACOs involving providers who draw their patients from very small geographic areas as requiring more antitrust scrutiny than providers who draw the same number of patients from those areas but also draw a considerable number of patients from
ther areas as well. In other words, simple examples suggest that the PSA Approach ay screen out for further scrutiny the ‘wrong’ ACOs.
o m
II. Comparison of ACO Antitrust Treatment as Set Forth in the Proposed ent and under the Horizontal Me
Statem rger Guidelines
The 2010 Horizontal Merger Guidelines (HMG) describe a merger review
process that takes into account both the industry’s post‐merger concentration, as quantified by the Herfindahl‐Hirschman Index (HHI), and the change in
concentration due to the merger, as quantified by the difference between the pre‐ and post‐merger HHIs. Based on these two variables, a merger is classified into one of three categories: (1) unlikely to raise competitive concerns23, (2) potentially
aises c nces market power. 5
r ompetitive concerns24, and (3) presumptively enha 2
This will be referred to below as the “HMG Approach.”
If the antitrust treatment of ACOs as set forth in the Proposed Statement
approximates the antitrust treatment of horizontal mergers under the Horizontal Merger Guidelines, then one may expect the PSA Approach to signal safety zone
treatment in those cases where the HMG Approach signals ‘unlikely to raise
competitive concerns’, to signal mandatory review when the HMG Approach signals
a presumption of enhancement of market power, and to signal an intermediate level of review when the HMG Approach signals ‘potentially raises competitive concerns.’
COs are classified by both the PSA Approach and the a table such as Table 1, then the entries should all
MG Approach and recorded on
22 The same is true for K’s PSA.
23 A merger is unlikely to raise competitive concerns if either of the following
conditions hold: (1) the increase in HHI is less than 100 points, or (2) the post‐ merger HHI is below 1500 (i.e., the market remains unconcentrated even after the merger).
24 A merger potentially raises competitive concerns if either of the following
conditions hold: (1) the post‐merger HHI is in the 1500‐2500 range and the increase in HHI exceeds 100 points, or (2) the post‐merger HHI exceeds 2500 and the
increase in HHI is in the 100‐200 range.
25 A merger warrants a presumption of enhancement of market power if the post‐
lie on the diagonal if the two approaches generate similar implications. On the other hand, if most of the entries are in the upper right (lower left) then the PSA Approach
ould appear to be more lax (stringent) in its antitrust treatment than the HMG
ch. w
Approa
able 1 T
Horizontal Merge
r Guidelines
ACO Guidelines Unlikely to raise competitive concerns Potentially raises competitive concerns Warrants presumption of enhancement of market power
Safety zone Similar treatment ACO Guidelines m
lax ore ACO Guidelines much mo re lax Intermediate ACO Guidelines more
stringent
Similar treatment ACO Guidelines more lax
Mandatory review ACO Guidelines much ACO Guidelines more Similar treatment more stringent stringent
Do the two approaches yield entries that lie along the diagonal? Once again, a few examples are sufficient to demonstrate that the PSA Approach and HMG
Approach produce similar implications in some scenarios, whereas in others the PSA Approach is more lax, and in still others it is more stringent.26 To simplify the
discussion, I consider only ACOs whose members are not subject to the Proposed Statement’s non‐exclusivity requirements.
First, consider three providers X, Y, Z who supply service s and that have the
same PSA. Suppose their respective PSA market shares for service s are 51%, 48.5%,
and 0.5%. Now suppose X and Z want to form an ACO. The ACO’s market share in the PSA will be 51.5%, and therefore the ACO will be subject to mandatory review. However, using the HMG Approach, the increase in HHI will be only 51 points, and
therefore a merger of X and Z would be unlikely to raise competitive concerns.27
Thus, this is an example where the ACO treatment under the Proposed Statement is
stricter than the treatment under the Horizontal Merger Guidelines.
26 For another comparison of the antitrust treatment of ACOs under the Proposed
Statement and the Horizontal Merger Guidelines, see Tasneem Chipty, “Competitor
Collaborations in Health Care: Understanding the Proposed ACO Antitrust Review Process,” CPI Antitrust Chronicle, May 2011 (1). Chipty assumes that the relevant
market is the same as the PSA and concludes: “For relatively unconcentrated
markets, whether the ACO review process is more stringent than the merger review process depends on how restrictive the non‐exclusivity requirement on hospitals and ambulatory surgical centers are to the ACO participants. If they are not binding, the numerical simulations suggest that the ACO review process is no more stringent than the merger review process for relatively unconcen rated markets and less t stringent in relatively more concentrated markets.” (p. 6)
27 The change in HHI is (51 + 0.5)2 + 48.52 – (512 + 48.52 +0.52) = 51, and thus falls
At the opposite extreme would be an ACO that qualifies for the Proposed Statement’s safety zone, even though under the HMG Approach a merger would
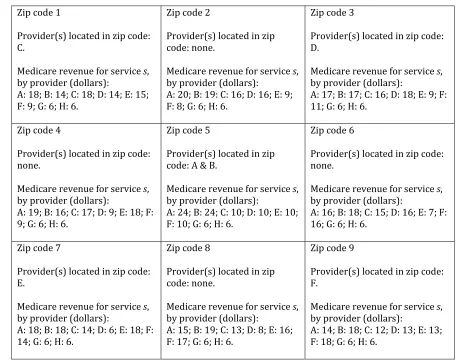
arrant the presumption of an enhancement of market power. An example of such CDEF in Example 4. w an ACO is Example 4 Zip code 1 rovider(s) located in zip code: P C.
Medicare revenue for service s,
y provider (dollars): : 72; B: 5; C: 20; D: 1; E: 1; F: 1. b A Zip code 2 rovider(s) located in zip P code: none. , Medicare revenue for service s by provider (dollars): A: 73; B: 15: C: 5; D: 5; E: 1; F: 1. Zip code 3 rovider(s) located in zip code: P D.
Medicare revenue for service s,
by provider (dollars): : 33; B: 34; C: 1; D: 30; E: 1; F: A 1. Zip code 4 rovider(s) located in zip code: P none.
Medicare revenue for service s,
y provider (dollars): : 73; B: 10; C: 7; D: 1; E: 8; F: 1. b A Zip code 5 rovider(s) located in zip P code: A & B. , Medicare revenue for service s by provider (dollars): : 45; B: 45; C: 2; D: 3; E: 3; F: A 2. Zip code 6 rovider(s) located in zip code: P none.
Medicare revenue for service s,
by provider (dollars): A: 10; B: 73; C: 1; D: 8; E: 1; F: 7. Zip code 7 rovider(s) located in zip code: P E.
Medicare revenue for service s,
by provider (dollars): : 34; B: 33; C: 1; D: 1; E: 30; F: . A 1 Zip code 8 rovider(s) located in zip P code: none. , Medicare revenue for service s by provider (dollars): A: 15; B: 73; C: 1; D: 1; E: 5; F: 5. Zip code 9 rovider(s) located in zip code: P F.
Medicare revenue for service s,
by provider (dollars):
A: 5; B: 72; C: 1; D: 1; E: 1; F: 20.
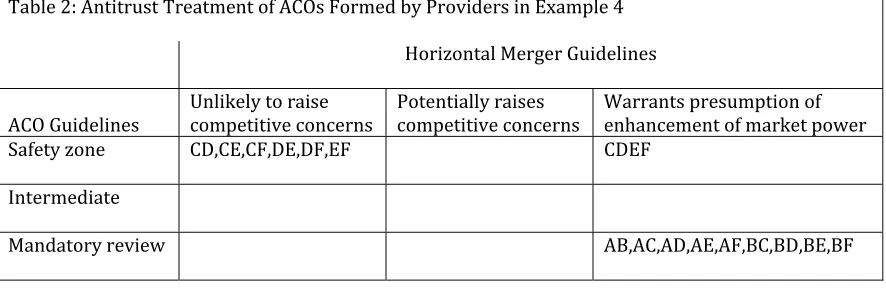
Suppose Providers A, B, C, D, E, and F provide service s in nine zip codes in
the Medicare amounts listed.28 Notice that each provider generates its greatest
Table 2 summarizes the antitrust treatment of all 15 possible two‐provider ACOs.29 Note that all two‐provider ACOs fall along the diagonal. In other words, the
two‐provider ACOs that qualify for the Proposed Statement’s safety zone also would
be deemed unlikely to raise competitive concerns under the HMG Approach,
whereas the ones that require mandatory review under the Proposed Statement are
also the ones that the HMG Approach identifies as warranting the presumption that
merger would enhance market power. Notice that all the two‐provider ACOs that
ment’s safety zone.
a
do not involve Providers A or B qualify for the Proposed State
able 2: Antitrust Treatment of ACOs Formed b
T
y Providers in Example 4
Horizontal Merge
r Guidelines
ACO Guidelines Unlikely to raise competitive concerns Potentially raises competitive concerns Warrants preenhancement of market power sumption of
Safety zone CD,CE,CF,DE,DF,EF C
DEF Intermediate
M
andatory review AB,AC,AD,AE,AF,BC,BD,BE,BF
On the other hand, an ACO formed with all four regional providers C, D, E, and F also would qualify for the Proposed Statement’s safety zone since that ACO’s
market share in each of the four PSAs (one for each ACO participant) would be less than 30%. However, under the HMG Approach, the post‐ACO PSAs would be highly
concentrated and two would have HHI increases of more than 200 points, thereby classifying ACO CDEF as warranting the presumption of an enhancement in market power.
Example 5 illustrates a scenario in which six providers, A through F, provide service s in nine zip codes, and two other providers, G and H, also provide the
service in the nine zip codes but operate in others as well (and therefore the PSAs of G and H are left unspecified). 30 The PSA of each provider A through F has a pre‐ACO
HHI of less than 1500, and thus is unconcentrated.31 However, any two‐provider
ACO comprised of providers A through F results in a post‐ACO HHI of more than 1500 (but less than 2500) so that the post‐ACO market is relatively concentrated.
29 The HHIs are calculated assuming that each provider’s PSA is the relevant market.
However, the qualitative results do not change if, instead, the relevant market for all providers is assumed to consist of all nine zip codes.
30 Since the PSAs of providers G and H are left unspecified, the example does not
consider ACOs that involve G or H.
31 This conclusion also holds if the relevant market for Providers A through F is
[image:13.612.86.529.202.347.2]Notice that the PSAs in Example 5 include more zip codes than the PSAs in Example 32 4. Example 5 Zip code 1 rovider(s) located in zip code: P C.
Medicare revenue for service s,
by provider (dollars): : 18; B: 14; C: 18; D: 14; E: 15; : 6. A F: 9; G: 6; H Zip code 2 rovider(s) located in zip P code: none. , Medicare revenue for service s by provider (dollars): A: 20; B: 19: C: 16; D: 16; E: 9; : 6. F: 8; G: 6; H Zip code 3 rovider(s) located in zip code: P D.
Medicare revenue for service s,
by provider (dollars): A: 17; B: 17; C: 16; D: 18; E: 9; F: : 6. 11; G: 6; H Zip code 4 rovider(s) located in zip code: P none.
Medicare revenue for service s,
by provider (dollars): : 19; B: 16; C: 17; D: 9; E: 18; F: . A 9; G: 6; H: 6 Zip code 5 rovider(s) located in zip P code: A & B.
Medicare revenue for service s,
by provider (dollars): : 24; B: 24; C: 10; D: 10; E: 10; H: 6. A F: 10; G: 6; Zip code 6 rovider(s) located in zip code: P none.
Medicare revenue for service s,
by provider (dollars): A: 16; B: 18; C: 15; D: 16; E: 7; F: : 6. 16; G: 6; H Zip code 7 rovider(s) located in zip code: P E.
Medicare revenue for service s,
by provider (dollars): : 18; B: 18; C: 14; D: 6; E: 18; F: 4; G: 6; H: 6. A 1 Zip code 8 rovider(s) located in zip P code: none. , Medicare revenue for service s by provider (dollars): A: 15; B: 19; C: 13; D: 8; E: 16; F: 17; G: 6; H: 6. Zip code 9 rovider(s) located in zip code: P F.
Medicare revenue for service s,
[image:14.612.73.530.132.492.2]by provider (dollars): A: 14; B: 18; C: 12; D: 13; E: 13; F: 18; G: 6; H: 6. Table 3 summarizes the antitrust treatment of ACOs formed by the providers in Example 5. The increase in HHI in each of the ACO participants’ PSA exceeds 100 points, so the ACO potentially raises competitive concerns under the HMG
Approach.33 On the other hand, the six two‐provider ACOs that do not include
providers A or B all qualify for the Proposed Statement’s safety zone, and all the ones
that do include A or B do not (but they also do not meet the mandatory review mple 5 illustrates a scenario where the PSA Approach requirement). Therefore, Exa 32 A’s PSA consists of zip codes 1, 2, 3, 4, 5, 6, and 7; B’s PSA consists of zip codes 2, 3, 5, 6, 7, 8, and 9; C’s PSA consists of zip codes 1, 2, 3, 4, 6, 7, and 8; D’s PSA consists of zip codes 1, 2, 3, 5, 6, and 9; E’s PSA consists of zip codes 1, 4, 5, 7, 8, and 9; and F’s PSA consists of zip codes 3, 5, 6, 7, 8, and 9.
33 This conclusion also holds if the relevant market for Providers A through F is
yields a more refined categorization of the anti‐competitive potential of certain potential ACOs relative to the HMG Approach.
able 3: Antitrust Treatment of ACOs Formed
T
by Providers in Example 5
Horizontal Merger Guidelines
ACO Guidelines
Unlikely to raise ompetitive oncerns c
c Potentially raises competitive concerns
Warrants presumption of enhancement of market power
Safety zone
CD,CE,CF,DE,DF,EF
Intermediat
e AB,AC,AD,AE,AF,BC,BD,BE,BF
Mandatory eview r
III. Conclusion
The Proposed Statement replaces the familiar, but often contentious,
“relevant market” with the “primary service area.” Yet, the PSA, according to the
Proposed Statement, “does not constitute a relevant antitrust geographic market” –
but “nonetheless provides a useful tool for evaluating potential competitive effects.” The PSA is indeed useful in the sense that, given the same data, everyone should be
able to h provider rvice. The sam uld
not be sagree on the PSA of eacaid of each provider’s relevant market. for each se e probably co Nonetheless, the 1996 Statements, the 2000 Collaborations, and the 2010 Horizontal Merger Guidelines set forth safety zones based on the relevant market,
not PSAs. The safety zones set forth in the 1996 and 2000 documents are based on market share thresholds, as is the one set forth in the Proposed Statement. In
comparing the implications of these different approaches, the central question is how closely the PSA approximates the relevant market. Proposition 1 says that a
provider’s PSA market share may be either higher or lower than its market share in its relevant market. Proposition 2 says that a provider’s PSA market share may
decline as it generates more and more revenue from adjacent zip codes. These two propositions suggest that drawing inferences from PSA markets shares about market shares in relevant markets, and about competitive effects more generally, is problematic at best.
The safety zone set forth in the Horizontal Merger Guidelines, in contrast, is
based on post‐merger HHI and the change in HHI. Not surprisingly, since the safety zone in the Proposed Statement does not depend on market concentration or the
change in concentration from ACO formation, the two approaches can give very different indications of the anticompetitive potential of the same ACO. Two scenarios where the PSA and HMG approaches may be expected to yield very
provider and a very small one so that the Proposed Statement requires mandatory
review because the ACO’s PSA market share exceeds 50% whereas the Horizontal Merger Guidelines suggest it is unlikely to raise competitive concerns because the
increase in HHI will be small (i.e., less than 100 points) and (2) an ACO formed by
geographically‐dispersed strong local providers that generate little revenue outside their immediate location so that the ACO’s market share in each provider’s PSA falls below the 30% safety zone threshold even though the increase in concentration from the ACO’s formation is sufficiently large given the high post‐ACO concentration to warrant the presumption of an enhancement of market power.
In summary, sometimes PSA market shares provide meaningful information about competitive effects that is consistent with other approaches based on the relevant market; sometimes they do not. The problem is knowing when they do and when they don’t. Maybe the PSA approach captures important information that the other approaches miss. Without a better understanding of the answer to these
ssues, however, it seems a bit premature to describe the PSA, as the Proposed tatement does, as “a useful tool for evaluating potential competitive effects.”
i
S