http://www.scirp.org/journal/gep ISSN Online: 2327-4344
ISSN Print: 2327-4336
Small Scale Spatio-Temporal Variabilities
in Soil Nitrogen, Leaf Nitrogen,
and Canopy Normalized Difference Vegetation
Index of Cotton
Xinhua Yin
Department of Plant Sciences, The University of Tennessee, Jackson, TN, USA
Abstract
Strip plots have been increasingly used in agricultural field experiments to better re-flect the true situation of crop production on farmers’ fields, but failure to account for spatially and temporally related errors when present in the data analysis of strip plot field experiments may cause inefficient assessment of treatment effect signific-ance. The objective of this study was to investigate patterns and degrees of the spatial and temporal variabilities in soil inorganic N level, leaf N concentration, and Norma-lized Difference Vegetation Index (NDVI) of cotton under no-tillage and the influ-ences of N treatments on these variabilities. A strip plot experiment was conducted on a private farm near Brazil, Gibson County, Tennessee from 2009 through 2011. Five N treatments of 0, 45, 90, 134, and 179 kg N ha−1 were implemented as side dress
N in strip plots under a randomized complete block design with three replicates after 45 kg N ha−1 was applied in the form of chicken litter before cotton planting. Spatial
variability was present in soil inorganic N before cotton planting and after harvest, and in leaf N and canopy NDVI at the early square and early, mid-, and late bloom stages although the patterns and degrees of the spatial variabilities sometimes varied with growth stages and years. Application of the in-season side-dress N treatments often reduced the spatial variations of leaf N and NDVI, but increased those of post-harvest soil inorganic N. Out results suggest that the spatial and temporal varia-bilities of soil inorganic N, leaf N, and NDVI are high, and should be taken into ac-count if possible in the data analyses of N treatment effects on related soil properties and plant characteristics of cotton in strip plot field experiment research.
Keywords
Variability, Soil N, Leaf N, NDVI, N Rate, Cotton
How to cite this paper: Yin, X.H. (2016) Small Scale Spatio-Temporal Variabilities in Soil Nitrogen, Leaf Nitrogen, and Canopy Normalized Difference Vegetation Index of Cotton. Journal of Geoscience and Envi-ronment Protection, 4, 56-74.
http://dx.doi.org/10.4236/gep.2016.412005
Received: October 25, 2016 Accepted: December 5, 2016 Published: December 8, 2016
Copyright © 2016 by authors and Scientific Research Publishing Inc. This work is licensed under the Creative Commons Attribution International License (CC BY 4.0).
1. Introduction
Fertilizer N has been the agricultural input with the largest increase of use during the past several decades [1]. Nitrogen fertilization is a key management practice in non- legume crops including cotton. Fertilizer N is one of the largest expenses in cotton production. It is also the most difficult nutrient to manage, and has substantial poten-tial negative impacts on the environment. Excessive application of N on cotton can in-hibit boll formation and retention, pose serious threats to the environment [2], and re-duce prore-ducer profitability, while under-application causes poor vegetative and repro-ductive growth, premature senescence, and low yield. Due to substantially enhanced environmental concern and rising fertilizer N price during the last decade, develop-ment of innovative systems and technologies that can apply N more efficiently is war-ranted to reduce N losses, increase crop yield and profitability, and protect environ-mental quality.
Timely and accurate assessment of crop N nutrition status during the growing season can help producers manage N more efficiently. Soil inorganic N and leaf N concentra-tion have been the widely used measurements in guiding in-season N applicaconcentra-tion. However, during the past decade, the optical sensing technology for measuring crop canopy vegetation index non-destructively and at high resolutions has been increasing-ly investigated for its utilization to obtain information on crop N nutrition status, and thus for in-season precision N applications during the growing season [3]-[8]. The Normalized Difference Vegetation Index (NDVI) is a commonly used vegetation index based on the near-infrared and visible red radiation reflected from crop canopy using optical sensors [9] [10] [11] [12]. Investigations have frequently confirmed that there is a strong relationship between plant N concentration and NDVI. For example, research on winter wheat (Triticum aestivum L.) showed a strong relationship of plant N con-centration with NDVI at the growth stage-30 (R2 = 0.69) [13].
Traditionally, agricultural field experiments including N trials relating to N applica-tion rates, leaf N concentraapplica-tions, and NDVI readings are conducted with plots of small-size. However, producers’ acceptance of research results from small-size plots has decreased. A common belief among producers is that small-size plots are inferior to large strip plots because large strip plots more closely resemble farmers’ field condi-tions. Producers’ distrust of research results from small-size plots and greater accep-tance of results from large strip plots is the reason for the increased use of large strip plots in field experiments during the past years.
2. Materials and Methods
2.1. Site Description and Experimental Design
A strip plot experiment was conducted on cotton on a private farm near Brazil in Gib-son County, Tennessee during 2009 through 2011. The experiment in 2010 and 2011 was conducted on the identical plots as in 2009. The soil used for this study was a Lex-ington silt loam. Cotton was the previous crop prior to this experiment. Five N rate treatments of 0, 45, 90, 134, and 179 kg N ha−1 (0, 40, 80, 120, and 160 lb N a−1) were
evaluated as side-dress urea and ammonium nitrate (UAN, 32% N) in strip plots under a randomized complete block design with three replicates. Chicken litter with 45 kg N ha−1 was broadcast applied on soil surface across all the treatments as pre-plant N
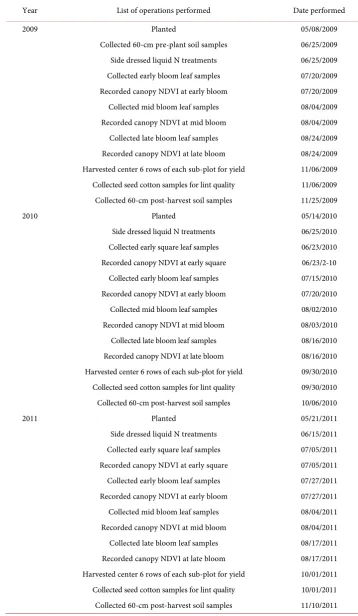
be-fore cotton planting each year. A strip plot was 11.6-m wide and 244.0 m long, and was divided into eight sub-plots with a 30.5-m length. Cotton was planted in 97-cm rows each season. Cotton was managed with the recommended management practices except the N treatments for cotton in the region. The specific dates of cotton planting, N treatment implementation, and other major field operations are presented in Table 1. Two photos of the experimental field are presented in Figure 1 to show its topography. In addition, the coordinates for the experiment corners were measured using aGPS hand held unit on August 12, 2009.
2.2. Sampling and Measurements
The following sampling and measurements were taken on a sub-plot basis each year. A composite soil sample was collected at a depth of 60 cm using a Concord hydraulic soil probe prior to initiation of the side-dress N treatments but after the pre-plant N appli-cation in early 2009. Twenty probes of 2.5-cm diameter were collected per sample. Af-ter soil samples were air-dried, ground to pass through a 2-mm sieve, and thoroughly mixed, they were analyzed by the Brookside Laboratories Inc. (New Bremen, OH) for pH, organic matter, NO3
−-N,
4
NH+-N, P, K Ca, Mg, and major micronutrients with
the Mehlich 3 method [14]. The results of initial major soil properties are shown in Ta-ble 2. A post-harvest soil sample was taken at a 60-cm depth each year for determining residual nitrate- and ammonium-N in the soil profile. These soil samples were processed and analyzed for NO3
−-N and
4
NH+-N with the same methods as stated
above. Because the identical plots from 2009 were repeatedly used for 2010 and 2011, and soil samples were taken after cotton harvest in 2009 and 2010, the pre-plant soil samples for 2010 or 2011 were not collected.
Table 1. Major operations performed on the N experiment at Gibson in 2009-2011.
Year List of operations performed Date performed
2009 Planted 05/08/2009
Collected 60-cm pre-plant soil samples 06/25/2009 Side dressed liquid N treatments 06/25/2009 Collected early bloom leaf samples 07/20/2009 Recorded canopy NDVI at early bloom 07/20/2009 Collected mid bloom leaf samples 08/04/2009 Recorded canopy NDVI at mid bloom 08/04/2009 Collected late bloom leaf samples 08/24/2009 Recorded canopy NDVI at late bloom 08/24/2009 Harvested center 6 rows of each sub-plot for yield 11/06/2009 Collected seed cotton samples for lint quality 11/06/2009 Collected 60-cm post-harvest soil samples 11/25/2009
2010 Planted 05/14/2010
Side dressed liquid N treatments 06/25/2010 Collected early square leaf samples 06/23/2010 Recorded canopy NDVI at early square 06/23/2-10 Collected early bloom leaf samples 07/15/2010 Recorded canopy NDVI at early bloom 07/20/2010 Collected mid bloom leaf samples 08/02/2010 Recorded canopy NDVI at mid bloom 08/03/2010 Collected late bloom leaf samples 08/16/2010 Recorded canopy NDVI at late bloom 08/16/2010 Harvested center 6 rows of each sub-plot for yield 09/30/2010 Collected seed cotton samples for lint quality 09/30/2010 Collected 60-cm post-harvest soil samples 10/06/2010
2011 Planted 05/21/2011
Table 2. Basic soil properties for the test field prior to the initiation of the N experiment at Gibson in 2009.
TEC pH OM NO3-N NH4-N ENR P K Ca Mg S B Fe Mn Cu Zn
County (me/100g) (H2O) (%) (ppm) (ppm) (lb/a) (ppm) (ppm) (ppm) (ppm) (ppm) (ppm) (ppm) (ppm) (ppm) (ppm)
Gibson 14.1 5.9 1.1 8.1 7.3 41.6 16.1 107.3 1483.6 250.5 29.0 0.4 145.5 135.7 1.1 1.7
Figure 1. Photos of the test field during the cotton growing season in the N experiment at Gibson in 2009.
Harvest aids were applied to terminate the crop at approximately 10 to 20 days be-fore cotton harvest. Cotton was harvested from the six center rows of each sub-plot us-ing the farmer’s cotton picker durus-ing September to November each year (Table 1). Seedcotton was weighed, and a subsample was collected for ginning. Each subsample was ginned on a 10-saw laboratory gin to determine gin turnout and obtain lint yield for each sub-plot.
2.3. Data Analysis
The coordinates at the four experiment corners were imported into ArcView GIS (En-vironmental Systems Research Institute, Redlands, CA). Maps of soil inorganic N level, leaf N concentration, and canopy IDVI were produced for each sampling time of each year with ArcView version 9.3. The coefficient of variation was calculated for each measurement at every sampling time of each year with the PROC SURVEYMEANS in SAS statistical software (SAS Institute, Cary, NC).
3. Results and Discussion
3.1. Spatio-Temporal Variations at the Experiment Scale
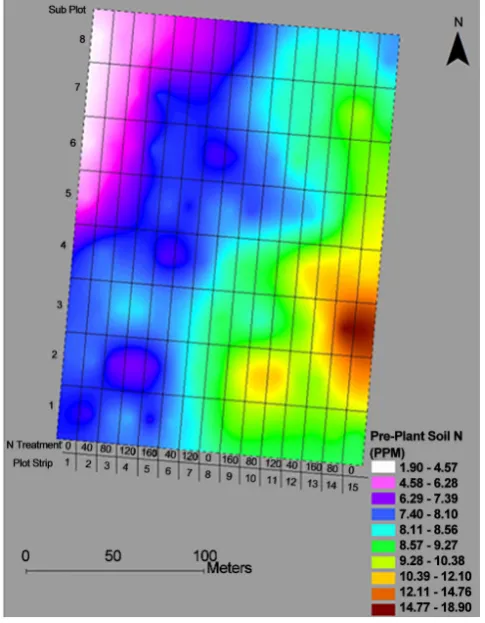
3.1.1. Spatial Variation of Initial Soil N Fertility
The ArcView map of pre-plant soil inorganic N (NO3
−-N +
4
NH+-N) concentration
concen-tration was 18.9 ppm, while the lowest was only 1.90 ppm, within the top 60 cm of the test by sub-plot. Our results indicated that the spatial variation of initial soil N fertility existed in this field prior to experimentation.
3.1.2. Spatio-Temporal Variations of Leaf N Concentration at Key Growth Stages
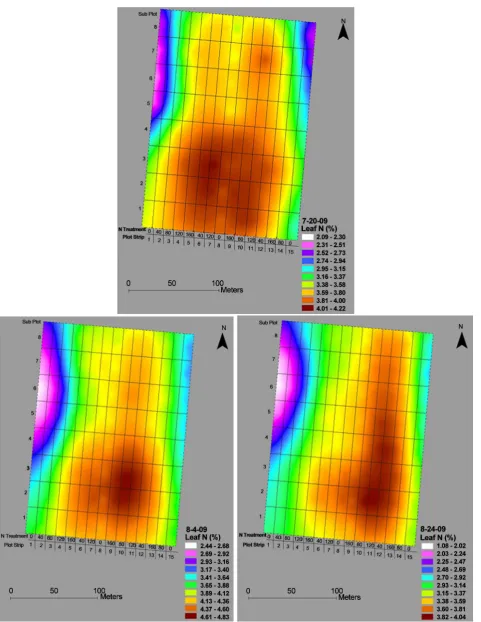
Leaf N concentration is often used in plant N nutrition status monitoring to help pro-ducers decide whether supplemental N application is needed during the growing sea-son. In 2009, the ArcView maps of leaf N were similar at the early, mid, and late bloom stages (Figure 3). The highest leaf N concentration was 4.22%, 4.83%, and 4.04%, while the lowest leaf N was only 2.09%, 2.44%, and 1.80% out of the test at the early, mid, and late bloom stages, respectively. The respective difference between the highest and low-est leaf N concentrations was 2.13%, 2.39%, and 2.24% for the three growth stages.
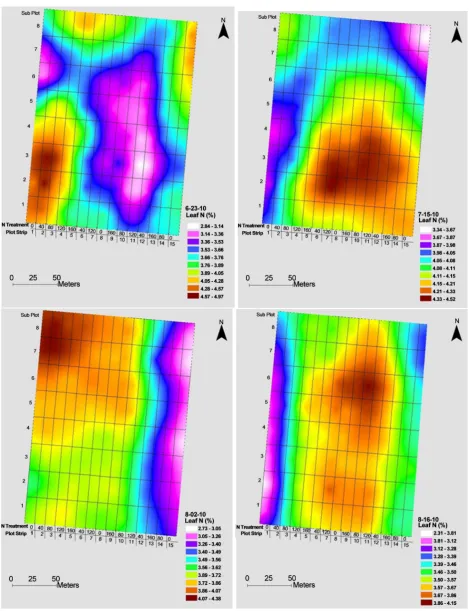
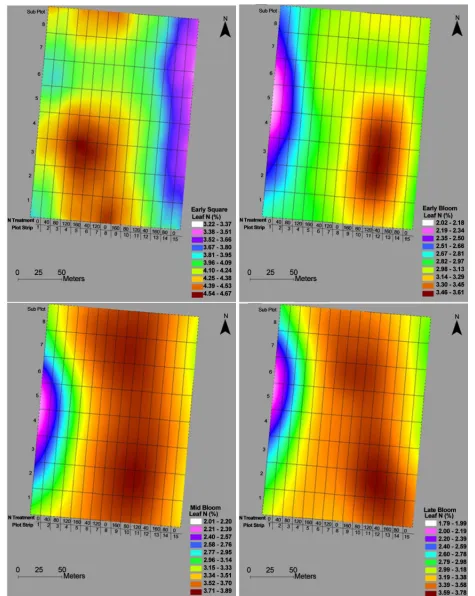
[image:6.595.253.496.362.674.2]In 2010, the maps of leaf N differed among the early square and early, mid, and late bloom stages (Figure 4). The highest leaf N concentration was 4.97%, 4.52%, 4.38%, and 4.15%, but the lowest leaf N was only 2.84%, 3.34%, 2.73%, and 2.31% within the test at early square and early, mid, and late bloom stages, respectively. The difference between the highest and lowest leaf N was 2.13%, 1.18%, 1.65%, and 1.84%, respective-ly, for the four growth stages.
Figure 2. ArcView map of pre-plant soil inorganic N (NH4
+-N +
3
In 2011, the maps of leaf N were similar at the mid and late bloom stages, but they were different from those at early square and early bloom (Figure 5). The highest leaf N concentration was 4.67%, 3.61%, 3.89%, and 3.78%, while the lowest leaf N was only 3.22%, 2.02%, 2.01%, and 1.79% out of the test at the early square and early, mid, and late bloom stages, respectively. The respective difference between the highest and low-est leaf N was 1.45%, 1.59%, 1.88%, and 1.99% for the four growth stages.
3.1.3. Spatio-Temporal Variation of Canopy NDVI at Key Growth Stages
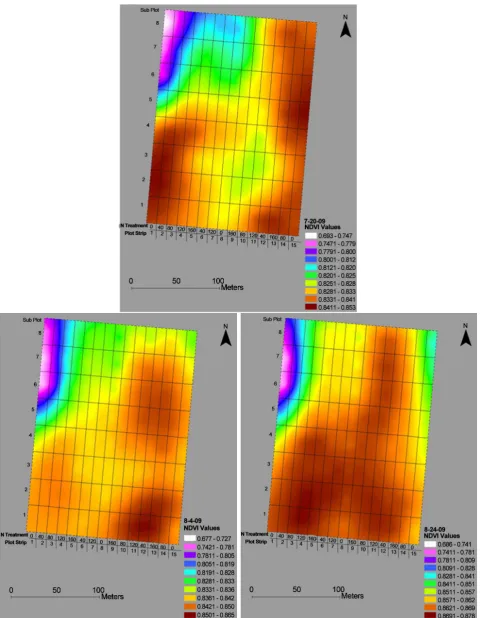
Canopy NDVI is a good vegetation index that has been increasingly used to estimate plant N nutrition status for guiding variable-rate precision N applications. The Arc View maps of NDVI were somewhat similar at the early, mid, and late bloom stages in 2009 (Figure 6), which showed a similar trend as leaf N did. The NDVI values were generally lower at the north-west corner than the rest of the field. The highest NDVI value was 0.853, 0.865, and 0.878, while the lowest NDVI reading was only 0.693, 0.677, and 0.686 out of the test at the early, mid, and late bloom stages, respectively. The dif-ference between the highest and lowest NDVI values was 0.160, 0.188, and 1.92 for the three growth stages, respectively. Overall, the pattern and degree of the spatial variabil-ity in NDVI did not change much during the 2009 growing season.
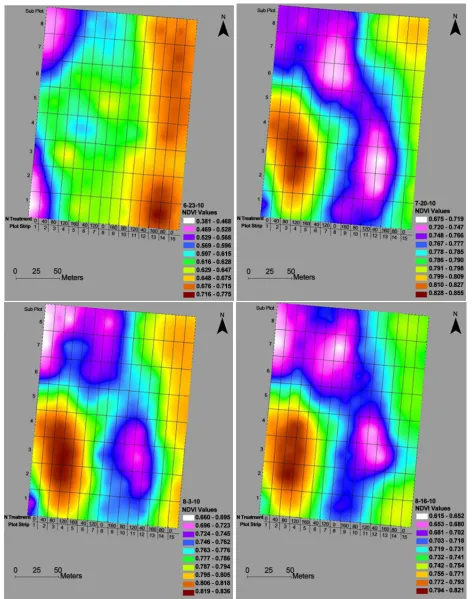
In 2010, the NDVI maps were similar at the early, mid, and late bloom stages, but they differed from that at early square (Figure 7), which were different from the trend observed from the leaf N maps of 2010. The highest NDVI value was 0.775, 0.855, 0.836, and 0.821, but the lowest NDVI reading was only 0.381, 0.675, 0.660, and 0.615 within the test at early square and early, mid, and late bloom, respectively. The respec-tive difference between the highest and lowest NDVI values was 0.394, 0.180, 0.176, and 0.206 for the four growth stages. The side-dress N treatments were applied after early square but before early bloom, which at least partially explained why the spatial varia-bility pattern and degree of NDVI at early square were different from those at the three bloom stages. Theoretically, implementation of side-dress N rate treatments ranging from 0 to 179 kg N ha−1 in strip plots should have increased the spatial variations of
NDVI if NDVI responded significantly to the N treatments. In contrast, it seemed like implementation of the side-dress N treatments did not increase, but even somehow re-duce the spatial variations of NDVI in this experiment in 2010.
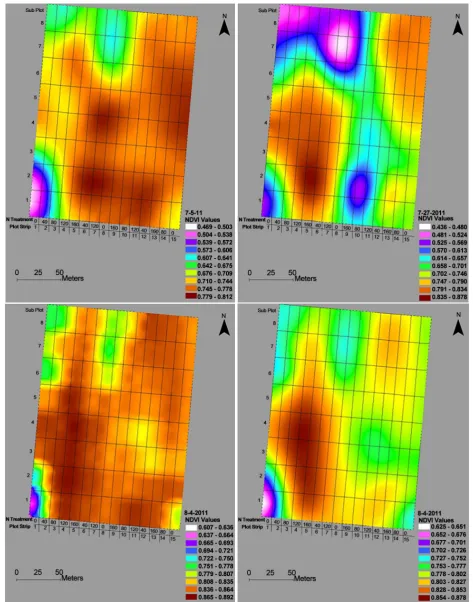
The NDVI maps were somewhat similar for the early square and mid bloom stages, and for the early and late bloom stages, respectively, in 2011 (Figure 8). However, the NDVI maps at early square and mid bloom differed from those at early and late bloom stages in 2011. The highest NDVI value was 0.812, 0.878, 0.892, and 0.878, while the lowest NDVI reading was only 0.469, 0.436, 0.607, and 0.625 out of the test at the early square and early, mid, and late bloom stages, respectively. The difference between the highest and lowest NDVI values was 0.343, 0.442, 0.285, and 0.253 for the four growth stages, respectively.
across the experiment existed and should be considered if possible when the effects of these properties on yield variability among plots are identified. Such systematic differ-ences would remarkably complicate the design of the experiment with replicated strip plots.
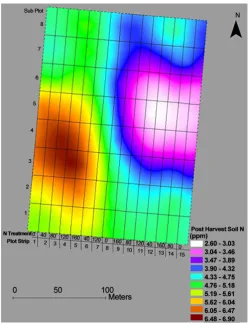
3.1.4. Spatial Variation of Post-Harvest Soil N Fertility
The ArcView maps of post-harvest soil inorganic N for 2009, 2010, and 2011 are pre-sented in Figures 9-11, respectively. The highest soil inorganic N was 6.9, 36.8, and 56.6 ppm, while the lowest was only 2.6, 3.6, and 0.0 ppm out of the test in 2009, 2010, and 2011, respectively, with the difference between the highest and post-harvest soil inorganic N being 4.3, 33.2, and 56.6 ppm for the three years, respectively. Overall, the spatial variability pattern and degree of post-harvest soil inorganic N differed remarka-bly among the three years.
[image:14.595.249.500.347.674.2]Since this experiment was conducted on the identical plots over the three-year period, theoretically the treatment effect of the second and third years (2010 & 2011) was cumulative if there was residual effect left by the treatments from the previous year(s). According to the results in Figures 9-11, post-harvest soil inorganic N level was increased from 2009 to 2011.
Figure 9. ArcView map of post-harvest soil inorganic N (NH4
+-N
+ NO3
Figure 10. ArcView map of post-harvest soil inorganic N in the N exper- iment at Gibson in 2010.
The current annual N fertilizer recommendation for cotton ranges from 67 to 90 kg N ha−1 by the University of Tennessee [15], and application of chicken litter before
cotton planting is routine to some producers in Tennessee. Application of 45 kg ha−1 of
N to all the plots as chicken litter before cotton planting in this experiment accounted for a relatively high percentage of the annual N fertilizer recommendation for cotton. The fact that 45 kg ha−1 of N was applied as pre-plant N should have reduced the spatial
variability degree of soil inorganic N, leaf N, and canopy NDVI, and that was the case in this study. However, implementation of the side-dress N treatments increased the spatial variations of post-harvest soil inorganic N from 2009 to 2011 in this experiment.
3.2. Spatio-Temporal Variations at the Strip Plot Scale
Figure 11. ArcView map of post-harvest soil inorganic N in the N experiment at Gibson in 2011.
Table 3. Coefficient of variation (%) in pre-plant soil N, canopy NDVI, leaf N, lint yield, and post-harvest soil N within each strip plot in the N experiment at Gibson in 2009.
Strip
plot N rate Pre-plant soil N NDVI_7 -20-09 NDVI_8-4-09 NDVI_8-24-09 Leaf N_ 7-20-09 Leaf N_ 8-4-09 Leaf N_ 8-24-09 Yield Post-harvest soil N
1 0 65.3 7.9 8.1 7.3 14.4 5.3 9.7 29.1 27.1
2 45 28.2 4.0 4.7 3.1 4.2 5.3 9.8 13.0 19.4
3 90 42.5 2.8 1.5 1.8 5.2 16.5 7.3 11.9 10.4
4 134 24.9 1.8 2.1 1.5 0.0 3.4 4.1 3.9 11.7
5 179 24 2.1 1.9 1.1 2.0 1.5 5.5 3.3 13.8
6 45 51.2 3.3 1.7 2.1 3.3 10.4 8.3 7.5 14.2
7 134 21.2 2.2 1.1 1.4 3.6 4.6 5.3 6.9 11.6
8 0 22.3 3.3 4.5 4.6 12.7 6.3 5.8 9.8 11.4
9 179 26.9 2.7 0.9 1.1 4.4 3.5 5.1 23.8 17.4
10 90 29.1 1.8 2.3 1.0 2.8 6.5 5.8 7.0 8.5
11 134 25.8 3.9 5.0 1.6 2.8 4.5 6.7 7.3 17.6
12 45 24 2.2 0.0 1.3 3.2 9.4 4.1 6.9 20.7
13 179 17.5 2.2 1.1 1.3 2.6 2.9 4.4 6.7 11.6
14 90 22.1 0.8 1.2 1.7 5.1 6.5 6.9 5.3 19.5
[image:16.595.192.554.454.707.2]Table 4. Coefficient of variation (%) in canopy NDVI, leaf N, lint yield, and post-harvest soil N within each strip plot in the N experiment at Gibson in 2010.
Strip plot N rate
NDVI 6-23-10 NDVI 7-20-10 NDVI 8-3-10 NDVI 8-16-10 Leaf N 6-23-10 Leaf N 7-15-10 Leaf N 8-3-10 Leaf N 8-16-10 Yield
Post-harves t soil N
1 0 18.4 7 8.2 9.1 14 7.3 8.2 6.7 31.6 18
2 45 17.7 4.7 5.2 8.6 12.7 4.9 5.2 6 47.2 32.3
3 90 9.5 5.7 7 7.9 8.5 8.4 4.9 2.6 44.4 18
4 134 14.3 4 4.3 7.6 7.9 4.2 4.9 4.9 24.7 54.1
5 179 7.3 4.2 4.3 6.5 9.5 3.6 3.8 4 17.3 10.9
6 45 7.6 3.8 4.3 3.8 8.3 4.3 7 4.4 11.5 11.4
7 134 10 4.7 5.4 6.4 6.6 4.6 3.1 5.5 16.2 45.8
8 0 4.4 3.6 2.1 3.4 11.5 2.9 4.2 5.3 14.4 24
9 179 7.3 2.7 1.3 2.1 5.9 2.3 5.7 2.2 20.8 58.2
10 90 8.7 3.7 3.6 3.6 7.7 3.9 4.8 4.5 17.4 9.9
11 134 6.5 4.4 4.2 4.5 6.9 2.1 4.4 3 15 33.9
12 45 5.2 5.4 4.2 6.2 7.4 2.2 6.3 4.8 23.9 20.1
13 179 6.6 2.2 2 4.1 5.3 5.3 3.8 4.1 18.7 67
14 90 4.7 2.1 1.2 1.4 4.9 4 2.2 3.2 42.7 27.5
15 0 2.2 1.3 1.4 2.7 10.9 4.9 6.3 6.8 10.5 17.3
Table 5. Coefficient of variation (%) in canopy NDVI, leaf N, lint yield, and post-harvest soil N within each strip plot in the N experiment at Gibson in 2011.
Strip
plot N rate NDVI 7-5-11 7-27-11 NDVI 8-4-11 NDVI 8-17-11 NDVI Leaf N 7-5-11 7-27-11 Leaf N Leaf N 8-4-11 8-17-11 Leaf N Yield Post-harvest soil N
1 0 19.2 10.1 11.3 9.3 8.3 13.1 14.8 18.1 5.6 79.7
2 45 10.3 7.5 5.6 3.6 5.4 8.2 16.3 11.3 23.2 37.5
3 90 4.3 4.2 3.2 2.7 5.3 7.0 7.5 5.1 17.5 34.9
4 134 6.1 7.0 1.5 1.0 7.5 4.7 6.7 6.4 13.7 58.7
5 179 2.8 2.2 1.7 1.4 2.4 5.8 4.3 3.3 9.6 60.3
6 45 5.8 8.6 2.9 2.1 4.3 3.8 3.7 6.6 29.3 51.1
7 134 18.0 13.8 6.8 5.3 6.3 3.1 3.1 5.7 27.0 49.9
8 0 6.1 5.1 2.4 1.2 5.6 6.1 7.7 8.7 19.5 59.8
9 179 5.1 4.0 3.0 1.9 3.9 5.5 3.0 4.5 20.1 103.2
10 90 4.4 19.7 2.2 1.9 3.2 9.2 2.2 4.7 20.3 53.9
11 134 1.6 3.4 3.0 1.9 3.2 8.6 3.9 3.9 13.4 79.3
12 45 3.8 3.9 2.8 2.3 4.4 10.5 2.6 8.3 36.3 59.2
13 179 2.1 1.8 1.5 1.3 4.5 4.8 3.6 4.9 24.0 40.8
14 90 3.4 4.9 1.0 1.0 2.9 3.5 4.2 5.0 19.0 72.8
[image:17.595.192.556.427.707.2]tical N treatment, the CV value for each strip plot in Tables 3-5 reflects the spatial var-iations within that strip plot. Application of the side-dress N treatments in a range of 45 to 175 kg N ha−1 did not show consistent influence on the CV values of any
measure-ment relative to the zero N control within any strip plot in this study.
Historically, agricultural field experiments frequently utilized a classical randomized complete block and similarly designed experiments with small-size plots. In order to avoid the influences of spatial variability, replicates of the treatment plots were used at a location as homogeneous as possible. A widely accepted assumption was that existing spatial variability in the experiment could be compensated for by a large number of replicates of the treatment plots [16]. Because a strip plot covers a much larger area then a small-size plot, the spatial variation within a strip plot is likely greater than that within a small-size plot. Thus, more replicates may be required for experiments with strip plots than those with small-size plots to compensate for the same degree of spatial variability in the field.
4. Conclusions
Spatial variability was present in soil N fertility before cotton planting and after harvest and leaf N and canopy NDVI at the early square and early, mid-, and late bloom stages of no-till cotton at the experiment scale. Pattern and degree of the spatial variabilities sometimes varied with growth stages and years. Implementation of the in-season side-dress N treatments often reduced the spatial variations of leaf N and NDVI, but increased those of post-harvest soil inorganic N. Out results suggest that the spatial and temporal variabilities of soil inorganic N, leaf N, and NDVI are high, and should be taken into account if possible in the statistical analyses of N treatment effects on the related soil properties and plant characteristics of cotton in strip plot field experiments. The results of this study provide insight into patterns and degrees of the spatial and temporal variabilities of soil inorganic N, leaf N, and NDVI of cotton on farmers’ fields in the region. It is anticipated that there are significant spatial and temporal variabilities of these soil properties and plant characteristics on farmers’ fields. Therefore, variable- rate precision N applications may be needed for a farmers’ cotton field by taking the spatial and temporal variabilities into account.
Acknowledgements
This project was supported in part by Cotton Incorporated Cooperative Agreement No. 09-497TN, managed by Dr. Bob Nichols. We appreciate the cooperative farmer: Jeff Dodd in Gibson County for allowing us to conduct the tests on his farm. Technical as-sistance was provided by Robert Sharp, James Warren, Tracy Bush, Matt Ross, Dereck Eison, Ngowari Jaja, Will Goforth, and others.
References
[1] Johnston, A.E. (2000) Efficient Use of Nutrients in Agricultural Production Systems.
https://doi.org/10.1080/00103620009370527
[2] Prasad, R. and Power, J.F. (1995) Nitrification Inhibitor for Agriculture, Health and Envi-ronment. Advances in Agronomy,54, 233-281.
https://doi.org/10.1016/S0065-2113(08)60901-3
[3] Raun, W.R. and Johnson, G.V. (1999) Improving Nitrogen Use Efficiency for Cereal Pro-duction. Agronomy Journal, 91, 357-363.
https://doi.org/10.2134/agronj1999.00021962009100030001x
[4] Raun, W.R., Solie, J.B., Johnson, G.V., Stone, M.L., Mullen, R.W., Freeman, K.W., Thoma-son, W.E. and Lukina, E.V. (2002) Improving Nitrogen Use Efficiency in Cereal Grain Production with Optical Sensing and Variable Rate Application. Agronomy Journal, 94, 815-820. https://doi.org/10.2134/agronj2002.8150
[5] Biermacher, J.T., Epplin, F.M., Brorsen, B.W., Solie, J.B. and Raun, W.R. (2006) Maximum Benefit of a Precise Nitrogen Application System for Wheat. Precision Agriculture, 7, 193-204. https://doi.org/10.1007/s11119-006-9017-6
[6] Barker, D.W. and Sawyer, J.E. (2010) Using Active Canopy Sensors to Quantify Corn Ni-trogen Stress and NiNi-trogen Application Rate. Agronomy Journal,102, 964-971.
https://doi.org/10.2134/agronj2010.0004
[7] Yin, X. (2015) In-Season Side-Dressing of Urea and Ammonium Nitrate to Cotton On No-Till Soils with High Residual Nitrogen and Pre-Plant Nitrogen Application. Open
Journal of Soil Science,5, 276-286. https://doi.org/10.4236/ojss.2015.511026
[8] Arnall, D.B., Abit, M.J.M., Taylor, R.K. and Raun, W.R. (2016) Development of an NDVI- Based Nitrogen Rate Calculator for Cotton. Crop Science,56, 3263-3271.
https://doi.org/10.2135/cropsci2016.01.0049
[9] Zhou, G.S. and Yin, X. (2014) Relationship of Cotton Nitrogen and Yield with Normalized Difference Vegetation Index and Plant Height. Nutrient Cycling in Agroecosystems,100, 147-160. https://doi.org/10.1007/s10705-014-9640-y
[10] Attia, A. and Rajan, N. (2016) Within-Season Growth and Spectral Reflectance of Cotton and Their Relation to Lint Yield. Crop Science, 56, 2688-2701.
https://doi.org/10.2135/cropsci2015.05.0296
[11] Plant, R.E., Munk, D.S., Roberts, B.R., Vargas, R.N., Travis, R.L., Rains, D.W. and Hut-macher, R.B. (2001) Application of Remote Sensing to Strategic Questions in Cotton Man-agement and Research. Journal of Cotton Science, 5, 30-41.
[12] Gutierrez, M., Norton, R., Thorp, K.R. and Wang, G.Y. (2012) Association of Spectral Ref-lectance Indices with Plant Growth and lint Yield in Upland Cotton. Crop Science, 52, 849-857. https://doi.org/10.2135/cropsci2011.04.0222
[13] Flowers, M., Weisz, R. and Heiniger, R. (2003) Quantitative Approaches for Using Color Infrared Photography for Assessing In-Season Nitrogen Status in Winter Wheat.
Agrono-my Journal,95, 1189-1200. https://doi.org/10.2134/agronj2003.1189
[14] Mehlich, A. (1984) Mehlich 3 Soil Test Extractant: A Modification of Mehlich 2 Extractant.
Communications in Soil Science and Plant Analysis, 15, 1409-1416.
https://doi.org/10.1080/00103628409367568
[15] Savoy, H.J. and Joines, D. (2009) Lime and Fertilizer Recommendations for the Various Crops of Tennessee. Chapter II. Agronomic Crops.
http://soilplantandpest.utk.edu/pdffiles/soiltestandfertrecom/chap2-agronomic_mar2009.pdf [16] Davis, J.C. (1986) Statistics and Data Analysis in Geology. 2nd Edition, John Wiley & Sons,
Submit or recommend next manuscript to SCIRP and we will provide best service for you:
Accepting pre-submission inquiries through Email, Facebook, LinkedIn, Twitter, etc. A wide selection of journals (inclusive of 9 subjects, more than 200 journals)
Providing 24-hour high-quality service User-friendly online submission system Fair and swift peer-review system
Efficient typesetting and proofreading procedure
Display of the result of downloads and visits, as well as the number of cited articles Maximum dissemination of your research work
Submit your manuscript at: http://papersubmission.scirp.org/