OCT-NOV, 2012, Vol. – I, Issue-III
www.srjis.com
Page 703
HYPERTENSION PREDICTION USING DATA MINING
Hassanian Raheem Kareem
University of Misan
College of Education Republic of Iraq
Received: 20 August 2012
Accepted: 28 August 2012
Hypertension, or high blood pressure, is dangerous because it can lead to strokes, heart attacks,
heart failure, or kidney disease and many more disease aliments. The goal of hypertension prediction is
to intimate high blood pressure to get the right treatment and protect important organs, like the brain,
heart, and kidneys from damage. Treatment for hypertension has been associated with reductions in
stroke (reduced an average of 35%-40%), heart attack (20%-25%), and heart failure (more than 50%),
according to research [1]. Hypertension is widely considered to be one of the most important risk factors
for these diseases and is strongly associated with death from stroke, congestive heart failure and
coronary heart disease. Present study focuses on predicting high blood pressure using data mining
technique from stored database using decision tree.
Introduction
Data Mining is a process of discovering meaningful useful information in large data repositories.
Data mining can discover valuable but hidden knowledge from databases. The applications of data mining
can be found in many areas such as evaluating risks of financial investment, detection of credit card fraud,
patient diagnosis etc. The healthcare industry collects huge amount of healthcare data which,
unfortunately are not mined to discover hidden patterns and relationship often goes exploited. Present
study utilizes the database which is maintain by healthcare industry and mine it to predict whether patient
is suffering from hypertension or not which minizes the clinical test of the patients.
Abstract
OCT-NOV, 2012, Vol. – I, Issue-III
www.srjis.com
Page 704
The goal of hypertension prediction is to intimate high blood pressure to get the right treatmentand protect important organs, like the brain, heart, and kidneys from damage. Treatment for hypertension
has been associated with reductions in stroke (reduced an average of 35%-40%), heart attack (20%-25%),
and heart failure (more than 50%), according to research [1]. Hypertension is widely considered to be one
of the most important risk factors for these diseases and is strongly associated with death from stroke,
congestive heart failure and coronary heart disease. Present study focuses on predicting high blood
pressure using data mining technique from stored database using decision tree.
Hypertension is a major risk factor for stroke and coronary heart disease, and is a major
contributor to the onset and progression of chronic heart failure and chronic kidney failure. High blood
pressure is often called the "silent killer" because it has no symptoms and can go undetected for years.
Patients with hypertension should routinely provide advice on smoking, nutrition, alcohol use, physical
activity and body weight.
Review of Literature
Now a days data mining is the emerging technology to get hidden patterns from large database,
many studies carried out on data mining in different areas, Fayyad defines data mining as a process of non
trivial extraction of implicit. Previously unknown and potentially useful information from the data stored
in a database [2]. Data mining uses two strategies, supervised and unsupervised learning. In supervised
learning, a training set is used to learn model parameter whereas in unsupervised learning no training set
is used [3].
Different data mining techniques serves different purpose depending on the objective of its
model. The most commonly used are Classification and prediction. Classification model predict
categorical labels while prediction models predict continuous valued function [4]. Decision tree and
neural network use classification algorithm while regression. Association rules and clustering use
prediction algorithm [5]. Decision tree algorithm include CART (classification and regression tree). ID3
(iterative dichotomized 3) and C4.5. These algorithm differ in selection of splits. When to stop a node
from splitting and assignment of class to a non-split node [6]. CART uses Gini index to measure the
impurity of a partition or set of training tuples [7]. It can handle high dimensional categorical data.
Decision tree can also handle continuous data (as in regression) but they must be converted to categorical
data.
Methodology
Decision tree technique will be used to evaluate the data set which requires table, record, and
attribute selection as well as data cleaning and transformation. The modeling phase selects and applies
various techniques, and calibrates their parameters to optimal values. The evaluation phase evaluates the
OCT-NOV, 2012, Vol. – I, Issue-III
www.srjis.com
Page 705
needed to use the models [8]. Data Mining Extension (DMX), a SQL-style query language for datamining, is used for building and accessing the models’ contents. Tabular and graphical visualizations are
incorporated to enhance analysis and interpretation of results.
Data source
The record from different hospital of Aurangabad city has been collected total of 809 records with 13
medical attributes (factors) were obtained from the Cleveland hypertension database . Figure 1 lists the
attributes. The records were split equally into two datasets: training dataset (355 records) and testing
dataset (354 records). To avoid bias, the records for each set were selected randomly. For the sake of
consistency, only categorical attributes were used for all the three models. All the non-categorical medical
attributes were transformed to categorical data. The attribute “Diagnosis” was identified as the predictable attribute with value “1” for patients with hypertension value “0” for patients with no hypertension. The attribute “PatientID” was used as the key; the rest are input attributes. It is assumed that problems such as
missing data, inconsistent data, and duplicate data have all been resolved.
Predictable attribute
1. Diagnosis (value 0: < 50% diameter narrowing (no hypertension); value 1: > 50% diameter narrowing
(has hypertension))
Key attribute
1. PatientID – Patient’s identification number
Input attributes
1. Sex (value 1: Male; value 0 : Female)
2. Age in Year
3. Giddiness (Value 1: yes Value 0: No)
4. ECG changes (value 1: yes value 0: No)
5. Fasting Blood Sugar (value 1: > 120 mg/dl; value 0: < 120 mg/dl)
6. Restecg – resting electrographic results (value 0: normal; value 1: 1 having ST-T wave abnormality;
value 2: showing
probable or definite left ventricular hypertrophy)
7. Exang – exercise induced angina (value 1: yes; value 0: no)
8. Obesity (value 1: yes , value 0: No)
9. Family history (value 1: yes, value 0: No)
10. Segregate smoking (value 1: yes value 0:No)
11. Serum Cholesterol (mg/dl)
OCT-NOV, 2012, Vol. – I, Issue-III
www.srjis.com
Page 706
13. Oldpeak – ST depression induced by exercise relative to restFigure 1. Description of attributes
Mining models
Data Mining Extension (DMX) query language was used for model creation, model training, model
prediction and model content access. All parameters were set to the default setting except for parameters
“Minimum Support = 1” for Decision Tree and “Minimum Dependency Probability = 0.005”
Validating model effectiveness
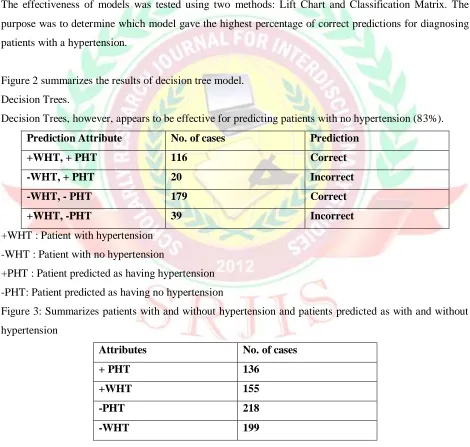
The effectiveness of models was tested using two methods: Lift Chart and Classification Matrix. The
purpose was to determine which model gave the highest percentage of correct predictions for diagnosing
[image:4.612.71.541.226.673.2]patients with a hypertension.
Figure 2 summarizes the results of decision tree model.
Decision Trees.
Decision Trees, however, appears to be effective for predicting patients with no hypertension (83%).
Prediction Attribute No. of cases Prediction
+WHT, + PHT 116 Correct
-WHT, + PHT 20 Incorrect
-WHT, - PHT 179 Correct
+WHT, -PHT 39 Incorrect
+WHT : Patient with hypertension
-WHT : Patient with no hypertension
+PHT : Patient predicted as having hypertension
-PHT: Patient predicted as having no hypertension
Figure 3: Summarizes patients with and without hypertension and patients predicted as with and without
hypertension
Attributes No. of cases
+ PHT 136
+WHT 155
-PHT 218
-WHT 199
In All 354 cases has been evaluated using decision tree technique out of which Patients found
OCT-NOV, 2012, Vol. – I, Issue-III
www.srjis.com
Page 707
hypertension but predicted as hypertension are 20 which are incorrect and patients with no hypertensionand predicted as no hypertension found 179 which are correct and patients with no hypertension and
predicted as with hypertension found 39 which are incorrect out of 354 cases 295 cases are found to be
correct and 59 cases are found to be incorrect.
Out of 354 patients there are 155 patients with hypertension and by using decision tree technique
139 patients are predicted with hypertension and patients without hypertension are 218 using this
technique our of 218 patients 199 predicted as no hypertension. In the present study accuracy of the result
found is 83% which is significant.
Conclusion
Hypertension prediction using data mining by decision tree technique, In All 354 patients are
tested out of which 295 patients predicted correctly and 59 patients predicted incorrectly, There is 83%
accuracy of the system which is significant and the system can be used to assist the doctors and the
patients before testing hypertension.
A prototype hypertension prediction is developed using decision tree technique. The system
extracts hidden knowledge from a historical hypertension database. DMX query language and functions
are used to build and access the models. The models are trained and validated against a test dataset. Life
chart and classification matrix methods are used to evaluate the effectiveness of the models. Decision tree
able to extract patterns in response to the predictable state.
Hypertension prediction using data mining technique can be further enhanced and expanded. For
example. It can incorporate other medical attributes besides the 15 listed in figure 1. It can also
incorporate other data mining techniques e.g. Time series, clustering and association rules. Continuous
data can also be used instead of just categorical data. Another area is to use text mining to mine the vast
amount of unstructured data available in healthcare database. Another challenge would be to integrate
data mining and text mining [9].
References:
[1] M. M. Al-Nozha, M. S. Ali and A. K. Osman, “Arterial hypertension in Saudi Arabia,” Annals of
Saudi Medicine, Vol. 17, No. 2, 1997, pp. 170-174.
[2] Fayyad, U: “Data Mining and Knowledge Discovery in Databases: Implications fro scientific
databases”, Proc. of the 9th Int. Conf. on Scientific and Statistical Database
[3] Obenshain, M.K: “Application of Data Mining Techniques to Healthcare Data”, Infection Control and
Hospital Epidemiology, 25(8), 690–695, 2004.
[4] Han, J., Kamber, M.: “Data Mining Concepts and Techniques”, Morgan Kaufmann Publishers, 2006. [5] Charly, K.: “Data Mining for the Enterprise”, 31st Annual Hawaii Int. Conf. on System Sciences,
OCT-NOV, 2012, Vol. – I, Issue-III
www.srjis.com
Page 708
[6] Ho, T. J.: “Data Mining and Data Warehousing”, Prentice Hall, 2005.[7] Han, J., Kamber, M.: “Data Mining Concepts and Techniques”, Morgan Kaufmann Publishers, 2006. [8] Charly, K.: “Data Mining for the Enterprise”, 31st Annual Hawaii Int. Conf. on System Sciences,
IEEE Computer, 7, 295-304, 1998.
[9] Weiguo, F, Wallace, I.. Rich, S. Zhongju, A.: “Tapping the power of text mining”, Communication of