PEER REVIEWED JOURNAL, OCT-NOV 2018, VOL- 6/30
Copyright © 2017, Scholarly Research Journal for Interdisciplinary Studies
CONSTRUCTION AND STANDARDIZATION OF COMPUTER PROFICIENCY
SCALE FOR ELEMENTARY SCHOOL TEACHERS
Suman Kumari1 & Vishal Sood2, Ph. D. 1
Ph.D. Research Scholar, H. P. University, Shimla-5, [email protected]
2
Assistant Professor (Education), H. P. University, Shimla-5, [email protected]
For measuring computer proficiency of elementary school teachers, the present task was undertaken to construct and standardize computer proficiency scale. For this, data were collected from elementary school teachers by adopting multistage and stratifed random sampling technique. An item pool was created initially by consulting various sources and theoretical and empirical literature available in the concerned area. This item pool was put to evaluation and criticism by technical as well as language experts. The preliminary draft of computer proficiency scale was further subjected to item analysis to select only highly discriminating and valid items. The reliability of scale was established with the help of test-retest and Cronbach’s Alpha method which were found to be appreciably high. The validity of computer proficiency scale was ascertained and norms were established for interpretation of obtained scores on the scale. In the last, conclusions have been presented and applicability of computer proficiency scale has been discussed.
Keywords: Construction, Standardization, Computer Proficiency.
Introduction
The use of technology in teaching can offer a number of benefits. First, it allows teachers to
organize their teaching in an efficient manner. With technology, teachers can visualize the
abstract concepts and create the real world simulations. They not only help students to
understand the topic better, but they can save their time for explaining the abstract content
matter to students. Second, technology provides teachers with a wide range of sources that
are useful for their teaching. Usually, the already available resources can offer more than
what may be needed by teachers. Technology can also help teachers develop networks with
other teachers from different parts of the world who share similar interests or who have the
expertise in certain field. Network building can help teachers solve their teaching problems
and, therefore, enhance their professionalism. Computers and computerized devices have
become an integral part of society. In fact, many people use them in schools, homes, and the
workplace. It has become imperative to know basic computer skills to survive in the world. Scholarly Research Journal's is licensed Based on a work at www.srjis.com
Copyright © 2017, Scholarly Research Journal for Interdisciplinary Studies
Computer proficiency is understood as one‟s ability to use computer-based
technologies. Computer proficiency for teachers refers to the skills and knowledge which a
teacher needs to have improved learning in acquisition and development of computer skills. It
also encompasses the competence and skills possessed by the teacher in using computers
during teaching-learning process and for providing other educational /learning experiences to
the students for improving students‟ learning levels. The review of research studies in this
area also highlights the importance of computer proficiency and problems in its use by the
individuals in their work situations. Bradlo, Hoch and Hutchinson (2002)suggested that
people were moderately calibrated with respect to their basic computer proficiency relative to
that of others, but were not well-calibrated regarding their knowledge of different
sub-domains of computer proficiency and various antecedents of computer knowledge (e.g.
online experience, familiarity with technology) were significant predictors of objective
knowledge, self-report knowledge, and calibration, while in addition, these measures were all
significantly related to consequences such as number of online purchases, and concern over
buying from an internet retailer. James, Wendy and Subramaniam (2005) indicated that
there was a significant correlation between the perceived usefulness of course website
features such as; lecture notes, tutorial questions and solutions and the frequency of use or
access by students of such course website features. Further, it was found that the perceived
usefulness of course websites was positively related to students‟ computer proficiency, but
not with the frequency with which students missed classes. Rondeau and Xiaolin
(2009)revealed that those students who took and passed the computer proficiency exam.
(CPE) generally scored higher in their follow-on, sophomore IT course than those who
passed the prerequisite, freshmen IT course. However, the CPE pass rate proved to be
significantly lower than that of the course it replaced. This created an unexpected backlog of
students unable to enroll in the sophomore IT course, delaying their programme of study.
Furthermore, over time the CPE highlighted patterns of weakness in students‟ Excel skills,
proving it to be a valuable diagnostic tool. Ogwu and Ogwu (2012) revealed that students‟
readiness while entering UB significantly correlated (r= -.295, n=2368 p= .000) inversely
with their proficiency in ICT. This indicated that as students‟ readiness while entering UB
decreases, their proficiency in ICT tend to increase. Zhang, Grenhart, McLaughlin and
Allaire (2016) examined that the predictors of Computer Proficiency Questionnaire (CPQ)
total score as well as the three CPQ subscales (e.g., Internet and e-mail use, communication
Copyright © 2017, Scholarly Research Journal for Interdisciplinary Studies
reasoning, perceptual speed, and psychomotor speed were associated with at least one domain
of computer proficiency. Positive affect uniquely predicted communication and calendaring.
As for demographic variables, age was negatively correlated with general CPQ score, internet
and e-mail proficiency, and communication and calendaring proficiency; education was
positively correlated with internet and -email proficiency, and communication and
calendaring proficiency. Sense of control had significant positive correlation with general
CPQ score and all the sub-scores. Positive affect positively correlated with general CPQ
score and communication and calendaring proficiency, and negative affect negatively
correlated with basic computer proficiency.
A glimpse of research literature reveals that most of the research studies on computer
proficiency have been carried out on students and there is a lack of such studies on teachers
especially in India. Moreover, there is no research tool available at present which can be
safely used for measuring computer proficiency of school teachers. Hence, it was thought
worthwhile to construct and standardize computer proficiency scale for elementary school
teachers.
Purpose of the Scale
The present scale is intended to measure the computer proficiency of elementary
school teachers.
Objectives:
1. To prepare the preliminary draft of computer proficiency scale for elementary school
teachers.
2. To carry out item analysis of preliminary draft of computer proficiency scale.
3. To estimate reliability of computer proficiency scale through test-retest andCronbach‟
s Alpha methods.
4. To ascertain the validity of computer proficiency scale.
5. To establish norms for interpretation of scores obtained on computer proficiency
scale.
Methodology
For construction and standardization of computer proficiency scale for elementary
school teachers, survey technique under descriptive method of research was employed.
Sampling
Multistage sampling with stratified random sampling technique was employed in this
Copyright © 2017, Scholarly Research Journal for Interdisciplinary Studies
out item analysis of preliminary draft of computer proficiency scale. At the second stage, a
sample of 56elementary school teachers was selected to compute test-retest reliability of
computer proficiency scale. At the time of second administration, 8 elementary teachers were
not present. Therefore, test-retest reliability was computed on the basis of responses given by
the 55 elementary school teachers. At the third stage, 80 elementary school teachers were
selected to estimate Cronbach‟s Alpha of computer proficiency scale. At the last stage, a
sample of 550 upper primary school teachers was chosen for establishing norms for
interpretation of scores obtained on computer proficiency scale.
Planning and Preparation of Initial Draft of Computer Proficiency Scale for
Elementary School Teachers
First of all, the investigator thoroughly screened the related literature, different
questionnaires, inventories and tests on computer proficiency, computer awareness, and use
of computers and carried out discussions with the computer experts. On the basis of this, the
investigator prepared a list of 65 items/statements on computer proficiency. These items were
pooled from various sources and getting the statements of opinions from experts, researchers,
experienced teachers, teacher educators and computer instructors. Items in the scale were
formulated by using Likert Method of Summated Ratings on a five point continuum i.e. don‟t
know, can‟t do, proficient to some extent, proficient to great extent and fully proficient. The
scoring was done by awarding 1, 2, 3, 4 and 5 marks respectively for above mentioned
responses. All statements were positive in nature and there was no negative statement in the
scale.
Editing and Revision of Initial Draft of Proficiency Scale for Teachers:
After writing the statements/items for computer proficiency scale, they were edited
and revised. For this, the initial draft of the scale was given to experienced teachers, teacher
educators, experts in the concerned area, research scholars, faculty members of the
department of education, HPU, Shimla to judge the content and linguistic accuracy of each
item and its relevance. Each item/statement was personally discussed with the experts and
their valuable comments and suggestions were taken into consideration in order to remove
any type of logical, technical and linguistic ambiguity in the statements. On the basis of
expert opinion, 10 items were rejected from the initial draft of computer proficiency scale and
Copyright © 2017, Scholarly Research Journal for Interdisciplinary Studies Data Analysis and Results
Item Analysis of Preliminary Draft (Try-Out Form) of Computer proficiency Scale
Data were analyzed by employing appropriate statistical techniques. The details are
given as under:
The technique of item analysis was employed for selection/rejection of statements for
preparing final draft of computer proficiency scale. To carry out item analysis, the
preliminary draft of computer proficiency scale was administered on a sample of 100
elementary school teachers of Kinnaur and Lahaul-Spiti districts of Himachal Pradesh.
Afterwards, 27% of the elementary school teachers (40 teachers) with highest total score and
27% of the elementary teachers with lowest total score on computer proficiency scale were
taken into consideration. These two groups were named as “top group having high scores” and “bottom group having low scores” respectively. The middle 46% cases were weeded out
and not considered for further analysis. After this, mean and standard deviation for each
statement were calculated and t-values were computed for each item to find out the
significance of mean difference among two groups in respect of each statement of
preliminary draft of computer proficiency scale. The value of „t‟ is a measure of the extent to
which a given statement differentiates between the high and low scoring groups. The t-values
for all 55 items were computed and 41 items having t-value equal to or greater than 1.75
(highly discriminating) were selected for final draft of the computer proficiency scale / 14
items/statements having t-value less than 1.75 were rejected.
The total score on the scale can range from 41 to 205. The higher total score on the
scale reflects higher computer proficiencyand vice-versa.
RELIABILITY OF COMPUTER PROFICIENCY SCALE
The reliability of computer proficiency scale was determined by using test-retest and
Cronbach‟s Alpha method.
1. Test-Retest
The test-retest reliability of computer proficiency scale for elementary teachers was
estimated by administering the final draft of the scale twice on 56 school teachers after a time
gap of fifteen days. It is important to mention that at the time of second administration, 8
teachers were not present. Therefore, test-retest reliability was computed on the basis of
responses given by the 48 elementary school teachers. Then the coefficient of correlation was
Copyright © 2017, Scholarly Research Journal for Interdisciplinary Studies
0.732 which is significant at 0.01 level of significance. The scale was found to have
appreciably high reliability.
2. Cronbach’ s Alpha
Cronbach‟s alpha is designed as a measure of internal consistency. The value of
Cronbach‟s alpha of computer proficiency scale came out to be 0.784 respectively. This is
indicative of the fact that computer proficiency scale for elementary teachers is internally
consistent to a greater extent.
VALIDITY OF COMPUTER PROFICIENCY SCALE:
The validity of computer proficiency scale was ascertained in terms of item validity,
content validity and cross validity.
1. Content Validity: The content validity of computer proficiency scale was established
by carrying out critical discussions with field experts at the time of development of
preliminary draft of the scale. The experts were of the opinion that the statements in
computer proficiency scale were fully adequate and relevant to measure the computer
proficiency level of teachers. In addition to this, only those items were retained in the
preliminary draft of the computer proficiency scale for which there has been at least 90%
agreement amongst experts with regard to relevance of items. Thus, the computer
proficiency scale was found to possess adequate content validity.
2. Cross Validity: The cross validity of the computer proficiency scale was ensured by
taking entirely different samples of elementary school teachers in order to carry out item
analysis, establishing reliability and developing norms.
3. Item Validity: Computer proficiency scale was considered valid enough in terms of
item validity because only those items were retained in the final draft of the scale which was
having t-values equal to or greater than 1.75 (highly discriminating items).
Statistical Results
For establishing norms for interpreting obtained scores on computer proficiency scale,
a total of 550 elementary school teachers were selected from 8 districts of Himachal Pradesh
by employing incidental sampling technique. Based on the scores of 550 elementary
Copyright © 2017, Scholarly Research Journal for Interdisciplinary Studies
Table 1 Statistical Results in respect of Computer Proficiency Scale
N Mean SD
550 132.5 28.2
Norms: On the basis of the statistical results presented in Table 1, z-score norms have been
prepared and the same have been presented in Table 2.
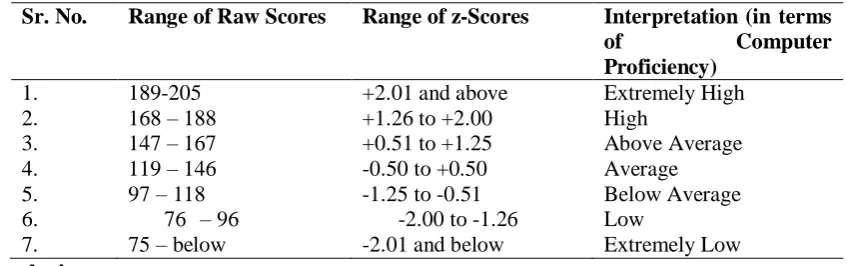
NORMS FOR INTERPRETING SCORES ON COMPUTER PROFICIENCY SCALE
FOR TEACHERS:
Norms for interpretation of the level of Elementary School Teachers‟ Computer
[image:7.595.84.508.279.412.2]Proficiency have been given in Table 2.
Table 2 z-scores Norms for Computer Proficiency Scale
Sr. No. Range of Raw Scores Range of z-Scores Interpretation (in terms
of Computer
Proficiency)
1. 189-205 +2.01 and above Extremely High
2. 168 – 188 +1.26 to +2.00 High
3. 147 – 167 +0.51 to +1.25 Above Average
4. 119 – 146 -0.50 to +0.50 Average
5. 97 – 118 -1.25 to -0.51 Below Average
6. 76 – 96 -2.00 to -1.26 Low
7. 75 – below -2.01 and below Extremely Low
Conclusions:
Following conclusions were drawn with respect to construction and standardization of
scale for measuring computer proficiency of elementary school teachers:
1. The present computer proficiency scale has been specifically constructed for
elementary school teachers. However, it can be employed for measuring computer
proficiency of high schools and senior secondary school teachers by taking precaution
and care.
2. The initial draft of computer proficiency scale was comprised of 65 statements which
were put to strict and rigorous examination in terms of expert opinions. After such
critical examination and taking into consideration the suggestions of field experts, 10
items were rejected and certain items were modified/revised. The preliminary draft of
the scale was thus comprised of 55 items. After carrying out item analysis, 14 items
with t-value less than 1.75 (least discriminating item) were rejectedand final form of
the scale has 41items.
3. The reliability of the scale was computed through test-retest method and Cronbach
Copyright © 2017, Scholarly Research Journal for Interdisciplinary Studies
scale can be considered to have appreciably highindex of stability and high internal
consistency respectively.
4. The validity of computer proficiency scale has also been ascertained in terms of item
validity, content validity and cross validity which were found to be satisfactory.
5. The suggestive norms for interpretation of obtained scores on the computer
proficiency scale have been developed on the basis of which, the level of computer
proficiency of elementary school teachers can be ascertained.
Applicability and Implications:
The present research work was carried out to construct and standardize a scale for
measuring computer proficiency of elementary school teachers. This scale can be used for
any diverse group of respondents differentiated on the basis of level of education, gender etc.
This scale can also be used for measuring and comparing computer proficiencyof school
teachers at different levels of education. The scale is fairly reliable and valid to measure the
computer proficiency level of elementary school teachers. This scale can be easily
administrated in individual situations and can be scored and interpreted conveniently. On the
basis of scores obtained on this scale, necessary steps can be taken to bring suitable changes
in computer proficiencyof elementary school teachers.
REFERENCES
Bhargava, M. (2006). Modern Psychological Testing and Measurement. Agra: H. P. Bhargava Book House.
Bradlow, Eric T;Hoch, Stephen J. and Hutchinson, J. Wesley (2002). An assessment of basic computer proficiency among active Internet users: test construction, calibration, antecedents, and consequences. Journal of Educational and Behavioral Statistics.
Edwards, A. L. (1957). Techniques of Attitude Scale Construction. New York: Appleton-Century Crofts Inc.
Edwards, A. L. and Kilpatrick, F. P. (1948). A Technique for the Construction of Attitude Scales. Journal of Applied Psychology, 32, 374-384.
Garrett, H. E. and Woodworth, R. S. (2008). Statistics in Psychology and Education. New Delhi: Surjeet Publications.
Guilford, J. P. (1954). Psychometric Methods. New Delhi: Tata McGraw Hill Publications Co. Ltd. Koul, Lokesh (2009). Methodology of Educational Research (4th revised edition). New Delhi: Vikas
Publishing House Pvt. Ltd.
Likert, R. A. (1932). A Technique for the Measurement of Attitudes.Archives of Psychology, No. 140. Ogwu, Francis Joseph and Ogwu, Edna Nwanyiuzor (2012).Computer proficiency skills and
implication for curriculum transformation among fresh undergraduate of botswana university. International Journal of Computer Science Issues, 9(1), 384-390.
Copyright © 2017, Scholarly Research Journal for Interdisciplinary Studies
Thurstone, L. L. and Chave, E. J. (1929).The Measurement of Attitude. Chicago: The University of Chicago Press.
Wendy,James, and Nava, Subramaniam (2005) Course Websites, Computer Proficiency and Need for Achievement: Implications for MBA Student Performance. Australian Journal of Accounting
Education, 1(1).