ISSN 2250-3153
Combined Economic and Emission Dispatch Solution
Using ABC_PSO Hybrid Algorithm with Valve Point
Loading Effect
Emmanuel Dartey Manteaw*, Dr. Nicodemus Abungu Odero**
* University of Nairobi, Engineering Department. ** University of Nairobi, Engineering Department
Abstract- The problem of power system optimization has become a deciding factor in current power system engineering practice with emphasis on cost and emission reduction. The economic and emission dispatch problem has been addressed in this paper using two efficient optimization methods, Artificial Bee Colony (ABC) and Particle Swarm Optimization (PSO). A hybrid produced from these two algorithms is tested on a 10 generator test system with valve point effects. The results are compared with differential evolution (DE), Strength Pareto Evolutionary Algorithm (SPEA) and Non Sorting Genetic Algorithm (NSGA) and found to be effective on the combined economic and emission dispatch problem.
Index Terms- Economic and Emission Dispatch, Artificial Bee Colony, Particle Swarm Optimization, 10-Generator test system
I. INTRODUCTION
conomic Dispatch (ED) optimization is the most important issue which is to be taken into consideration in power systems. The problem of ED in power systems is to plan the power output for each devoted generator unit in such a way that the operating cost is minimized and simultaneously, matching load demand, power operating limits and maintaining stability. The total generator operating cost includes fuel, labor, supplies and maintenance costs. For simplicity we consider fuel cost as the only variable cost since generally the costs of labor, supplies and maintenance are fixed percentages of the fuel cost. Hence only thermal plants are considered in this research. Over the recent years there has been much research in the area of the combined economic and emission dispatch problem. Gopala Krishnan et al, 2011 [1] outlines a summary of techniques that have been applied so far to the combined economic and emission dispatch problem. The paper highlights new techniques which have been applied to the CEED problem from 2000-2010. It also highlights challenges faced by the use of traditional methods due to the non linearity of cost functions. It generally encourages the use of PSO. Biswajit Purkayasha et al, 2010 [2] aims at non dominated solutions in considering the multi-objective optimization problem of economic and emission dispatch using Non-dominated Sorting GA II. The result demonstrates it’s effectiveness in solving the multi-objective problem. It considers the cost of fuel, SOx and NOx. Celal Yasar et al, 2005 [3] uses the first order gradient method in solving the Combined Economic and Emission Dispatch problem. It has the advantage of easy control of constraints. Also all intermediate solutions are feasible for application to the power system. Anurag Gupta et al, 2012 [4] uses PSO on the combined economic and emission dispatch problem. It combines the two objectives into one using the price penalty function. It shows a better advantage in terms of cost, fast convergence, and less computational time than other heuristic methods like GA and dynamic programming. Also PSO gives efficient and high quality solutions with more stable convergence characteristics than the other heuristic methods afore mentioned. Lakshmi A. Devi et al, 2008 [5] uses the evolutionary programming method on the combined economic and emission dispatch problem. This paper proposes the use of the lambda in the evolutionary algorithm with the reason being that it makes the coding of the chromosomes independent on the number of units. Notably PSO generates a lower fuel cost and emission release but sometimes has a higher computational time than GA. Harry Rughooputh et al, 2005 [6] applies both deterministic and stochastic methods to the economic environmental problem. Ahmed Farag, 1995 [7] uses linear programming in addressing the multi-objective problem of the economic dispatch. It uses the constriction factor approach to handle the CEED problem. M. R. Alrashidi et al, 2008 [8] on the impact of loading conditions on the emission and economic dispatch problem uses weighting functions on the double objective of emission and fuel cost. It provides a simple way of addressing the equality constraint. The rule guiding the application of the weights to the objectives is not explicitly shown. Also this method is not applied to the CEED rather it optimizes the objectives independently. Gaurav Prasad et al, 2011 [9] applies a new technique called Artificial Bee Colony method (ABC) the economic load dispatch problem. In comparison to other heuristic methods it shows highly superior features like quality of solution, stable convergence characteristics and good computational efficiency. It does not consider the environmental or emission dispatch problem. Y. Sonmez et al, 2011 [10] applies the Artificial Bee Colony method to solve the multi-objective economic and environmental dispatch problem using the penalty factor approach. It is superior in comparison to the other heuristic methods and
more efficient. In this research work, exploration of the area of hybridizing PSO and the Artificial Bee Colony method and studies of its behavior in comparison with the other methods using the combined emission and economic dispatch problem was be done.
II. FORMULATION
MULTI OBJECTIVE DISPATCH PROBLEM
Here the main objective of the CEED problem is to minimize the two objectives given as fuel cost and emission simultaneously to ensure optimal output of generated power whilst satisfying the equality and inequality constraints.
Economy objectives
$/hr - (1)
Environmental Objectives
( ) lb/hr – (2)
Subject to equality and inequality constraints
Equality constraint
∑ = 0 - (3)
Where is real power by the generator , is total demanded load and is losses, where
∑ ∑ - (4)
Inequality constraints
- (5) The multi-objective economic and emission dispatch problem can be defined as
Min{ } - (6)
FORMULATION BY THE WEIGHTING FUNCTION METHOD AND CARDINAL PRIORITY RANKING METHOD
The weighting function method is applied in this research. The weighting function converts the multi-objective problem into a scalar optimization one [12]. Hence by the usage of the weighting function the objective function can be reformulated as:
- (7)
, where: ∑ ; n = number of objectives.
The best combined objective will be determined by the usage of the cardinal priority ranking method. The purpose of the cardinal priority ranking will be to generate non- inferior solutions through the normalized weights.
CARDINAL PRIORITY RANKING
The fuzzy sets are defined by equations called membership functions, which represent the goals of each objective function. The membership function represents the degree of achievement of the original objective function as a value between 0 and 1 with =1 as completely satisfactory and = 0 as unsatisfactory. Such a linear membership function represents the decision maker’s fuzzy goal of achievement, and at the same time scales the original objective functions with different physical units into a measure of 0-1. By taking account of the minimum and maximum values of each objective function together with the rate of increase of membership satisfaction, the decision maker must determine the membership function in a subjective manner given by:
ISSN 2250-3153
{
} - (8) { }
. The value of the membership function indicates how much (in the scale from 0 to 1) a non–inferior solution has satisfied the objective. The sum of the membership function values = 1, 2, … where is the number of objectives, for all the objectives can be computed in order to measure the ‘accomplishment’ of each solution in satisfying the objectives. The ‘accomplishment’ of each non-dominated solution can be rated with respect to all the M non-dominated solutions by normalizing its ‘accomplishment’ over the sum of the ‘accomplishment’ of the M non-dominated solutions as follows:
∑ ∑ ∑
- (9) . Hence from the accomplishments given by , a set of non dominated solutions will be arrived at, from which the maximum value was chosen as the best suited result [12].
PARTICLE SWARM OPTIMIZATION
The algorithm of PSO emulates from behavior of animals societies that don’t have any leader in their group or swarm, such as bird flocking and fish schooling. Typically, a flock of animal that have no leaders will find food by randomly, following one of the members of the group that has the closest position to a food source (potential solution). The flocks achieve their best condition simultaneously through communication among members who already have a better situation. This would happen repeatedly until the best conditions or a food source is discovered. The process of PSO algorithm in finding optimal values mimics the behavior of this animal society. Particle swarm optimization consists of a swarm of particles, where a particle represents a potential solution. [11]
Detailed pseudo-code of PSO algorithm:
1. A population of agents is created randomly.
2. Evaluate each particle’s position according to the objective function. In this case it is the total operational cost given by C for each particle and evaluate their fitness (i.e minimization of the objective function)
3. Cycle =1 4. Repeat
5. Update the velocity of the particles according to the formula
( ) ( ) - (10)
c = acceleration factor. r = random values between 1 and 0 6. Evaluate the velocity to ascertain if it is the range of
- (11) 7. Move particles to their new position
- (12) 8. Evaluate to ensure that limits have not been exceeded.
9. Compare the particle's fitness evaluation with its previous pbest. If the current value is better than the previous pbest, then set the pbest value equal to the current value and the pbest location equal to the current location in the N dimensional search space.
10. Compare the best current fitness evaluation with the population gbest. If the current value is better than the population gbest, then reset the gbest to the current best position and the fitness value to current fitness value. 11. Check if stopping criterion has been met. If not update the cycle and go back to step (5).
ARTIFICIAL BEE COLONY
In ABC algorithm, the solution of the optimization problem is represented by the location of a food source and the quality of the solution is represented by the nectar amount of the source (fitness). In the first step of ABC, the locations for the food source are produced randomly. In other words, for SN (the number of employed or onlooker bees) solutions, a randomly distributed initial population is produced. In the solution space, each solution ( ) is a vector on the scale of its number of optimization parameters [10].
Detailed pseudo-code of ABC algorithm:
1. Initialize the population of solutions ; i = 1, 2, . . . , SN. 2. Evaluate the population.
3. Cycle = 1. 4. Repeat
5. Produce new solutions for the employed bees by using (13) for evaluation:
( ) - (13)
6. Apply the greedy selection process for the employed bees. 7. Calculate the probability values, ,for the solutions of by:
∑ - (14)
8. Produce the new solutions of for the onlookers from the solutions of selected depending on and evaluating them. 9. Apply the selection process for the onlookers.
10. Determine the abandoned solution for the scout, if it exists, and replace it with a new randomly produced solution by:
( ) { } - (15)
11. Memorize the best solution achieved so far.
12. Cycle = cycle + 1.
13. Until the cycle = MCN (maximum cycle number)
ABC-PSO HYBRID ALGORITHM FOR COMBINED ECONOMIC AND EMISSION DISPATCH PROBLEM
In this method of hybridization, ABC runs till its stopping criterion, which in this case is the maximum number of iterations, is met. Then the optimal values of individuals generated by the ABC are given to the PSO as its starting point. Ordinarily the PSO randomly generates its first individual sets, but in this case of hybridization that is taken care of by providing the starting point for the Particle Swarm Optimization who are the final values for individuals generated by the Artificial Bee Colony.
PSEUDO-CODE Run ABC
Generate optimal values for all individuals
Pass these individuals to the PSO as starting points Run the PSO till stopping criterion is met
III. 10-GENERATOR TEST SYSTEM
ISSN 2250-3153
and 1, Maximum number of iterations = 1000, Population number= 15 individuals. Artificial Bee Colony control settings: Colony size = 30,Food Number =15, Limit of trials = 90,Maximum cycle Number = 500
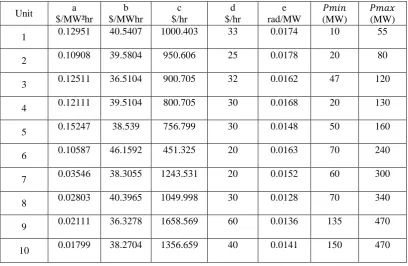
[image:5.595.94.503.137.403.2]Data for test system showing cost coefficients with valve point effect consideration (a to e), emission coefficients (α to δ) , in MW and in MW. Data was taken from M. Basu et al [13].
Table 1: Coefficients of fuel cost and capacities of the 10 generating units.
Unit a
$/MW²hr
b $/MWhr
c $/hr
d $/hr
e rad/MW
(MW)
(MW)
1 0.12951 40.5407 1000.403 33 0.0174 10 55
2 0.10908 39.5804 950.606 25 0.0178 20 80
3 0.12511 36.5104 900.705 32 0.0162 47 120
4 0.12111 39.5104 800.705 30 0.0168 20 130
5 0.15247 38.539 756.799 30 0.0148 50 160
6 0.10587 46.1592 451.325 20 0.0163 70 240
7 0.03546 38.3055 1243.531 20 0.0152 60 300
8 0.02803 40.3965 1049.998 30 0.0128 70 340
9 0.02111 36.3278 1658.569 60 0.0136 135 470
[image:5.595.142.456.462.645.2]10 0.01799 38.2704 1356.659 40 0.0141 150 470
Table 2: Coefficients of emission of the 10 generating units
Unit α
lb/MW²hr
β lb/MWhr
γ lb/hr
η lb/hr
δ 1/MW
1 0.04702 -3.9864 360.0012 0.25475 0.01234
2 0.04652 -3.9524 350.0012 0.25475 0.01234
3 0.04652 -3.9023 330.0056 0.25163 0.01215
4 0.04652 -3.9023 330.0056 0.25163 0.01215
5 0.0042 0.3277 13.8593 0.2497 0.012
6 0.0042 0.3277 13.8593 0.2497 0.012
7 0.0068 -0.5455 40.2699 0.248 0.0129
8 0.0068 -0.5455 40.2699 0.2499 0.01203
9 0.0046 -0.5112 42.8955 0.2547 0.01234
10 0.0046 -0.5112 42.8955 0.2547 0.01234
Table 3: loss coefficient matrix of the 10 generating units
B- coefficients
0.000049 0.000014 0.000015 0.000015 0.000016 0.000017 0.000017 0.000018 0.000019 0.00002
0.000014 0.000045 0.000016 0.000016 0.000017 0.000015 0.000015 0.000016 0.000018 0.000018
0.000015 0.000016 0.000039 0.00001 0.000012 0.000012 0.000014 0.000014 0.000016 0.000016
0.000015 0.000016 0.00001 0.00004 0.000014 0.00001 0.000011 0.000012 0.000014 0.000015
[image:5.595.45.575.687.782.2]0.000017 0.000015 0.000012 0.00001 0.000011 0.000036 0.000012 0.000012 0.000014 0.000015
0.000017 0.000015 0.000014 0.000011 0.000013 0.000012 0.000038 0.000016 0.000016 0.000018
0.000018 0.000016 0.000014 0.000012 0.000013 0.000012 0.000016 0.00004 0.000015 0.000016
0.000019 0.000018 0.000016 0.000014 0.000015 0.000014 0.000016 0.000015 0.000042 0.000019
0.00002 0.000018 0.000016 0.000015 0.000016 0.000015 0.000018 0.000016 0.000019 0.000044
IV. RESULTS AND DISCUSSIONS
The results from the hybrid ABC_PSO are compared with the results obtained by other methods used by other authors under equal loading conditions.
Economic Dispatch comparison
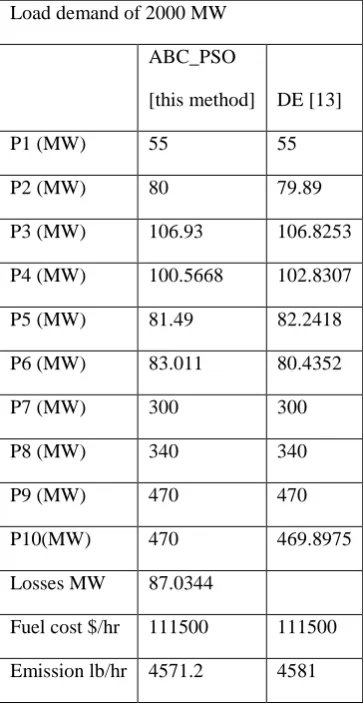
Table 4: Economic dispatch comparison for 10 generator test system at 2000MW demand
Load demand of 2000 MW
ABC_PSO
[this method] DE [13]
P1 (MW) 55 55
P2 (MW) 80 79.89
P3 (MW) 106.93 106.8253
P4 (MW) 100.5668 102.8307
P5 (MW) 81.49 82.2418
P6 (MW) 83.011 80.4352
P7 (MW) 300 300
P8 (MW) 340 340
P9 (MW) 470 470
P10(MW) 470 469.8975
Losses MW 87.0344
Fuel cost $/hr 111500 111500
Emission lb/hr 4571.2 4581
In comparison of the hybrid’s result with the DE, at the demand of 2000MW their fuel costs are comparable and equal but the hybrid yields a lower emission by 9.8lb/hr than the DE.
[image:6.595.207.389.247.602.2]Emission Dispatch comparison
Table 5: Economic dispatch comparison for 10 generator test system at 2000MW demand
Load demand of 2000 MW
ABC_PSO
ISSN 2250-3153
P1 (MW) 55 55
P2 (MW) 80 80
P3 (MW) 81.9604 80.5924
P4 (MW) 78.8216 81.0233
P5 (MW) 160 160
P6 (MW) 240 240
P7 (MW) 300 292.7434
P8 (MW) 292.78 299.1214
P9 (MW) 401.8478 394.5147
P10(MW) 391.2096 398.6383
Losses MW 81.5879
Fuel cost $/hr 116420 116400
Emission lb/hr 3932.3 3923.4
In the emission dispatch phase the hybrid yields greater fuel cost and emission than DE of 20$/hr and 8.9lb/hr respectively.
Combined Economic and Emission Dispatch comparison
Table 6:CEED comparison for 10 generator test system at 2000MW
Load demand of 2000 MW
ABC_PSO
[this method] DE [13] NSGA-II [13] SPEA-2 [13]
P1 (MW) 55 54.9487 51.9515 52.9761
P2 (MW) 80 74.5821 67.2584 72.813
P3 (MW) 81.14 79.4294 73.6879 78.1128
P4 (MW) 84.216 80.6875 91.3554 83.6088
P5 (MW) 138.3377 136.8551 134.0522 137.2432
P6 (MW) 167.5086 172.6393 174.9504 172.9188
P7 (MW) 296.8338 283.8233 289.435 287.2023
P8 (MW) 311.5824 316.3407 314.0556 326.4023
P9 (MW) 420.3363 448.5923 455.6978 448.8814
P10(MW) 449.1598 436.4287 431.8054 423.9025
Losses MW 84.1736
Emission lb/hr 4120.1 4124.9 4130.2 4109.1
Again the strength of the algorithm in the combined economic and emission dispatch problems is highlighted here. It yields a lower fuel cost of 60$/hr than DE, 120$/hr than NSGA and 100$/hr than SPEA-2. Its emission is also lower than DE by 4.8lb/hr, lower than NSGA by 10.1lb/hr but higher than SPEA-2 by 11lb/hr.
However generally considering the overall results the ABC-PSO yields a better Combined Economic and Emission dispatch than both GA and PSO.
Generally the hybrid performs well under the combined economic and emission dispatch problem than other optimization methods. It yields overall lower generation cost for optimum emission and fuel costs. It is evident that the proposed hybrid yields better overall combined economic and emission dispatch results in all instances tested. With the aim of this research being the area of the combined economic and emission dispatch, the hybrid satisfies the intended objective of better efficiency of the power system in general.
The method was subjected to different loading conditions and different test systems to ascertain its strength in the CEED problem. In all cases it can be said to be comparable in terms of results obtained and better in the multi-objective combined economic and emission dispatch optimization problem than all other methods it was compared with.
The hybrid so proposed makes use of the faster computational time of the PSO coupled with its convergence strength to implement the results yielded by the ABC in getting better near global solution. Hence the hybrid shows the following strengths:
Better ability to reach near global optimal solution
Quality solution
Stable convergence characteristics
Modeling flexibility.
It however shows the following weakness: High computational time.
These traits accounts for the results exhibited by the hybrid algorithm for the test cases implemented.
V. CONCLUSION
In conclusion this paper has formulated and implemented a hybridized PSO and ABC algorithm and has been shown to improve the optimization of the combined economic and emission dispatch problem. Though the proposed method shows efficiency than the algorithms it was compared with, its speed can be improved with the inclusion of mutation operators from other algorithms to improve its real time benefit.
REFERENCES
[1] Gopala Krishnan, A. Krishnan, “ Study on Techniques for Combined Economic and Emission Dispatch”, Global Journal of Researches in Engineering, Electrical and Electronical Engineering, Vol 11, Issue 5, Version 1.0, July 2011
[2] Biswajit Purkayastha, Nidul Sinha, “ Optimal Combined Economic and Emission load dispatch using modified NSGA II with adaptive crowding distance”, International Journal of information Technology and Knowledge management, July-December 2010, vol. 2 No 2, pp 553-59
[3]Celal Yasar, Salih Fadil, “ Solution to environmental/ economic dispatch problem by using first order gradient method”, 2005
[4] Anurag Gupta, K.K. Swarnka, Dr. S. Wadhwani, Dr. A.K. Wadhwani, “ combined Economic and Emission Dispatch problem of thermal generating units using Particle Swarm Optimization”, International Journal of Scientific and Research Publications, Vol 2, Issue 7, July 2012
[5] A. Lakshmi Devi , O. Vamsi Krishna, “ combined Economic and Emission dispatch using evolutionary algorithms- A case study”, ARPN Journal of engineering and applied sciences, Vol. 3, no 6, December 2008.
[6] Robert T. F., A.H. King, Harry C.S. Rughooputh, Kalyanmoy Deb, “ Evolutionary Multi objective Environmental/ economic dispatch, Stochastic versus Deterministic Approaches” , 2005
ISSN 2250-3153
[8] M.R. Alrashidi, M.E. El-Hawary, “ impact of loading conditions on the emission-economic dispatch”, World academy of science engineering and technology 39, 2008
[9]Gaurav Prasad Dixit, Hari Mohan Dubey, Manjaree Pandit, B.K. Panigrahi, “ Economic load dispatch using Artificial Bee Colony Optimization”, International Journal of Advances in Electronics Engineering, 2011
[10] Y. Sonmez, “ Multi-objective environmental/ economic dispatch solution with penalty factor using Artificial Bee Colony algorithm” , Scientific Research and Essays, Vol. 6 (13), pp 2824-2831, 4th July 2011
[11] G. Suganya, K Balamurugan, Dr. V. Dharmalingam, “ Multi-objective Evolutionary Programming Technique for Economic /Emission Load Dispatch”, IEEE International conference on Advances in Engineering Science and Management, March 30, 2012
[12] D. P. Kothari, J. S. Dhillon, “ Power System Optimization”, Second Edition, PHI Learning Private Ltd.
[13] M. Basu ,” Economic Environmental Dispatch Using multi-objective differential Evolution”, Elsevier Applied Soft Computing 11,(2011), pp 2845-2853
AUTHORS
First Author – Emmanuel Dartey Manteaw is an Msc. Student of University of
Nairobi.([email protected])