Middle and Secondary Education Dissertations Department of Middle and Secondary Education
Fall 12-21-2018
TIMSS 2015: Influences of Student and Classroom
Related Background Variables on Eighth-Grade
Mathematics Achievement in Asean+3 (APT)
Countries
Michael Nguyen-Quan
Georgia State University
Follow this and additional works at:https://scholarworks.gsu.edu/mse_diss
This Dissertation is brought to you for free and open access by the Department of Middle and Secondary Education at ScholarWorks @ Georgia State University. It has been accepted for inclusion in Middle and Secondary Education Dissertations by an authorized administrator of ScholarWorks @ Georgia State University. For more information, please [email protected].
Recommended Citation
Nguyen-Quan, Michael, "TIMSS 2015: Influences of Student and Classroom Related Background Variables on Eighth-Grade Mathematics Achievement in Asean+3 (APT) Countries." Dissertation, Georgia State University, 2018.
This dissertation, TIMSS 2015: INFLUENCES OF STUDENT AND CLASSROOM RELATED
BACKGROUND VARIABLES ON EIGHTH-GRADE MATHEMATICS ACHIEVEMENT IN
ASEAN+3 (APT) COUNTRIES, by MICHAEL NGUYEN-QUAN, was prepared under the
di-rection of the candidate’s Dissertation Advisory Committee. It is accepted by the committee
members in partial fulfillment of the requirements for the degree, Doctor of Philosophy, in the
College of Education and Human Development, Georgia State University.
The Dissertation Advisory Committee and the student’s Department Chairperson, as
representa-tives of the faculty, certify that this dissertation has met all standards of excellence and
scholar-ship as determined by the faculty.
_________________________ Iman Chahine, Ph.D.
Committee Chair
__________________________ ________________________ Audrey J. Leroux, Ph.D. Natalie King, Ph.D.
Committee Member Committee Member
__________________________ Pier Junor Clarke, Ph.D.
Committee Member
__________________________ Date
__________________________ Gertrude Tinker Sachs, Ph.D. Chairperson, Department of Middle and Secondary Education
__________________________ Paul A. Alberto, Ph.D.
By presenting this dissertation as a partial fulfillment of the requirements for the advanced
degree from Georgia State University, I agree that the library of Georgia State University shall
make it available for inspection and circulation in accordance with its regulations governing
materials of this type. I agree that permission to quote, to copy from, or to publish this
dissertation may be granted by the professor under whose direction it was written, by the College
of Education and Human Development’s Director of Graduate Studies, or by me. Such quoting,
copying, or publishing must be solely for scholarly purposes and will not involve potential
financial gain. It is understood that any copying from or publication of this dissertation which
involves potential financial gain will not be allowed without my written permission.
All dissertations deposited in the Georgia State University library must be used in accordance
with the stipulations prescribed by the author in the preceding statement. The author of this
dissertation is:
Michael Kiemhung Nguyen-Quan
Department of Middle and Secondary Education College of Education and Human Development
Georgia State University
The director of this dissertation is:
Iman Chahine, Ph.D.
Department of Middle and Secondary Education College of Education and Human Development
Michael Kiemhung Nguyen-Quan
ADDRESS: 1089 Ashwood Cir Lawrenceville, GA 30046
EDUCATION:
PROFESSIONAL EXPERIENCE:
2015-present Mathematics Teacher
Meadowcreek High School - GCPS
2013-2015 Gifted Mathematics Teacher
Forest Park High School - CCPS
2011-2013 Mathematics Teacher
Beach High School - SCCPS
PRESENTATIONS AND PUBLICATIONS:
Nguyen-Quan, M. (Submitted, Approved, and, Invited for March, 2016). The impact of classroom
performance system technology upon student motivation and achievement in the 11th
grade Advanced Algebra classrooms. Savannah, GA: The 27th Annual National
Youth-At-Risk Conference.
Ph.D. 2018 Georgia State University
Teaching and Learning
Education Specialist 2015 Georgia Southern University
Teaching and Learning
Masters Degree 2013 Georgia Southern University
Teaching and Learning
Bachelors Degree 2011 Clayton State University
upon student motivation and achievement in the 11th grade Advanced Algebra classrooms.
Columbus, GA: The 2015 Dr. Gregory Domin Research Conference (Domin Conference).
Columbus State University.
Nguyen-Quan, M. (October, 2015). The impact of classroom performance system technology
upon student motivation and achievement in the 11th grade Advanced Algebra classrooms.
Rock Eagle, GA: The Ninth Annual Meeting of the Georgia Association of Mathematics
Teacher Educators.
Nguyen-Quan, M. (October, 2015). Mathematical Modeling: A project based approach to family
functions. Rock Eagle, GA: The 2015 Georgia Mathematics Conference.
Nguyen-Quan, M. (April, 2015). The impact of classroom performance system technology upon
student motivation and achievement in the 11th grade Advanced Algebra classrooms.
Statesboro, GA: The 14th Annual Research Symposium on showcasing student and faculty
research across multiple disciplines. Georgia Southern University.
Nguyen-Quan, M. (2013). Unpublished Master’s Thesis, Georgia Southern University, College of
Education.
PROFESSIONAL SOCIETIES AND ORGANIZATIONS
2009 onward Georgia Council of Teachers of Mathematics
2009 onward Professional Association of Georgia Educators
VARIABLES ON EIGHTH-GRADE MATHEMATICS ACHIEVEMENT IN ASEAN+3 (APT)
COUNTRIES
by
MICHAEL KIEMHUNG NGUYEN-QUAN
Under the Direction of Iman Chahine, Ph.D.
ABSTRACT
Mathematics proficiency and achievement relate to a country’s future economy in many aspects.
The Trends in International Mathematics and Science Study (TIMSS) serves as an international
evaluation and comparison among the countries and nations around the globe. The mission of
TIMSS is to provide comparative data on mathematics and science achievement on fourth- and
eighth-grade students of participating countries and a collection of information in terms of
students’ school, teachers, and homes (Snyder, de Brey, & Dillow, 2016). While many Asian
countries remain as top performers, other Asian countries perform well below the international
average. Furthermore, a review of relevant and current literature on TIMSS assessments revealed
that a small number of participating countries would be further included in future studies
(George et al., 2016) to determine how student related, teacher and classroom related variables
influence student mathematics achievement on these international assessments. The purpose of
eighth-theoretical frameworks, the researcher rationalized and developd a conceptual framework to
answer a sub-set of research questions such as to what extent do student, and teacher/classroom
background variables influence eighth-grade mathematics scores across the seven Asian
countries. This study examined the variances within and between classrooms using several
different predictor variables for seven countries in the region, known as ASEAN Plus Three
(APT). The sample comprised of 42,221 eight grade students from APT countries, which include
Chinese Taipei, Hong Kong, Japan, Malaysia, Republic of Korea, Singapore, and Thailand. By
utilizing multilevel modeling, several HLM models were constructed to answer whether or not
predictor variables had any influences on student mathematics achievement. The study findings
provided strong evidence to support the perspectives that different countries have different
educational models that may work for one country but not the other.
VARIABLES ON EIGHTH-GRADE MATHEMATICS ACHIEVEMENT IN ASEAN+3 (APT)
COUNTRIES
by
MICHAEL KIEMHUNG NGUYEN-QUAN
A Dissertation
Presented in Partial Fulfillment of Requirements for the
Degree of
Doctor of Philosophy
in
Teaching and Learning
in
Department of Middle and Secondary Education
in
the College of Education and Human Development
Georgia State University
DEDICATION
This disseration is dearly dedicated to my family, and especially to my wife, Kinh Huynh, whose
ACKNOWLEDGMENTS
I would especially like to express my sincere gratitude to my dissertation committee, Dr.
Iman Chahine, Dr. Audrey J. Leroux, Dr. Natalie King, and Dr. Pier Junor Clarke. I appreciate
the countless hours that each committee member devoted to assisting me with my disseration. I
would also like to thank those who have helped me become who I am today and without them I
Table of Contents
LIST OF TABLES ... v
LIST OF FIGURES ... vi
1 THE PROBLEM ... 1
Research Questions ... 4
Study Rationale ... 5
A Review of Prospective Theoretical Frameworks ... 7
Rationale toward Developing an Adapted Conceptual Framework ... 15
Adapted and Comprehensive Conceptual Framework for Mathematics Achievement ... 17
Significance of the Study ... 19
Potential Limitations ... 20
Overview of the Study ... 21
2 REVIEW OF THE LITERATURE ... 22
TIMSS Research and Major Findings in the Seven APT Countries ... 23
Educational Reforms Based on TIMSS Results from 1995 to 2015 ... 40
Common Methodologies in Studies on TIMSS ... 44
Findings in Major Studies Employed Carroll’s Model of School Learning as Related to Student Learning in Mathematics ... 45
Chapter Summary ... 51
3 METHODOLOGY ... 53
Participants ... 54
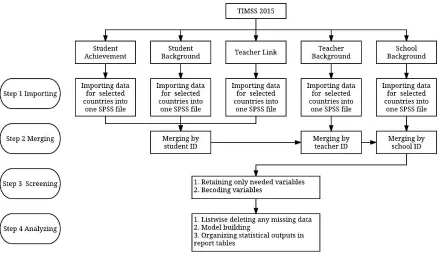
Procedures of Data Collection and Analysis ... 66
Reliability and Validity ... 77
Variables and Definitions of Terms ... 78
Chapter Summary ... 84
4 RESULTS ... 86
Results for Chinese Taipei ... 86
Results for Hong Kong ... 92
Results for Republic of Korea ... 100
Results for Japan ... 106
Results for Malaysia ... 113
Results for Singapore ... 119
Results for Thailand ... 125
Chapter Summary ... 132
5 DISCUSSION ... 136
Conclusions ... 136
Implications ... 146
Suggestions for Further Research ... 147
REFERENCES ... 149
APPENDICES ... 168
Appendix A ... 168
LIST OF TABLES
Table 2.1 ASEAN Plus Three Countries and Their Participation in TIMSS……….23
Table 3.1 Number of Eighth-Grade Students and Number of Nested Classroom in TIMSS 2015 by Country………55
Table 3.2 Education System from Seven APT Countries and Their Language of Instruction……64
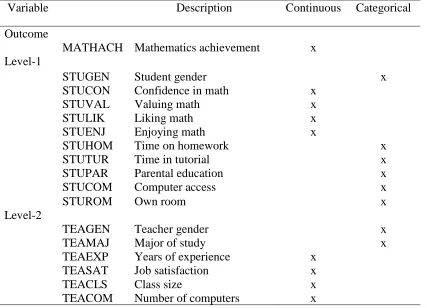
Table 3.3 Summary of Predictor and Outcome Variables from TIMSS 2015………...86
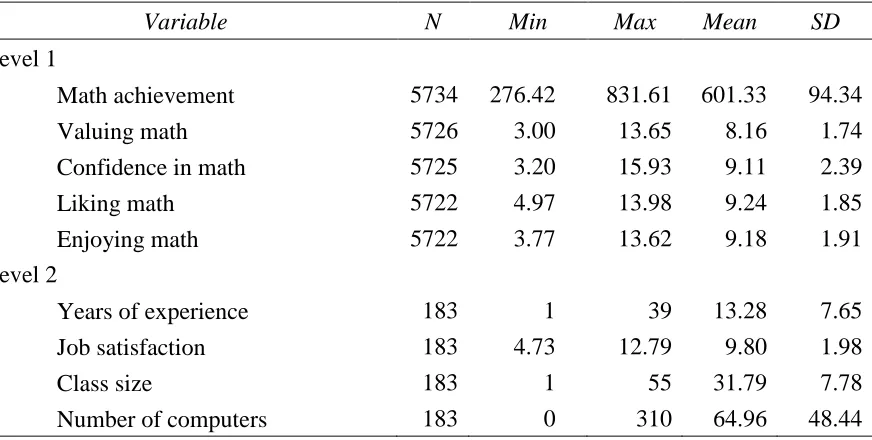
Table 4.1 Descriptive Statistics for Continuous Variables for Chinese Taipei……….88
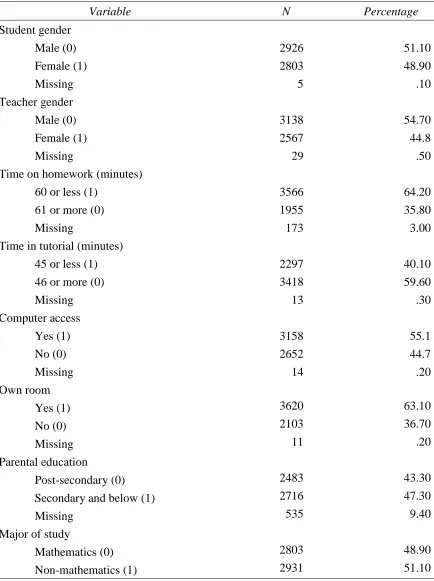
Table 4.2 Descriptive Statistics for Categorical Variables for Chinese Taipei………89
Table 4.3 Bivariate Relationships between Level-1 Variables for Chinese Taipei………..90
Table 4.4 Bivariate Relationships between Level-2 Predictor Variables for Chinese Taipei……91
Table 4.5 Parameter Estimates for Chinese Taipei………92
Table 4.6 Descriptive Statistics for Continuous Variables for Hong Kong………...95
Table 4.7 Descriptive Statistics for Categorical Variables for Hong Kong………..96
Table 4.8 Bivariate Relationships between Level-1 Variables for Hong Kong………97
Table 4.9 Bivariate Relationships between Level-2 Predictor Variables for Hong Kong………..98
Table 4.10 Parameter Estimates for Hong Kong………99
Table 4.11 Descriptive Statistics for Continuous Variables for Korea………102
Table 4.12 Descriptive Statistics for Categorical Variables for Korea………...103
Table 4.13 Bivariate Relationships between Level-1 Variables for Korea……….104
Table 4.14 Bivariate Relationships between Level-2 Predictor Variables for Korea…………...105
Table 4.15 Parameter Estimates for Korea………..….106
Table 4.16 Descriptive Statistics for Continuous Variables for Japan………...….109
Table 4.17 Descriptive Statistics for Categorical Variables for Japan……….…..110
Table 4.18 Bivariate Relationships between Level-1 Variables for Japan………...111
Table 4.19 Bivariate Relationships between Level-2 Predictor Variables for Japan….……..…112
Table 4.20 Parameter Estimates for Japan……….………..113
Table 4.21 Descriptive Statistics for Continuous Variables for Malaysia………..……115
Table 4.22 Descriptive Statistics for Categorical Variables for Malaysia……….….116
Table 4.23 Bivariate Relationships between Level-1 Variables for Malaysia………....117
Table 4.24 Bivariate Relationships between Level-2 Predictor Variables for Malaysia……..…118
Table 4.25 Parameter Estimates for Malaysia………..…...119
Table 4.26 Descriptive Statistics for Continuous Variables for Singapore……….………121
Table 4.27 Descriptive Statistics for Categorical Variables for Singapore………122
Table 4.28 Bivariate Relationships between Level-1 Variables for Singapore………..123
Table 4.29 Bivariate Relationships between Level-2 Predictor Variables for Singapore………124
Table 4.30 Parameter Estimates for Singapore………125
Table 4.31 Descriptive Statistics for Continuous Variables for Thailand……….…………..128
Table 4.32 Descriptive Statistics for Categorical Variables for Thailand………….……….129
Table 4.33 Bivariate Relationships between Level-1 Variables for Thailand………130
Table 4.34 Bivariate Relationships between Level-2 Predictor Variables for Thailand….…….131
Table 4.35 Parameter Estimates for Thailand……….…….132
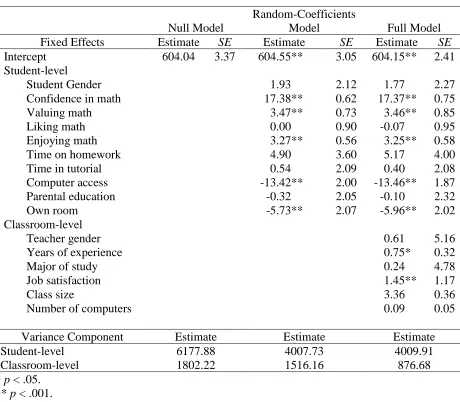
Table 4.36 Parameter Estimates for All Seven APT Countries……….136
LIST OF FIGURES
Figure 1.1 Carroll’s Model of School Learning (1963) – Adopted from Reeves (2011) with
permission ... 12
Figure 1.2. Hypothetical structure adopted by IEA in developing conceptual framework for TIMSS assessments (Zhao, 2011)... 16
Figure 1.3. Adapted and comprehensive conceptual framework ... 18
Figure 2.1. Average mathematics achievement for APT countries from 1995 to 2015 ... 23
Figure 2.2. Chinese Taipei average score vs. TIMSS scale score ... 25
Figure 2.3. Hong Kong average score vs. TIMSS scale score ... 26
Figure 2.4. Japanese average score vs. TIMSS scale score ... 27
Figure 2.5. Malaysian average score vs. TIMSS scale score ... 29
Figure 2.6. Republic of Korean average score vs. TIMSS scale score ... 30
Figure 2.7. Singapore average score vs. TIMSS scale score. ... 32
Figure 2.8. Thailand average score vs. TIMSS scale score. ... 34
1 THE PROBLEM
Mathematics proficiency and achievement can impact a country’s future economy (Baker
& LeTendre, 2005). Such influence is notable in many aspects, including the likelihood of how
students pursue postsecondary education, the ability of responsible citizens making adequate
come, and the capability a nation as a whole can compete in the global economy. Hence, the
in-terest to understand such factors that may have significant and consistent associations with
math-ematics achievement has been frequently shared among national leaders and policy makers in the
world. For that reason, various national and international assessments with mathematics and
sci-ence being the major domains have been developed and established. In fact, the Trends in
Inter-national Mathematics and Science Study (TIMSS) has become one of many interInter-national
assess-ments since 1995 with an average of 60 participating countries (TIMSS 1995). Since its first day
of development and establishment, TIMSS has been viewed as an international, collaborative,
and supportive joint effort among the participating countries. TIMSS data provide student
mathe-matics and science achievement scores and other contextual factors at the student,
teacher/class-room, and school levels (Mullis et al., 1997).
Furthermore, international large-scale assessments for student achievements are
consid-ered to play an important role in policy making, reforming, and globalizing of education.
Wil-liams (2015) argued that the start of international education could be dated back in time, but the
idea of creating and piloting a formal international assessment did not surface until after World
War II. According to Williams, because more nation-states ended up breaking and gaining their
independency from the European colonial empires, the political geography of the world changed;
hence, the development of international education became broader. Husen and Postlethwaite
and compared in 1959 to examine the feasibility of educational achievement with an extensive
support from the United Nations Educational, Scientific, and Cultural Organization (UNESCO).
The assessment was a joint effort of scholars who believed that there was a lack of
“internation-ally valid standards” to compare among the nations (De Landsheere, 1997). Led by Dr. W.D.
Wall of the National Foundation of Education Research in England and Wales (NFER), the first
international large-scale assessment, Pilot Twelve-Country Study, was developed with the
pur-pose of UNESCO’s promotion of “educational system cannot be transferred from one country to
another, but ideas, practices, and devices developed under one set of conditions can always prove
suggestive for improvement even where the conditions are somewhat different” (Kandel, 1959,
p. 253).
Originally, the first international assessment was created in French, English, and German.
It was then translated into five different languages (Finish, Hebrew, Polish, Serbo-Croatian, and
Swedish) for its participating countries. Created in 1959 and data collected in 1960, the Pilot
Twelve-County Study targeted 13-year-old students across 12 countries, including Belgium,
England, Finland, France, Federal Republic of Germany, Israel, Poland, Scotland, Sweden,
Swit-zerland, United States, and Yugoslavia. The assessment was categorized into five subject areas:
mathematics, reading comprehension, geography, science, and non-verbal ability. Students’
gen-der and parental background information were also collected in 1960. According to Foshay et al.
(1962) and later reaffirmed by Husen and Postlethwaite (1991), the assessment had two
particu-lar goals: (1) to determine appropriate suggestions of the rational operation behind responses to
such assessments from many countries, and (2) to explore the possible challenges attending
Husen and Postlethwaite (1991) proclaimed that for the next 50 years after the Pilot
Twelve-Country Study, another 29 international assessments of student achievement were
devel-oped and conducted by the International Association for the Evaluation of Educational
Achieve-ment (IEA), the International AssessAchieve-ment of Education Progress (IAEP), and the Organization
for Economic Cooperation and Development (OECD). These assessments have focused on a
va-riety of subjects including mathematics, science, and literacy. The student age was also expanded
to students who attend four, eight, and twelfth grades in many countries globally. Additionally,
there was an increasing number of participating countries over the 50-year period. According to
IEA (2007), the number of countries that participated in the international assessment for student
achievement has increased from 12 in 1960, to 19 in 1970, to 24 in 1980, to 46 in 1990, and to
over 60 in 2000. Its popularity and the need to have an international educational measurement
have quickly become a new trend worldwide.
The Institute of Education Sciences with the support of OECD, the Program for
Interna-tional Student Assessment (PISA) began in 2000 and continues its administration every three
years (OECD, 2004, 2005). The target population is 15-year-old students and their proficiencies
in reading, mathematics, and science literacy with emphasis on the problem solving skills and
their competencies in solving problems. In 2001, the Progress in International Reading Literacy
Study (PIRLS) started its first development and appearance and continues to be administered
every five years. The assessment’s main focus is to evaluate reading literacy of fourth-grade
stu-dents. It is worth mentioning that out of the 29 international assessments developed and
Of those 13 mathematics related assessments, the first Trends in International
Mathemat-ics and Science Study (TIMSS) was established and piloted in 1995 and continues to be
adminis-tered every four years. The mission of TIMSS is to provide comparative data on mathematics
and science achievement on fourth- and eighth-grade students of participating countries and a
collection of information in terms of students’ school, teachers, and homes (Snyder, de Brey, &
Dillow, 2016). With its administration in 2007, and with 60 countries participating in the study,
TIMSS has become one of the largest and most aspiring international assessments of student
achievement in the history of international assessments. Unlike PISA, TIMSS specifically
con-centrates on the grade-specific structure and educational curriculum. In fact, more than 90% of
the items in TIMSS were matched with the majority of the participating countries’ curricula. The
details of such process was presented in TIMSS 2007 reports:
... Participants provided information about various educational policies and the
curricu-lum topics covered in their respective curricucurricu-lum guidelines (intended curricucurricu-lum).
Inclu-sion in the country’s curriculum, however, does not guarantee students’ opportunity to
learn. Just as important is what their teachers choose to teach them. The lessons provided
by the teachers ultimately determine the mathematics students are taught (implemented
curriculum) (Mullis, Martin, & Foy, 2008, p. 189).
Research Questions
Given the historical development of the international evaluation of educational
assess-ment and the TIMSS goals and mission, and with the high success rate of ASEAN countries over
multiple implementations particularly in mathematics, it would be of interest to examine the
in-fluences of eighth-grade mathematics achievement in the latest TIMSS 2015 in seven countries,
models for each individual country will be constructed by employing the contextual and
back-ground variables at the student and teacher/classroom levels to explain the variance within and
between classrooms. The research attempted to answer the following sub-set of research
ques-tions:
1. To what extent do student background variables, including student gender,
self-confi-dence in learning mathematics, valuing of learning mathematics, liking of learning
math-ematics, enjoying learning mathmath-ematics, time spent on homework, and time spent in
tuto-rial, influence eighth-grade mathematics scores from TIMSS 2015 across the seven APT
countries?
2. To what extent do student home resources, including computer access, parental highest
educational background, and having their own room to study, influence eighth-grade
mathematics scores from TIMSS 2015 across the seven APT countries?
3. To what extent do teacher characteristics, including gender, years of experience, major of
study, job satisfaction, and class size influence eighth-grade mathematics scores from
TIMSS 2015 across the seven APT countries?
4. To what extent do classroom characteristics, including total number of computers,
influ-ence eighth-grade mathematics scores from TIMSS 2015 across the seven APT
coun-tries?
Study Rationale
Review of relevant and current literature on TIMSS assessments revealed that a small
number of the participating countries would be further included in future studies to examine the
influence of student and teacher variable upon student mathematics achievement. The existing
the Southeast Asian region such as Hong Kong, Japan, and Singapore (Greenwood et al., 2016).
In fact, results of eighth-grade mathematics in TIMSS 2015 showed that Southeast Asian
coun-tries “widened global advantage in mathematics achievement” (IEA, 2016, p. 2). Such bias
pre-sented in the international achievement studies would later result in misinterpreting the research
findings and creating students’ stereotypes among the countries in the same region. As a
conse-quence, the lack of research findings has led other countries in the region and around the world
to establish their educational policy decisions and implement educational reforms on research
findings and educational models of Hong Kong, Japan, and Singapore.
Furthermore, the Chairman of the 16th APT Summit (2013) stated that East Asia region
worked toward the “implementation of the ASEAN Plus Three Plan of Action on Education
(2010-2017), which would help strengthen education cooperation and human resource
develop-ment” (p. 4). In order to work toward this collaborative plan, each APT country member will
need to evaluate its education policies and its educational reforms to meet the action’s guidelines
from the K-12 setting to higher education. Hence, such examinations of the APT countries’
TIMSS mathematics scores are needed to determine how students of individual country
per-formed as compared to their peers in the same region. Also, there is a need to examine how
stu-dent and teacher background variables had influenced stustu-dent mathematics achievement score in
each individual APT country so that those APT countries can possibly develop a revised and
im-proved Plan of Actions on Education for its members.
In essence, it is pivotal to examine how student-, classroom-, and school-related
back-ground variables influence eighth-grade mathematics scores from TIMSS 2015 data reports. In
classrooms in each APT country. The study rationale has two folds. The first aspect is to find
an-swers to pre-existing research questions that examine how APT countries performed in TIMSS
2015 using related background variables at two levels. However, the more important task, which
is the second fold, is to resolve the research issue of focusing on high performing countries and
spending little to no attention to low performing countries in TIMSS assessments.
Hence, the main focus of this proposed study was to delineate the influences of
eighth-grade mathematics achievement in TIMSS 2015 in seven Asian countries. More specifically, a
se-ries of two-level models for each individual country would be constructed by employing
hierar-chical linear modeling using student- and classroom-related variables to explain the variance
within and between classrooms. In all, the purpose of the study was to examine how student- and
classroom-related background variables influence eighth-grade mathematics scores in TIMSS
2015.
A Review of Prospective Theoretical Frameworks
In studies of international assessments, several theoretical frameworks have been proposed
and utilized to explore and explain any direct or indirect influences on student achievement. The
most common frameworks employed include Carroll’s (1963, 1989) Model of School Learning,
Walberg’s (1981) Theory of Educational Productivity, Creemers’s (1994, 2007) Educational
Ef-fectiveness Model, and DiPerna and Elliott’s (2002a) Model of Academic Competence. DiPerna et
al. (2002b) asserted that the aforementioned frameworks share three underlying aspects: taking
into account the learners’ characteristics, focusing on learning environment, and centering on the
quality of instruction delivery. Furthermore, many studies have suggested that a substantial
varia-bility in student performances depends on different cognitive and non-cognitive learner
(2009) argued that the relationship between time spent in learning, quality of instruction, and
stu-dent achievement has been one of many debatable topics in the field of education.
Briefly, a review of conceptual frameworks that underlie international assessment studies
shows a holistic concept of student and classroom variables along with any direct or indirect
ef-fects on student achievement scores. More specifically, exploring the historical and
epistemologi-cal development of Carroll’s (1963) Model of School Learning allows me to present and provide
the rationale why Carroll’s model is being utilized and its relevance to the proposed study. I also
examine the tenets of Carroll’s model in relation to student learning in order to conceptualize an
adapted model that will fit this study’s purpose.
A framework provides the definition of each element in the assessments. It is a theoretical
understanding that acts as a foundation to the interpretation of results and findings in any research
analyses. There are several theoretical and conceptual frameworks underlying the international
assessments; however, I highlight a few that play an important role in shaping the study’s
concep-tual framework later.
Walberg’s (1981) Theory of Educational Productivity. Developed by Walberg and his
colleagues, Theory of Education Productivity is one of the first comprehensive models to examine
what influences learning. The theory is a joint collaboration in the early 1980s. As Reynolds and
Walberg (1992) asserted that the theory provided unambiguous factors that were projected to have
impacts on learning outcomes. In 1987, Fraser et al., proposed three sets of nine factors that are
utilized to hypothesize improvement on student achievement. The first set focuses on student
apti-tude-attribute factors, including (a) student age, (b) student motivation measured by personality
factors, including (d) quality of instruction, and (e) quantity of instruction. The third set
empha-sizes on factors that stimulate educational experiences, such as (f) student home environment, and
(g) classroom and school learning environment. Having said that, Walberg’s model clearly
indi-cates a difference between three sets of factors: student level, instructional level, and learning
en-vironment level. In that vein, Walberg’s model could dictate the interpretations of this study’s
findings; however, TIMSS data reports do not fully address a full-scale of school level factors.
Thus, other theoretical frameworks are explored in order to capture a full picture of how student
and classroom variables influence student mathematics achievement in ASEAN+3 countries.
Creemer’s (1994) Educational Effectiveness Model. Similar to Walberg’s Theory of
Edu-cational Productivity, Creemers’s (1994) model leans toward a nested hierarchical structure which
focuses on four levels, including student level, classroom level, school level, and the context
level. The purpose of Educational Effectiveness Model is to examine the impact of social
eco-nomical background (SES) on student’s achievement. In fact, Creemers et al. explore the direct
and unidimensional connection between SES and achievement. While Walberg’s and Creemers’s
models represent the hierarchical modeling level, Creemers’s model integrates a cross level
inter-actions between the levels and factors which Walberg does not address. However, Creemers’s
Ed-ucational Effectiveness Model does not fit into the purpose of this study due to the assumption
underlying which exerts a mutual effect of classroom- and school-level variables on student
achievement. In other words, the model concentrates more on an educational perspective on
stu-dent achievement by suggesting different factors have a role in influencing the learner’s
perfor-mance. For that reason, it is incompatible with the study’s purpose to examine the influences of
DiPerna and Elliott’s (2002) Model of Academic Competence. Developed and built from
the work of Carroll and Walberg, DiPerna et al. (2002; 2005) suggested and examined a model of
student achievement using various academic background variables, such as (a) student
interper-sonal skills, (b) student motivation, (c) student study skills, and (d) student engagement.
Accord-ing to the authors, those variables are identified as non-academic skills that can impact student
ac-ademic success. DiPerna et al. utilize those four student related factors in conjunction with
stu-dent’s prior achievement to predict student achievement. To that extent, it is impossible to utilize
DiPerna and Elliot’s (2002) Model of Academic Competence as a conceptual framework to
exam-ine and interpret the findings from TIMSS 2015. It is because TIMSS data sets do not provide
learners’ prior achievement scores from each participating country.
In all, to examine the influences of student and classroom related background variables to
eighth-grade mathematics achievement in ASEAN+3 countries, I use John Carroll’s (1963,
1989) Model of School Learning. While this model describes learning as a function of aptitude,
opportunity to learn, quality of instruction, and the amount of time the student is willing to spend
on learning, student-related background variables collected from TIMSS 2015 are categorized
into only two measures: student-related background and student home resources. This prevents
the analysis of student achievement in terms of those four factors that Carroll’s model proposed.
Therefore, the next few paragraphs are to present the historical and epistemological development
of Carroll’s model. Doing so, in turn, I will provide the rationale why Carroll’s model will be
used as a guide to formulate a new conceptual framework which will allow the interpretation of
the effects of student-, classroom-, and school-related background variables on eighth-grade
Historical and Epistemological Development of Carroll’s (1963, 1989) Model of School
Learning. Developed and published in 1963, Model of School Learning consists of five different variable categories in learning, including aptitudes, opportunity to learn, perseverance, quality of
instruction, and ability to understand instruction that help explain variations in student
achieve-ment. Carroll pronounces the constructs in school learnings are relevant to time. He believes that
time plays a pivotal role in school learning. He theorizes and presents the model in a simple
equation: school learning = f((time spent)/(time needed)). In this equation, school learning is
clearly a function of the quotient between the time the learners actually spent learning to the
amount of time they needed to learn in consideration of the quality of instruction and the
stu-dent’s ability to understand such instruction. In other words, Carroll explains that school learning
is a function of time. In fact, time spent is the outcome of opportunity and perseverance
(McIl-rath & Huitt, 1995). Theoretically, the underlying assumption in this model is students will
even-tually master the concepts when they are given the time and when they are willing to devote the
time needed to learn. In other words, Carroll proposed that the time spending on learning will
de-termine how successful the learner will be.
Figure 1.1 depicted how Carroll’s modeling of school learning is, in fact, “a
quasi-mathe-matical one in which three of the five classes of variables that explain variance in school
achievement are expressed in term of time” (Reeves, 2011). Those five factors are associated
with student success or failure in learning including: (1) aptitude-the amount of time needed to
learn under finest instructional conditions, (2) ability to master the concept, (3) perseverance-the
amount of time the student engage in active learning, (4) opportunity to learn, and (5) quality of
and perseverance are connected to students while the other two factors are more externally
re-lated.
Figure 1.1 Carroll’s Model of School Learning (1963) – Adopted from Reeves (2011) with
per-mission.
The first tenet in Carroll’s model is about aptitude which is defined as the “variable or
var-iables that determine the amount of time a student needs to learn a given task, unit of instruction,
or curriculum to an acceptable criterion or mastery under optimal conditions of instruction and
motivation” (p. 18). Carroll asserts that aptitude may be influenced by other factors such as prior
learning experience or genetically individual traits. However, Carroll does not believe aptitude is
defined by prior knowledge but rather as time needed to learn a concept or task. Moreover, the
au-thor considers student need for time to learn is independent from teacher’s related variables or the
learning environment.
The second tenet in Carroll’s model is about the opportunity to learn. Carroll (1963, 1989)
asserts that opportunity to learn as time allowed for students to learn. He believes that this is one
of a few constructs being neglected by schools. Given the aptitude construct, Carroll deliberates
that opportunity to learn is often offered less than what is required in learning. He offers an
schools expect teachers to teach and students to learn. Moreover, Carroll claims that because of
the allotment of uniform in timing for learning and the ability of groupings in public education,
schools have ignored the need for students to progress at their own pace.
In Model of School Learning, Carroll (1963, 1989) defines the third tenet, perseverance, as
“the amount of time a student is willing to spend on learning the task or unit of instruction” (p.
18). In other words, perseverance is referred to the time student completes the task whether or not
a long period of time or a short period of time. Taking into account of student’s aptitude in
learn-ing, he or she may require a short amount of time to learn in a given task but may not take the
necessary time to learn the information; Carroll (1985) refers this variable as
perseverance-in-learning-to-criterion. Having said that, perseverance can be perceived as an operational
descrip-tion of intrinsic motivadescrip-tion (Carroll, 1989).
The fourth tenet in Carroll’s model is about the quality of instruction as determined by
how well the instructor prepares, organizes, and presents the instructional task to the learners
(Carroll, 1985). With regards to student’s aptitude, Carroll believes that high quality instruction
should be organized and presented to students in such a way that they can learn as quickly and as
efficiently as possible. On the other hand, if the task requires more time to learn, it is more likely
viewed as an optimal quality of instruction. The Model of School Learning (Carroll 1963, 1989)
does not specify what characterizes a high quality of instruction, but Carroll asserts that students
must be explicitly told what will be learned, have sufficient contact with the learning materials,
and most importantly the steps in teaching and learning need to be carefully planned and
orga-nized.
The last tenet in Carroll’s model addresses the student’s ability to understand instruction.
task to be learned. Furthermore, it is also the ability to grasp the language of the instruction.
While Model of School Learning (1963, 1989) specifies how student’s ability to understand
in-struction can be measured using a combination of student general intelligence and verbal ability;
however, Carroll does not postulate how these variables are being constructed in the model.
As defined by Carroll (1963, 1989), to achieve a particular learning target, all five variable
categories in learning are related to time. However, the first three categories are directly expressed
as the amount of time while the last two categories signify the amount of time the learners need to
achieve a learning task. Carroll’s creation of the model is to confirm the differences in each
indi-vidual student and how these differences influence his or her ability to learn and the time it takes
to master the task at hand. Keith (2002) stated the model was developed as a multivariate and
ex-planatory model of how student achievement occurs. Carroll (1989) continues to refine the Model
of School Learning by examining three other variables, including time on task, academic learning
time, and quantity of instruction. In that vein, several studies have continued to examine the
re-finement of Carroll’s model with add-on variables (Ma & Wang, 2001; Reynold & Walberg,
1992).
Speaking of how Carroll’s model progresses through the years, after twenty-five years of
his first published work, Carroll (1989) reviews and discusses the time factor as being one of the
most mystifying complications for and against the model he had established which others had
considered as mastery learning. He believes that each individual learner needs different amount
of time to learn and the concept of mastery learning would increase the amount of time needed
for teaching and learning. Carroll writes, “educational psychology as a science still has no
students with different aptitudes” (p. 27). What he means is there is no one-size fits all in
educa-tion which learning and instruceduca-tion are jam-packed together so every single student will be
taught in the same approach. Carroll then asserts that even when time differs for the students, a
“clear specification of the task to be learned” (p. 28) needs to be constant in such cases. In
the-ory, Carroll’s model sets a foundation for other researchers to continue examining the influences
of set learning standards and the time allowance for student learning to student achievement
(Bloom, 1974, 1976; Guskey & Gates, 1986; Pink, 2009).
Rationale toward Developing an Adapted Conceptual Framework
It can be argued that Walberg’s (1981) and his Theory of Educational Productivity could
be utilized as a backbone of this study; however, because of how TIMSS data are collected and
configured for all participating countries, limited information can be gathered at the school-level
variables. On the other hand, DiPerna and Elliot’s (2002) focuses on student’s prior achievement
score, and TIMSS data lack this information. Although Creemers’s conceptual framework is
used in the development of TIMSS assessments, the underlying concept of mutual relationships
between classroom- and school-levels on student achievement defeats the study’s purpose to
ex-amine the influences of student-, and classroom-level variables to eighth-grade mathematics
achievement score in TIMSS 2015.
With TIMSS being an international assessment and focusing on mathematics and science
at the fourth- and eighth-grade, Carroll’s model does not fully address the issue of teaching and
learning mathematics. Carroll developed Model of School Learning with a focus on foreign
lan-guage learning rather than mathematics. Hence, to find a model compatible with the study’s
pur-pose and TIMSS variables requires an adapted conceptual model that mirrors Carroll’s to
in student achievement scores. In combination between Carroll’s Model of School Learning and
the hypothetical structure (Figure 1.2) which is adopted by TIMSS, I constructed a conceptual
framework that serves as a conceptual framework for this proposed study. Zhao (2011) utilized
TIMSS handbook to define school input and school environment as the external factors
(curric-ula, educational policies, and resources) that ultimately trickle down and dictate what the
educa-tional process (teaching and learning), both school level and classroom level, will be. As cited in
TIMSS handbook, “school’s environment and organization can influence the ease and
effective-ness of reaching curricular goals” (p. 75).
Figure 1.2. Hypothetical structure adopted by IEA in developing conceptual framework for
TIMSS assessments (Zhao, 2011).
Reviews of several theoretical and empirical frameworks provide historical and
epistemo-logical backgrounds allow me to develop my own adapted conceptual framework in this study.
In all, these models have been examined and tested to reflect the historical thinking of what
fac-tors influence student learning and achievement. To that extent, the adapted model will follow
the same key characteristics that are found in those earlier frameworks as described in the
(a) a model needs to include different variables related to student biological and
cognitive development;
(b) the related variables need to be structured at different levels and nested;
(c) individuals respond to the context in the learning environment;
(d) learning process should support student development in terms of the related
variables.
In the following section, I constructed a conceptual framework for this proposed study
using the four key features listed above in combination with Carroll’s Model of School Learning.
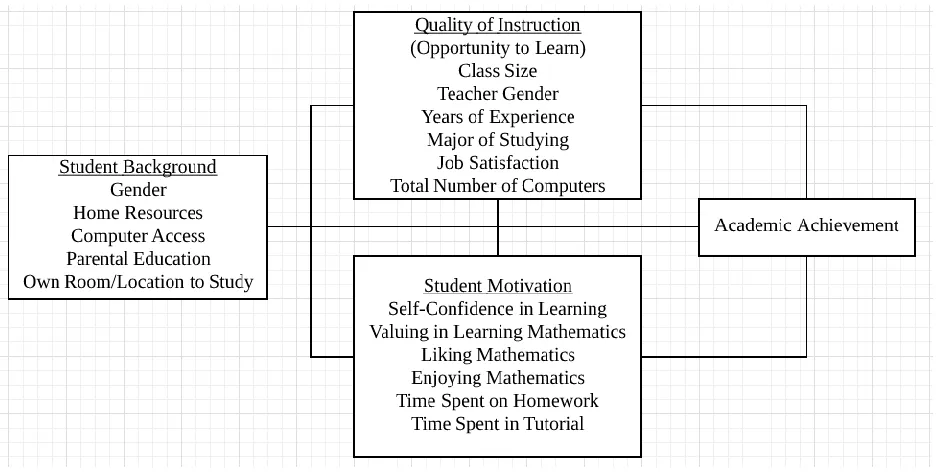
Adapted and Comprehensive Conceptual Framework for Mathematics Achievement
Using the four key characteristics of available models in the literature, the adapted
con-ceptual framework will consist of three levels with student-level variables related to their
back-ground (e.g. gender, computer access at home, parental education, their own room/location for
studying) and motivation (e.g. self-confidence in mathematics, valuing in learning mathematics,
time spent on homework, time spent in tutorial, enjoying learning mathematics, and liking
math-ematics), teacher/classroom-level variables related to the quality of instruction, including: the
teachers’ gender, years of experience, major of study, job satisfaction, class size, and
school-level variable related to opportunity, including the number of computers available in the
class-room. Explained later in chapter three, the number of computers available (school-level) would
be considered as the classroom-level in the analyses. Figure 1.3 depicts the adapted and
compre-hensive conceptual framework that will serve as a back-bone in interpretation of results and
mul-tiple levels and TIMSS data provide a numerous rich information in terms of student- and
class-room-related variables, the selected variables in building the structure of the adapted model
pre-sented in Figure 1.3 need to reflect “what works” in teaching and learning mathematics
(Carpen-ter et al., 1999). Furthermore, the review and analysis of the li(Carpen-terature provide a grounding
argu-ment as to which variables will be selected to examine the influences of student- and
[image:34.612.74.542.235.472.2]classroom-related variables to student achievement.
Figure 1.3. Adapted and comprehensive conceptual framework.
At the individual student level, biological and background variables play a pivotal role in
examining the impacts upon the learner’s achievement. Many studies have shown gender
(Bas-sey, Joshua, & Asim, 2011; Chowa et al., 2013; Frempong, 2010; Neuschmidt, Bart, & Hastedt,
2008), home resources with computer access (Baker, Goesling, & LeTendre, 2002; Crane, 2001;
O’Dwyer, 2005; Veenstra & Kuyper, 2004; White, 1982; Yang, 2003), parental education
(Else-Quest, Hyde, & Linn, 2010; Goforth et al., 2014; Pangeni, 2014; Phan & Kromrey, 2007; Yang,
2003), and own place to study (Yang, 2003) predict a positive correlation with student
student mathematics achievement. In that vein, Stevenson, Lee, and Stigler (1986) had showed
how much time students spend on homework and in tutorial learning mathematics can impact the
student outcome.
As for classroom level variables, Stevenson and Lee (1995) suggested that teacher
qual-ity, in fact, plays an important role in predicting student mathematics achievement. In the context
of this proposed study, teacher gender (Beilock et al., 2010), years of experience in teaching,
ma-jor studying, job satisfaction in combination with class size and the number of total computers in
the classroom will serve as relevant variables in adapting a comprehensive conceptual
frame-work.
Significance of the Study
Regardless of its limitations, it is expected that the examination of correlates of
mathematics achievement in these ASEAN+3 countries would contribute significant set of
findings to the field of educational research. Moreover, the analyses to determine the influences
of mathematics achievements using individual rather than between countries data produced more
country-specific research results for eighth-grade students. In sum, I argue that findings from this
study may provide strong evidence to support the perspectives that different countries have
different educational models that may work for one country and not the other. The optimistic
expectation is for other researchers to replicate this research interest with different countries in
other region that participated in TIMSS 2015 assessment or with other large-scale international
achievement data set. Furthermore, the findings from this study can be used to prepare other
participating countries for such international assessments. At the same time, the results can also
The examination of TIMSS 2015 database in this study may not fully answer the gap in
literature, but rather be the first step in studying the eighth-grade mathematics achievement and
the impact of student and classroom related background variables in seven APT countries. The
purpose is to determine the variations in performance among those countries in the same region.
While much of the comparative international studies have focused on the comparisons of means
and medians among the participating countries, the intention of this study is focused on
explor-ing the correlates of achievement at both student and aggregated levels (Bielick, Chandler, &
Broughman, 2001).
Potential Limitations
Due to an international collection of data in 57 countries and seven benchmark entities,
sampling methods (two-stage, stratified, and unequal probability), assessment design, and
non-responses from students, the accuracy of the study results could be negatively affected when
dealing with listwise deletion not at random. Moreover, this study examined the secondary data
set from TIMSS 2015, the analyses of the data and the intepretations are limited to TIMSS
database. TIMSS 2015 does not typically provide students’ past achievement or aptitude scores.
Hence, it is not possible to make a connection between the variables selected for this study.
Additionally, some of the student related variables were collapsed to create dichotomous
variables for ease of the interpretations and in line with the current literure, there exist limitations
in addressing and answering the influences of these predictors upon the student mathematics
achievement score. Last but not least, data collected for TIMSS 2015 were self-reported by
students and teachers. Consequently, there exist various possibilities of bias including but not
limited to selective memory, telescoping, and social desirability (Rosenberg, Greenfield, &
Overview of the Study
The study utilized the data from the Trends in International Mathematics and Science
Study (TIMSS, 2015) that was conducted by the International Association for the Evaluation of
Educational Achievement (IEA) and maintained by the National Center for Education Statistics
(NCSE). TIMSS 2015 comprised of student achievement scores in mathematics and science as
well as student, teacher/classroom, school, and other background statistics for more than 580,000
participated students in fourth- and eighth-grade from 57 countries and seven benchmarking
enti-ties (IEA, 2016). More specially, the eighth-grade mathematics achievement scores, student
de-mographic background and home resources, mathematics teacher background, and classroom
2 REVIEW OF THE LITERATURE
Many believed that teaching and learning take place in the classroom and also depend on
many factors. Researchers have found the process taken place in the classroom later become
situ-ated in school (Leung et al., 2006; Mullis et al., 2004). To that extent, there are several studies to
examine how much of the variance in student performance contributes to school- and
classroom-level differences. By using relevant factors, the proportion of variance at each classroom-level is explained
in those studies. For example, student mathematics self-concept (Kiamanesh, 2004a, 2004b;
Mullis et al., 1997; Mullis et al., 2000; Papanastasiou, 2008; Wilkins, 2004), attitude towards
mathematics (Cooper et al., 2001; Goodykoontz, 2008; Kiamanesh, 2006), home educational
re-sources (Bos & Kuiper, 1999; Fullarton, 2004; Howie, 2003; Kiamanesh & Mahdavi, 2008) were
being used to examine and analyze. In all, findings indicated that there exists a positive
associa-tion between student mathematics achievement with student self-concept and attitude towards
mathematics. At the classroom- and school-level factors such as school location (Chepete, 2008),
school climate (Mullis et al., 1998; Mullis et al., 2012), and school resources for mathematics
(Ramírez, 2006) were also observed. The results displayed that there occurs a positive
connec-tion between student performance score with the school locaconnec-tion and school climate.
This chapter will include four sections: (1) TIMSS research and major findings for seven
APT countries in four period timeframe: 1995-2003, 2007, 2011, and 2015; (2) educational
re-forms based on the results of TIMSS 1999-2015; (3) common methodologies in TIMSS; and (4)
findings in major studies employed Carroll’s Model of School Learning as related to student
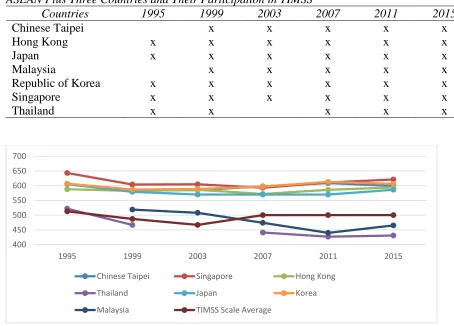
learning in mathematics. Table 2.1 listed all seven APT countries and the years they participated
in TIMSS with the exception of no recorded data for Chinese Taipei and Malaysia in 1995, and
1995 administration while Thailand scores were not available in 2003 (Martin et al., 2004).
Fol-lowing Table 2.1 is Figure 2.1 which presented the average mathematics achievement scores for
[image:39.612.66.520.187.513.2]all seven APT countries since its first administration of 1995.
Table 2.1
ASEAN Plus Three Countries and Their Participation in TIMSS
Countries 1995 1999 2003 2007 2011 2015
Chinese Taipei x x x x x
Hong Kong x x x x x x
Japan x x x x x x
Malaysia x x x x x
Republic of Korea x x x x x x
Singapore x x x x x x
Thailand x x x x x
Figure 2.1. Average mathematics achievement for APT countries from 1995 to 2015.
TIMSS Research and Major Findings in the Seven APT Countries
Kellaghan (1996) argued that international comparative studies allowed legislatives to
make appropriate resolutions based on the examinations of the correlates of achievement from
different educational systems. However, Stedman (1997) asserted that the achievement from
var-ious countries would not be mutually comparable because of bias in choosing samples, different
curricula among the participating countries, bias in purposes of the tests, and above all, bias dues
400 450 500 550 600 650 700
1995 1999 2003 2007 2011 2015
Chinese Taipei Singapore Hong Kong
Thailand Japan Korea
to cultural differences. Hence, in this paper’s section, TIMSS research and major findings for
each APT country will be discussed in a way that there is no comparison between one country to
another, but rather the information is used to depict the student achievement for each country
throughout the TIMSS administrations.
TIMSS research and findings in 1995, 1999, and 2003. TIMSS administrations during
this time period was at a foundation and refining stage. There were several international efforts
to create a “universal basic education” (Ejere, 2011, p. 1). In fact, at the Dakar meeting in 2000
hosted by UNESCO, 180 countries committed to achieve “universal basic education by 2015” (p.
1). What this meant was for those countries to develop “their own national education plans-based
on political will, domestic resources mobilization, and accountability” (“Education”, 2008, p. 1).
Therefore, for the purpose of this paper, TIMSS results and findings were grouped into 1995,
1999, and 2003-time period.
Chinese Taipei. Chinese Taipei participated for the first time in TIMSS 1999 and
subse-quent TIMSS administrations. Figure 2.2 presented how Chinese Taipei students performed on
the TIMSS mathematics portion since 1999 as compared to the TIMSS scale average. On
aver-age, Chinese Taipei performed well above the international average score and remained as one of
[image:40.612.69.537.540.689.2]a few top performers.
Figure 2.2. Chinese Taipei average score vs. TIMSS scale score.
0 100 200 300 400 500 600 700
1995 1999 2003 2007 2011 2015
The mathematics section on TIMSS 1999 contained five content areas: (1) fractions and
number sense, (2) measurement, (3) data analysis, (4) geometry, and (5) algebra. According to
Gonzales and Miles (2001), the TIMSS 1999 had multiple-choice, short-response, and
extended-response questions. The results collected from this 1999 administration indicated that 25% of
Chinese Taipei students correctly answered 92% or more of the items, 50% of the students
cor-rectly answered 81% or more of the items, and 75% of the student corcor-rectly answered 62% or
more of the items (Chen et al., 2008). Chinese Taipei was one of the five Asian countries that
performed well in the mathematics with an approximate of 65% of students reached the upper
quarter benchmark (Gonzales et al., 2000).
In 2003, Chinese Taipei continued to show a higher performance among the leading
na-tions participated in TIMSS in the previous administrana-tions. Students in Chinese Taipei scored
an average of 585 on the mathematics portion as compared to TIMSS scale average of 467. In
other words, the students performed well above the scale average at first glance (Lin, Hung, &
Lin, 2013). However, the results also indicated that there was a problem when the achievement
scores were closely examined. In TIMSS 2003, there were 8% of fourth graders and 14% of
eighth graders who did not reach TIMSS intermediate average score (below 475) (Mullis,
Mar-tin, & Foy, 2008). Moreover, the results showed that Chinese Taipei had the highest proportion
of low-achievers (14%) among the leading nations participated in TIMSS 2003 (Lin, Hung, &
Lin, 2013). That being said, the data analysis showed that the achievement gaps were widened
over the years.
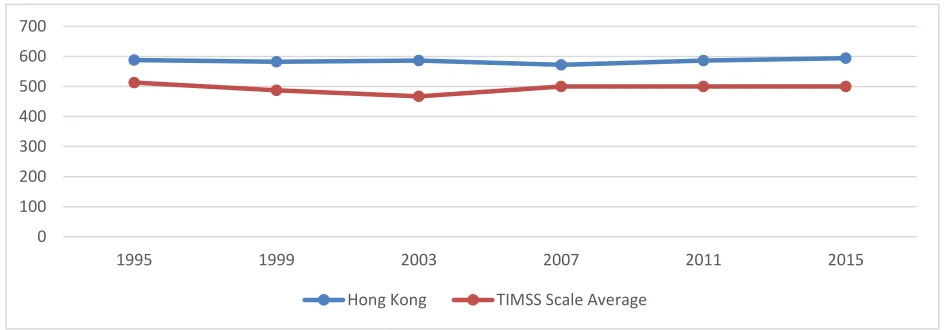
Hong Kong. Hong Kong participated in the first international assessment in 1995. Figure
2.3 showed Hong Kong average scores since 1995 as compared to the international average. The
Kong came fourth with an average score of 588 among the 41 participating countries in the 1995
assessment, remained in the fourth place with an average of 582 among the 38 participating
countries in 1999, moved up to third position with an average of 586 among the 46 participating
countries in 2003, backed to fourth place with an average of 572 among 60 participating
coun-tries in 2007, and in 2011, Hong Kong placed third with an average of 586 among 63
participat-ing countries (Mullis, Martin, Foy, & Arora, 2012). And in 2015 TIMSS administration, Hong
Kong placed fourth with an average score of 594 (Mullis, Martin, Foy, & Hooper, 2016).
[image:42.612.69.541.263.428.2]
Figure 2.3. Hong Kong average score vs. TIMSS scale score.
Wang (2007) released a trend study of self-concept and mathematics achievement in a
cross-cultural context and presented that there was non-monotonic change in the reciprocal
rela-tionship between self-concept and mathematics achievement. The study concluded that there was
a need to enhance cross-cultural understanding in mathematics education. The author analyzed
the data collected from TIMSS 1995 to TIMSS 2003 and showed that parental education levels
decreased from TIMSS 1995 to TIMSS 1999, and then bounced back in the 2003 assessment.
Moreover, the findings indicated an empirical bonding from parental education to student
learn-ing outcomes. Wang (2004) stated, “Hong Kong Chinese parents carried and penetrated in their
home environment their attitudinal emphasis in their children’s academic success” (p. 52).
0 100 200 300 400 500 600 700
1995 1999 2003 2007 2011 2015
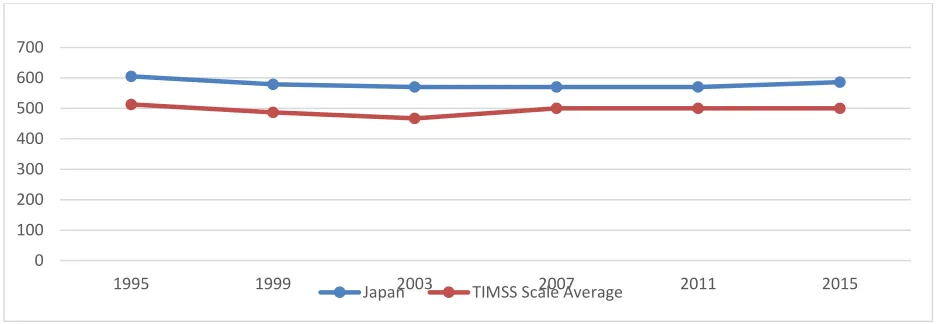
Japan. Japan joined the international assessment since its first implementation in 1995.
Figure 2.4 offered how Japanese students performed on the TIMSS mathematics portion as
com-pared to their counterparts. Japanese students remained as one of a few top performers when
compared their mathematics performance to other nation-states. In fact, Japan has been among
the top five performers since TIMSS first administration. Japanese students on average
[image:43.612.70.538.236.398.2]per-formed with a score of 605 as compared to TIMSS scale score of 513.
Figure 2.4. Japanese average score vs. TIMSS scale score.
Sawada (1999) released a research study, which examined the level of mathematics
achievement and attitudes toward mathematics among Japanese students in TIMSS 1995
admin-istration. The author indicated that when compared with the international average, Japanese
stu-dents had high average scores in terms of test-curriculum matching analysis. At the same time,
the data analysis showed that except for the geometry domain, Japanese students had better
op-portunities to learn when compared to other participating countries. Meanwhile, Japan also
per-formed very well on the eighth grade mathematics assessment and place second among the other
participating countries.
Continuing with its second participation in TIMSS 1999, Japan remained as one of the
top performances with an average score of 579 among the participating countries. House and
0 100 200 300 400 500 600 700
Telese (2014) found that all nine mathematics confident variables were significantly correlated
with mathematics achievement scores. In other words, the authors proposed that those who
showed high levels of mathematics achievement indicated that they did well and learned quickly
in mathematics. They found that it was significant when including all nine mathematics belief
variables in the regression model. The results indicated that there was 31% of the variance in
Japanese eighth-grade mathematics achievement scores explained.
In the 2003 administration, Japan continued to be among the top five performed countries
with an average score of 570. House and Telese (2008) found that those students who performed
well on the mathematics assessment were more likely to have positive beliefs in their
mathemat-ics ability. At the same time, the authors believed that those students who regularly worked out
problems on their own tended to earn better score on the assessment. In other words, students’
mathematics beliefs and classroom instructional practices were significantly correlated to
mathe-matics achievement.
Malaysia. Malaysia did not participate in TIMSS until the 1999 administration. Figure 2.5 presented the student performance as compared to TIMSS scale score. Taking a first look at
student performance, on average, Malaysian students achieved above the international average in
the administration of 1999 and 2003. However, Malaysian average scores dropped below the
in-ternational average scores after 2003. Compared to the participating countries in that time period
in 1999, the eighth-grade students ranked 16th in mathematics (Mullis et al., 2000).
In the same vein, Liew and Pong (2000) found that among the eighth-grade Malaysian
students, there existed a significant disparity among non-Malay natives and Malay natives.
Fur-thermore, the authors also offered that there was a significant difference in mathematics
scores were impacted based on the student’s educational expectations, how they perceived
math-ematical usefulness and reasons for doing well in mathematics. The parental educational
back-ground and the structure of family were also examined to determine the impact upon the
mathe-matics performance. In fact, the predictors showed a significant difference among the
eighth-grade students.
Figure 2.5. Malaysian average score vs. TIMSS scale score.
Results from the 2003 TIMSS administration indicated that Malaysia ranked 10th among the participating countries in mathematics (Mullis et al., 2004). In that vein, the mathematics
achievement scores in TIMSS 2003 were actually lower than the performance scores in TIMSS
1999. Azina and Halimah (2007) released their analysis based on Malaysian TIMSS 2003. The
authors found that the overall average achievement scores in five mathematics content areas
were significantly higher than the international average scores. Their examination of gender and
the mathematics achievement scores indicated that female students performed significantly
higher on average.
Republic of Korea. Republic of Korea (South Korea or Korea) participated in the first TIMSS 1995 administration. Based on the results released from IEA (1996), Korea ranked
sec-ond in eighth-grade mathematics performance with an average score of 607. The report indicated
that gender differences had no impact upon mathematics achievement. At the same time, student
400 420 440 460 480 500 520 540
1995 1999 2003 2007 2011 2015
home factors including educational resources, number of books in the home, and parental highest
educational level were strongly related to the mathematics achievement. Figure 2.6 indicated
how eighth-grade South Korean students performed as compared to TIMSS scale score on
aver-age. The data showed that South Korean students performed well above the international average
throughout its participation in TIMSS.
Figure 2.6. Republic of Korean average score vs. TIMSS scale score.
Despite the fact that Korea continues to rank among the top performances in TIMSS
ad-ministrations, it is noted that the increase of income inequality impacted the educational
inequal-ity in South Korea (Byun & Kim, 2010). The authors utilized the TIMSS data from 1999, 2003,
and 2007 to examine the relationship trends between student socioeconomic background and
stu-dent achievement. They initiated that the between-school variance in stustu-dent achievement
ex-plained by the school level increased over the period of 1999 to 2007, from 6.8 to 9.5,
respec-tively. That being said, the between-school variance between 1999 and 2003 (6.8 compared to
9.0) was more dramatic than between 2003 and 2007 (9.0 to 9.5). The authors also confirmed
that Korean socioeconomic background related to student achievement played a significant role.
In other words, the influence of socioeconomic background on student achievement increased
over the period suggesting that there existed an inequality in education in Korea during that time
period.
0 200 400 600 800
1995 1999 2003 2007 2011 2015