2018 International Conference on Modeling, Simulation and Optimization (MSO 2018) ISBN: 978-1-60595-542-1
Market Share Simulation Analysis Based on the Conjoint Study—
Take the Personal Computer as a Case
Ding-bang WU
1and Zhi-hong LI
2,*1College of Business Administration, Niagara University, New York, USA
2Business School, Jianghan University, Wuhan, China
*Corresponding author
Keywords: Market share, Simulation, Conjoint study.
Abstract. The purchase of the personal computer is influenced by price, brand, and performance, etc. How to take a conjoint consideration of these attributes in making a purchase decision? To find out a scientific purchase decision and provide guides for the design of the product attributes, the paper first analyzed the situation of the personal computer industry, then adopted the conjoint study method to analyze the attributes of the personal computer segment and made a market share simulation based on the sawtooth software. Finally, a conclusion was drawn: the conjoint study method is effective in assuring consumer choice decision. Also, it is powerful in synthetically analyzing the product attributes so that the firm can design the product able to satisfying the need of the market.
Introduction
As the smart phone has stronger and stronger functionality, the personal computer(PC) is being replaced by it in more and more aspects like information treatment, etc. This situation directly has led to a continuous drop of the shipment of PC. Gartner Consultation Company from the U.S.A issued the latest data: in the 3rd quarter 2017, the shipment of PC in the world dropped by 3.6%(about 67 million units). The shipment of the global PC has continuously dropped for 12 quarters.
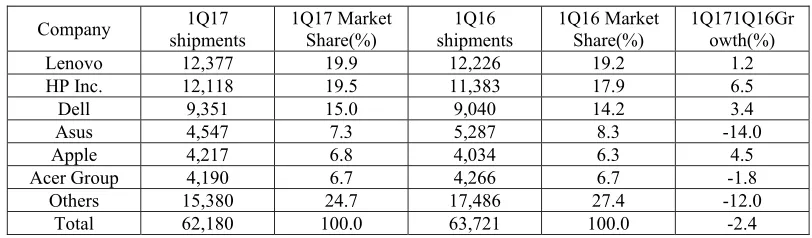
In the angle of the global main computer companies, in the 1st quarter of 2017(see Table 1)[1], Apple Company sold about 4.2 million units Mac with a growth of 4.5% and a market share of 6.8%, compared with those of the 1st quarter, 2016. Lenovo, HP and Dell had a shipment of 12.4million, 12.1 million and 9.4million units respectively with a respective market share of 20%, 19.5% and 15%.
[image:1.612.102.508.574.693.2]The 4th computer company, Asus, had a rapid drop with a shipment of only 4.5million units, which is below that of the same period of 2016. Besides, numerous small computer firms had a fast decrease in sales. According to Gartner’s estimation, the total shipment of PC in the 1st quarter of 2017 was 62.2million units and had a drop of 2.4% , compared with that of the same period in 2016.
Table 1. Shipments of PC in 1st Quarter of 2016 and 2017.
Company shipments 1Q17 1Q17 Market Share(%) shipments 1Q16 1Q16 Market Share(%) 1Q171Q16Growth(%)
Lenovo 12,377 19.9 12,226 19.2 1.2
HP Inc. 12,118 19.5 11,383 17.9 6.5
Dell 9,351 15.0 9,040 14.2 3.4
Asus 4,547 7.3 5,287 8.3 -14.0
Apple 4,217 6.8 4,034 6.3 4.5
Acer Group 4,190 6.7 4,266 6.7 -1.8
Others 15,380 24.7 17,486 27.4 -12.0
Total 62,180 100.0 63,721 100.0 -2.4
However, PC is still playing an important role in many fields and it seems impossible for the smart phone to substitute it in a short term. As Gartner pointed out, more and more companies plan to upgrade their computers with those installed with Windows 10 system and they have begun to renew their PCs. So, Gartner anticipates that PC market will keep stable in 2017 and will increase by 0.8% in 2018.Nic Fildes[2] from British Financial Times reported that personal computers market is expected to be revitalized in 2018.
According to the latest industrial forecast, as the computer in the firm is being upgraded and as the markets in China and Russia is rebounding, the personal computer market will be recovered to 265 million units in 2018[3].
Seeing that PC has a relative high price per unit, its market is still huge in profit margins. To grasp the chance in PC market, the firm must precisely segment the market and find out the preference of different consumers and provide them with what they like.
Situation of Personal Laptop Segments
Firm COCK(a virtual company) mainly produces personal computers. Its new product “MELON”(a simulation product) concentrates on mid-and low-end consumers. “MELON” has two main competitors “BANANA”(a simulation product) and “CHERRY”(a simulation product) in the segments, of which the target customers get mid-low incomes. Competitors’ pricing is mainly between 400$ and 600$ in products’ marketing and the “MELON” will be set around 500$ to compete with the other products. Firm COCK wants to adopt the conjoint analysis to make a research of the demands of “MELON”. The conjoint analysis can reveal how much importance and value the consumer attaches to the various attributes of the products studied by the way that the respondents answer the questionnaires well designed.
Conjoint Analysis Objective and Design
Objective
This conjoint analysis aims at finding out the effective configuration of “MELON” that can satisfy the demands of the customer.
Design of Products’ Attributes
Based on the relative research, Brand, Price, CPU and Hard Disk of the computer are the main factors for the consumer to select and buy a computer. So, the attributes which we need to study for the products are Brand, Price, CPU speed and Hard Disk volume. Considering “MELON” mainly faces mid-and low-end consumers, the products’ pricing can be 400$, 500$ and 600$. Specifications of CPU are AMD A6, Intel i3, Intel i5. Hard Disk’s capacity is 80G, 100G and 120G. The following table is about products’ attributes. Therefore, the attributes levels chosen finally are presented in Table 2, too.
Table 2. Attributes and Attribute Levels of the Products
Attributes Attribute Levels
Brand MELON BANANA CHERRY
Price $400 $500 $600
CPU AMD A6 Intel i3 Intel i5
Hard Disk 80G 100G 120G
Table 3. Nine Model Products Plan.
Attributes Brand Price CPU Hard Disk
Products designed
A MELON $400 Intel i5 100G
B MELON $500 AMD A6 120G
C MELON $600 Intel i3 80G
D BANANA $400 Intel i3 120G
E BANANA $500 Intel i5 80G
F BANANA $600 AMD A6 100G
G CHERRY $400 AMD A6 80G
H CHERRY $500 Intel i3 100G
I CHERRY $600 Intel i5 120G
Analyze Survey Data
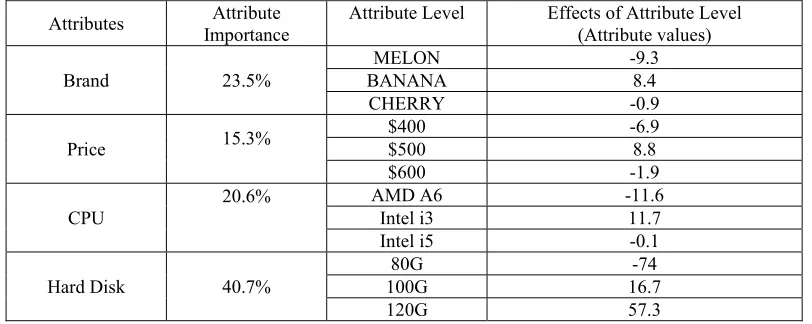
[image:3.612.104.510.335.497.2]This case uses Sawtooth Software to collect questionnaires and deal with the data. A total of 107 questionnaires were issued, of which 29 were completed. By Sawtooth Software, we can get the Attribute importance and the Attribute values(see Table 4) from the conjoint analysis(see Figure 1, 2, 3, 4, 5).
Table 4. Outcomes of Conjoint Analysis.
Attributes Importance Attribute Attribute Level Effects of Attribute Level (Attribute values)
Brand 23.5%
MELON -9.3
BANANA 8.4
CHERRY -0.9
Price 15.3%
$400 -6.9
$500 8.8
$600 -1.9
CPU 20.6%
AMD A6 -11.6
Intel i3 11.7
Intel i5 -0.1
Hard Disk 40.7%
80G -74
100G 16.7
120G 57.3
In the outcomes of conjoint analysis, attribute importance is consumers’ focus point. We can see the consumers are very concerned about hard disks, and it has 40.7%. The brand ranks the second, 23.5%. CPU is the third, it has 20.6%. The last one is the price 15.3%. Consumers don’t care price when they face mid-and low-end products. These outcomes are consistent with the actual situation of the mid-low level personal computers to some degree, where most purchasers are from companies, firms and universities. Their purchase purpose are mainly for office, teaching, etc. They have higher requirements in storage for their documents than CPU. Also, the durability of the product has some importance for this kind of consumers and brands are usually the symbol of high quality, so they pay some concerns to the brand. In the mid-low level market, the price of the personal computer has been much low and leaves less room to be further cut down. As for a necessity of office and life, the price elasticity is low and its fluctuation is not sensitive to the purchasers.
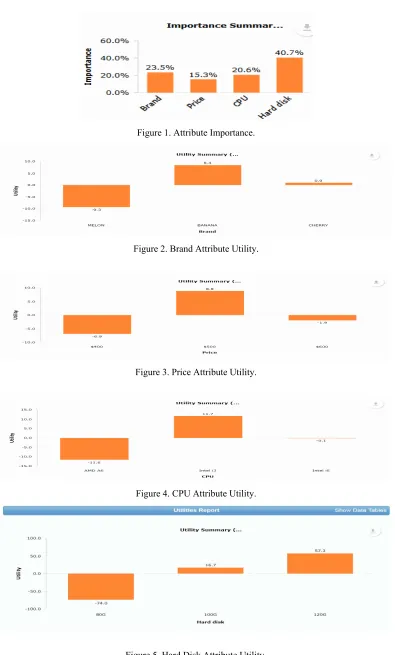
Figure 1. Attribute Importance.
Figure 2. Brand Attribute Utility.
Figure 3. Price Attribute Utility.
[image:4.612.110.505.56.711.2]Figure 4. CPU Attribute Utility.
Markets Share Simulation
In this simulation case, assuming that the price is $500, what configuration of MELON should be produced if it is successfully competitive with the mainstream products in the segment: CHERRY Intel i3 ($600,100G) and BANANA Intel i5 ($500, 120G). Three types of configuration for MELON may be considered: R1 (Intel i5+120G);R2 (Intel i3+120G);R3 (Intel i3+100G).Then, respectively calculate the consumer’s utility for CHERRY(H), BANANA(D) and R1, R2, R3 as follows:
U(R1)=U(Price+Brand+CPU+Hard Disk)= (-9.3) +8.8+ (-2.0)+57.3=54.8 U(R2)=U(Price+Brand+CPU+Hard Disk)= (-9.3) +8.8+11.7+57.3=68.5 U(R3)=U(Price+Brand+CPU+Hard Disk)= (-9.3) +8.8+11.7+16.7=27.9 U(H)=U(Price+Brand+CPU+Hard Disk)=0.9+ (-1.9) +11.7+16.7=27.4 U(D)=U(Price+Brand+CPU+Hard Disk)=8.4+8.8+ (-2.0) +57.3=72.5
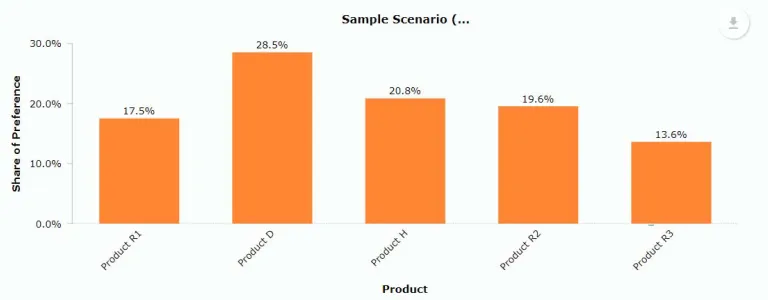
[image:5.612.116.500.307.457.2]From the above calculation results, we can see that the largest is U(D) and the second large is U(R2). So, if the products of MELON hope to beat the products of CHERRY and BANANA, the following tactics can be adopted: R2 (i.e. CPU :Intel i3,Hard Disks:120G) competes with the product H; the alliance between R1 (i.e. CPU:Intel i5, Hard Disks:120G) and R3 (i.e. Intel i3+100G), so as to diversify the product lines can be against the product D. The shares of preference for R series of products and their rivalries H and D can be seen in Figure 6.
Figure 6. Comparison of the Market Share Simulation.
Conclusion
As a multi-statistical analysis method, the conjoint study has been widely used in marketing, finance and the other service fields. It has a vast development perspective. Its main functions can be embodied as follows:
One is to decide the relative importance of the various product attributes for the consumer’s purchase decision.
The second is to segment the market according to the preference similarity of the different attribute levels.
The third is to evaluate the market share of the brand with various attribute levels and to determine the best attribute configuration.
Acknowledgment
References
[1] Global PC Market Continuously Drops While Mac Volume Grows against the Downward Trend, http://tech.163.com/17/0412/08/CHQE1KED00097U7S.html.
[2] www.ftchinese.com, 2017-10-18.
[3] http://www.ftchinese.com/story/001074705?print=y.
[4] Jiangping Wu, Dingquan Xu. Study on the Application of the Conjoint Analysis in the Product Attribute. Modern Business and Trade Industry, 2008, (10,): 58-60.
[5] Green, P.E., Krieger, A.M. Segmenting Marekts with Conjoint Analysis. Journal of Marketing. 1991, (55): 20-31.