ISBN: 978-1-60595-362-5
Android Malware of Static Analysis Technology Based on Data Mining
Chen PENG, Rong-Cai ZHAO, Shan ZHENG, Jia XUN, Li-Jing YAN
State Key Laboratory of Mathematical Engineering and Advanced Computing, Zhengzhou Henan HEN371, China
Keywords: Malware Detection, Permission Feature, Component Feature, Behavior Patterns, Data Minig.
Abstract. With the proliferation of malicious Android applications, an Android malicious code detection system is proposed in this paper. Based on the similarity between cognate malicious software in terms of permission application and behavior, the proposed system detects the malicious codes by performing static analysis on the configuration and Java files. For the configuration file permissions analysis, the permission of the Android software is extracted, and the improved version of the FP-Growth algorithm is used to mine the permission correlation between cognate malicious software. For the Java file analysis, the API sequence is called, and the behavior pattern is represented with the sub-graph; frequent pattern mining is performed on the behavior sub-graph of cognate malicious software using the AGM algorithm. The unknown malicious software is detected by establishing a malicious software feature library consisting of frequent permission clusters and frequent behavior sub-graph relationships. Finally, experiments are carried out to prove the effectiveness and correctness of the proposed schemes. The proposed malicious code detecting system has been made available on the Internet to provide free analysis and detection service.
Introduction
The era of mobile terminals has arrived, but mobile security is greatly outpaced by mobile Internet. There are so many Android-related security problems that OS or APP security threats are looming. According to the data from Strategy Analytics [1], the Android devices are dominant in the world market, its share reaching 81%, far more than Apple, Microsoft and Blackberry. On the other hand, the openness of the Android system, which gains favor with the developers, is accompanied by various security problems. Android devices and Windows PCs have been the major victim of malicious attacks, and the number of attacks against them have converged to the same. The Android malicious software samples increased by 161% in 2014.
Related Research
According to detecting time and feature description, the Android malicious code detecting methods can be classified into static feature analysis and dynamic monitoring. The commonly used APK static features include authorization statement, program components, calling relationships, and code hashes. But it is only applicable to malicious nodes that have existed in the feature library, and is thus ineffective for malicious applications that have not been integrated into the library.
With the development in data mining, the data mining techniques have been used in various domains to extract useful information from the large amount of data [2]. Detecting malicious applications using the data mining algorithms has been a novel research direction[3]. Researchers have applied the frequent pattern mining algorithm to PC platform for malicious code detection and achieved good results.
Therefore, the data mining technique is combined with the mobile platform to collect and analyze existing malicious samples and then detect unknown samples.
System Design
The 1260 malicious samples in [4] are used for extraction of authority and behavior features.The proposed Android malicious code detection system consists of the configuration file analysis component and the behavior pattern analysis component.
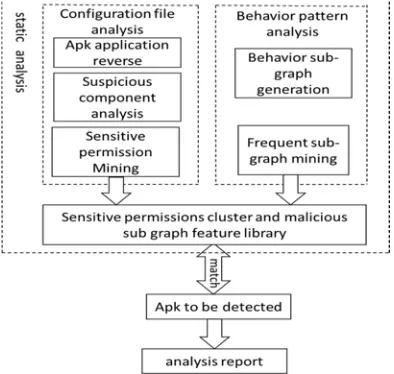
The configuration file analysis: the cognate malicious samples are decompiled in batch to obtain the packet names and signatures, which are then used to quickly detect existing malicious samples by comparing with the library of packet names and signatures of existing malicious samples. As for permission analysis, the DOM morphology is used to analyze and extract the permission list of samples. The sensitive permission of cognate malicious applications is chosen from the sensitive permission list. Frequent pattern mining is done on sensitive permission of the samples to obtain the sensitive public permission cluster requested by the malicious application. The sensitive permission requested by the software that is to be tested is compared with the list of malicious sensitive permission clusters in order to detect unknown malicious applications. As for analysis of system components, the malicious behavior is done through the component. So, the component information can represent the behavior that it exhibits during the operation. The filtering rules are defined to identify suspicious components and analyze the access points of the program’s malicious behaviors.
[image:2.612.219.416.288.475.2]
Figure 1. System Architecture.
Behavior pattern analysis: the reversing tools are used to decompile the cognate malicious samples in batches; soot analysis is performed on the obtained Java files to generate the node file of the API calling sequence of this sample. Visual representation of this sequence is achieved via Graphviz to generate the software behavior sub-graph. Frequent pattern mining is then done on the behavior sub-graph to obtain the public malicious behavior sub-graph that can represent this malicious software, which is then stored into the database. The sample which is to be tested is compared with the malicious behavior sub-graph in order to detect the unknown malicious sample. System architecture is shown in Fig.1.
Configuration File Analysis
The following is a detailed description of each step as well as the algorithms, techniques and tools used at each step.
Android Application Reverse
Package Name and Signature Detection
Based on the characteristics of the Android system programs, rapid repacking detection is done by comparing the packet names and signatures. The packet name and signature of the APK file can be obtained using aapt and read into the database to perform matching-based rapid detection on the repacked programs.
Sensitive Frequent Permissions Mining
Many mature technologies are available to analyze XML files in Java, such as DOM, SAX, JDOM and DOM4J. The retrieving and updating efficiency is higher, as DOM is stored in the memory as a tree. Thus, the permission list of the sample is extracted through the official DOM technique.
Traditionally, analysis is done on the permission requested by many malicious applications. But the analysis of a permission alone cannot reflect the behavior of malicious applications. The idea of the proposed improvement on the FP-Growth algorithm is to perform frequent pattern mining on the set of sensitive authorities, and detect unknown applications by capturing the correlation between authorities through the frequent cluster of cognate public sensitive permission.
Behavior Pattern Analysis
The malicious behavior cannot be fully reflected by simply analyzing permission and component, thus highlighting the need to analyze Java files. This section makes analysis of APIs called by malicious software, performs frequent pattern mining on the API sequence sub-graph of the training set using the frequent sub-graph mining algorithm, and chooses the public malicious behavior sub-graph that can represent this family, which is then used to test the samples from the test set.
Behavior Subgraph Generation
Soot is used to analyze Java obtained through decompilation and obtain the control flow of nodes. The Soot framework provides API responsible for analyzing and converting intermediate representations [5].
After the source program is converted into Jimple, the Jimple file obtains the information about the program’s structure from the source code of the program. Grammatical analysis is then done on the source program using the Jimple file, obtaining the control flow. Visual representation is done through graphviz.
Generate the corresponding adjacency matrix: The number of nonzero values of each row in the adjacency matrix, indicating the degree of out of the instruction node; Adjacency matrix of the number of nonzero values per column indicates that the command node into degrees, the node whose out-degree is larger than 1 is regarded as the branch node, and the node whose in-degree is larger than 1 is defined as the intersection node. The relation of the controlling node corresponding to each label in Jimple can be captured in the adjacency matrix, thereby obtaining the path in which API call each other. The adjacency matrix indicates the flow of control between nodes, and can be used to compute the path between APIs. The API calling information flow which is crucial to the test will then be generated.
Frequent Sub Graph Mining
Due to similarity between malicious behaviors of the cognate software, the sub-graph of cognate malicious behaviors also shares similarity. Thus, the frequent sub-graph mining algorithm AGM is used to perform frequent pattern mining on the cognate behavior sub-graph. In this way, we can choose the public malicious behavior sub-graph of this family, and store it into the database so that it can serve as the malicious behavior sub-graph library for software detection.
In AGM, for a set of graphs G={G1,G2,…Gn}, frequent sub-graph mining is to find the sub graph no less than minimum support threshold. Like Apriori, AGM starts with the frequent graph pattern whose value is 1 by using the reverse monotonicity of the support and then finds larger frequent graph patterns sequentially with increase in the number of vertexes. Algorithm steps are as follows.
Experimental Results and Analysis Experimental Environment
Combined with the existing conditions of the laboratory, we use IBM 3850X6 server deployment environment as detection system. Comes standard with two Intel 6-core Xeon E7-4809v2 processor, 2 Block memory board.
Experimental Sample
The experimental sample is composed of 3 parts:1) Training sample: This paper uses the same set of samples as in [4] the sample library contains 1260 malicious application samples, 49 malicious application family.2) Malicious application test samples: 200 malicious applications of the latest discovery in 2015, building a test sample of 200 malicious applications.3) Non-malicious application test samples: Downloads 2015 Top 200 most downloaded apps from Google Play, build 200 test samples non-malicious applications.
Experimental Results and Analysis
As shown in figure 2,100 samples were tested for batch reverse test, system processing speed 2.78s/a, flow rate of 245kb/s, the average volume expansion ratio of sample volume is 300%.
[image:5.612.191.422.302.447.2]
Figure 2. Decompiling Test.
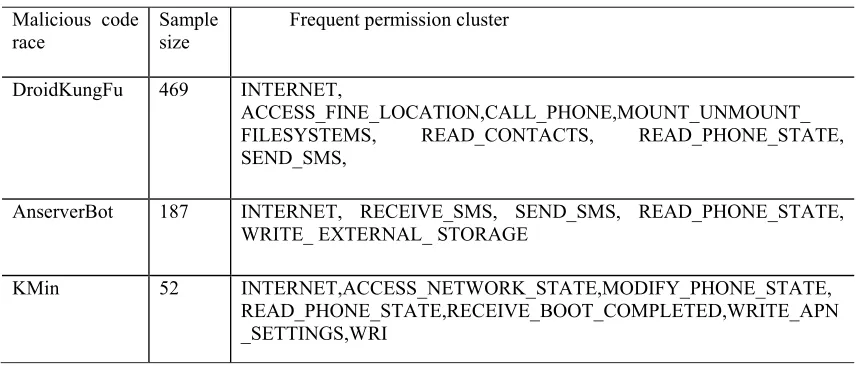
Usually, a malicious behavior cannot be done without collaboration of several authorities. Thus, analysis of an permission alone cannot completely reflect the behavior of the malicious application. The frequent permission cluster obtained using the frequent mining algorithm is given in Tab.1.
Table 1. Frequent Permission Cluster.
Malicious code race
Sample size
Frequent permission cluster
DroidKungFu 469 INTERNET,
ACCESS_FINE_LOCATION,CALL_PHONE,MOUNT_UNMOUNT_
FILESYSTEMS, READ_CONTACTS, READ_PHONE_STATE,
SEND_SMS,
AnserverBot 187 INTERNET, RECEIVE_SMS, SEND_SMS, READ_PHONE_STATE,
WRITE_ EXTERNAL_ STORAGE
KMin 52 INTERNET,ACCESS_NETWORK_STATE,MODIFY_PHONE_STATE,
[image:5.612.92.520.549.732.2]In this paper, maximum frequent authority cluster mining is done automatically on the authority pattern of the 49 families of malicious applications; a library of authority relation features is constructed; and comparison is made with the applications that need to be checked by analyzing correlation between authorities, resulting in higher accuracy of malicious behavior detection.
[image:6.612.102.512.422.562.2]In the selection of 1000 samples in total contains 69300 Activity components, 3818 Service components and 3969 Receiver components. By the experimental data in Tab.2, Suspicious components exist in the three components. Among them, the total number of Activity components is the largest, Suspicious component proportion is 2520/69300=3.6%, the proportion of suspicious components in the Service component is 1236/3818=32.4%, Receiver component suspect component ratio is 995/3969 = 25.1%
Table 2. Component Statistics.
Component Suspicious components number Suspicious components number Total
Activity 66780 2520 69300 Service 2582 1236 3818 Receiver 2974 995 3969
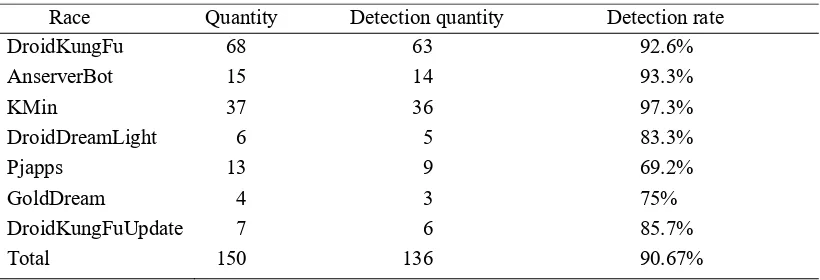
Tab.3 is a system test results on samples of malicious code, the system detected 136 out of 150 malicious samples, the overall detection rate of 85%; In the analysis of 200 normal samples, 13 samples will be mistaken for malicious code, the rate of false positives is 6.5%. From the above results, it can be known that the Android malicious code detection system designed in this paper has a good effect.
Table 3. Malware Detection Results.
Race Quantity Detection quantity Detection rate
DroidKungFu 68 63 92.6%
AnserverBot 15 14 93.3% KMin 37 36 97.3%
DroidDreamLight 6 5 83.3%
Pjapps 13 9 69.2% GoldDream 4 3 75%
DroidKungFuUpdate 7 6 85.7%
Total 150 136 90.67%
Prospect and Summary
References
[1]Motive Security Labs. Malware report—H2 2014.
[2]Witten I.H. Data Mining: Practical Machine Learning Tools and Techniques [M]. Beijing: China Machine Press, 2012.
[3]Shabtai A., Kanonoy U., Elovici Y., et al. Andromaly: a behavioral malware detection framework for Android devices [J]. Journal of Intelligent Information Systems, 2012, 38(1): 161-190.
[4]Zhou Y.J. Dissecting Android malware: characterization and evolution. Proceedings of the 33rd IEEE Symposium on Security and Privacy. Oakland, USA, 2012. 95-109.
[5]Jun Yan, Tao Guo, Hui Chen, Jtua: An automated testing tool for Java units [J]. Computer