Contents
Contents... 2 Table of Figures ... 3 Foreword... 4 1. Introduction... 5 2. The Respondents... 62.1 Geographic Distribution of Respondents ... 6
2.2 Distribution of Respondents by Business Role ... 7
2.3 Respondent's Role Within Organization’s BPM Program ... 8
2.4 Distribution of Respondents by Industry ... 9
2.5 Respondent's Role Within Organization’s BPM Program by Industry... 10
2.6 The Size of the Respondent's Organization... 11
2.7 Scope of the Business Process Initiatives Reported ... 11
3. The Perceived Value of BPM Software... 12
3.1 The Single Greatest Benefit Derived From the Use of BPM Software ... 12
3.2 A Three-Year Perspective on BPMS Attitudes ... 13
4. The State of BPM Initiatives... 14
4.1 Status of All Examined Process Improvement Areas ... 14
4.2 How Active Business Process Initiatives Compare by Industry... 15
4.3 Use of a BPM Center of Excellence... 16
4.4 Correlation of BPM Project Success With BPM Centers of Excellence... 17
4.5 Status of BPM Initiatives by Business Function... 18
4.6 Status of BPM Initiatives by Industry ... 19
4.7 Types of BPM Initiatives Currently Under Way... 20
4.8 Currently Active BPM Initiatives by Industry ... 21
4.9 Reasons BPM Software Was Not Yet Deployed……….….………..22
5. Measuring BPM Success and Return On Investment... 23
5.1 Reported Success of BPM Initiatives... 23
5.2 ROI Analysis of BPM Initiatives by Industry... 23
5.3 Metrics Used to Measure ROI Success ... 25
5.4 Comparison of Success Metrics Used by Industry ... 26
5.5 How ROI Benchmarks and Expectations Were Established ... 27
5.6 Time Frame Used for Measuring Project Success ... 28
5.7 Allocation of BPM Spending Categories as Percent of Project Budgets ... 29
5.8 Distribution of Existing Spending on BPM ... 30
5.9 Distribution of Reported ROI Measured After Project Rollout………... ………31
6. Summary... 32
Table of Figures
Figure 1. Where Responses Came From... .6
Figure 2. Business Roles of Respondents ... .7
Figure 3. Roles of Respondents Within BPM Program……….………....8
Figure 4. Distribution of Respondents by Industry………. 9
Figure 5. Roles of Respondents by Industry ... 10
Figure 6. Distribution of Company Size……….….………11
Figure 7. Scope of Projects Reported ... 11
Figure 8. Single Greatest Benefit of BPM Software ... 12
Figure 9. Three-Year Comparison of BPMS Benefits ... 13
Figure 10. Status of Business Process Initiatives ... 14
Figure 11. Industry Comparison of Business Process Initiatives ... 15
Figure 12. Status of Business Process Initiatives ... 16
Figure 13. Distribution of Reported ROI by BPM Program Type ... 16
Figure 14. Correlating BPM Project Success ... 17
Figure 15. Status of Business Process Initiatives ... 18
Figure 16. Industry Comparison of Process Focus Areas... 19
Figure 17. Distribution of Active Projects ... 20
Figure 18. Active BPM Project Types by Industry ... 21
Figure 19. Why BPM Not Deployed... 22
Figure 20. Success Level by Industry ... 23
Figure 21. Frequency of ROI Measurement... 24
Figure 22. Success Metrics for BPM Projects ... 25
Figure 23. Success Metrics by Industry ... 26
Figure 24. Source of ROI Requirements ... 27
Figure 25. ROI Timeframe... 28
Figure 26. Allocation of Project Budgets ... 29
Figure 27. Distribution of Existing BPM Investments……….………...………30
Foreword
The survey results described in this report document represent a joint effort undertaken by BPTrends and Transformation+Innovation. The data was collected in September and October of 2006 by means of a BPTrends questionnaire. The data was analyzed and the report was written by Nathaniel Palmer, who is the President of Transformation+Innovation, the Executive Director of the Workflow Management Coalition, and a well-known market analyst.
The report summarizes information provided by 74 respondents who work in large, medium, and small companies, and who represent a broad cross section of industries located throughout the world.
Like other BPTrends Reports, this report, A Survey on Business Process Initiatives, is available without charge to all registered members of BPTrends. We hope this report will provide readers with insights into the BPM development efforts of other companies and suggest how their own company’s BPM efforts compare with those undertaken elsewhere.
We are grateful to our many BPTrends members and Website visitors who cooperated with us to make this report a reality. Without the many respondents who took the time to fill out the questionnaire, we could not have produced this report. For our part, we have made every effort to summarize the resulting data as accurately and fairly as possible.
Similarly, we are grateful to Nathaniel Palmer and Transformation+Innovation for helping us to design the survey, for undertaking the analysis of the data, and for the writing of this report. Finally, we hope this report will provide BPM practitioners with insights that will suggest new ideas for future improvements in their organization’s process work.
As always, we welcome your comments and suggestions regarding the survey and the resulting report, as well as suggestions for topics and issues you would like to see included in future surveys.
Celia Wolf
CEO and Publisher of BPTrends [email protected]
1. Introduction
This report describes data that was gathered in October of 2006. The October survey focused on Business Process Initiatives – whether or not specifically identified as “re-engineering,” “business transformation,” “process modeling,” “Business Process Management,” “Business Process Automation,” or “Business Process Analysis.” Thus, the report includes, but is not limited to, the implementation of BPM software. One of the main goals of the survey was to examine and benchmark the level of success achieved by companies that have deployed some kind of business process improvement program. In other words, we wanted to find out Who is Doing What and How They Did It. At the same time, we also wanted to find out what we could about the financial results organizations were achieving, measured, if possible, in terms of Return On Investment (ROI).
Throughout this report on the survey we use “BPM,” or “Business Process Management,” and “business process initiatives” as interchangeable terms. In this context, these terms refer to corporate or organizational initiatives focused on the analysis, improvement, management, and/or automation of business processes. However, we have generally excluded “Business Process Outsourcing” projects and investments, since they do not generally involve specific process improvement initiatives, tools, or methods.
Survey questions and comments within this report that refer to “BPM software” specifically, and are identified either as “BPM software” or “BPMS” for “Business Process Management Suite,” refer to specific third-party software products.
The individuals whose survey responses we selected for this report include mid-level managers from medium to large-size organizations, business process owners, IT/infrastructure managers, and operations and internal consultants. To keep the focus on end consumers and internal practitioners, we filtered out the responses of external consultants, software vendors, and sole proprietors.
The survey had a total of 27 questions. The first set of responses, Figures 1-10, describe the backgrounds, roles, industry sectors, and overall attitudes of the respondents. The next set of responses, Figures 11-19, describe the current practices, results, and expectations regarding BPM investments. Figures 20-28 describe the business impact, financial performance, and ROI of the respondents’ BPM projects.
2. The Respondents
2.1 Geographic Distribution of RespondentsThe geographic distribution of the respondents mirrors the worldwide expanse of the larger BPM industry, with just over half in North America, a quarter in Europe, and the balance in Asia, Africa, and the Middle East.
Figure 1. Where Responses Came From
The growth observed in areas outside Europe and North America is consistent with what we have observed during the past 2-3 years. There has been a significant increase of BPM activity in South America, particularly in Brazil, as well as in Korea and Taiwan. In addition, we are seeing more nascent BPM and business transformation initiatives in areas such as Singapore, Malaysia, and Brunei. Lastly, we have seen significant activity in Southeast Asia (notably India) around Business Process or Transformation Outsourcing (BPO or BTO), performed both regionally and (more often) as an offshore resource for European and North American firms. Although these BPO initiatives are part of a rising tide of process improvement initiatives within the region, they were generally beyond the scope of the survey and its analysis
North America (52%) South America (8%) Asia/Australia (11%) Africa/ Middle East (4%) Europe (25%)
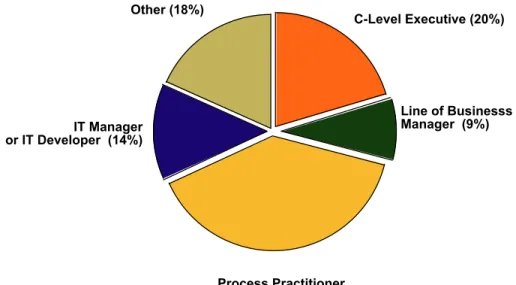
2.2 Distribution of Respondents by Business Role
Categorization of organization roles was a matter of self-selection by respondents, and the largest group of respondents indicated that they function as some form of internal practitioner, with only half directly indicating IT or application development. This confirms that BPM and business process optimization is a business function, not a function of IT alone, and that the corporate roles targeted in this research are beyond software implementation (i.e., although BPM deployments were examined, these were not the sole focus of the survey).
Figure 2. Business Roles of Respondents
The nearly one-fifth of respondents in the “Other” category include Business Process Analyst; Department Manager; “Leader of BPM” (Director Level); Manager of Business Analysts; Senior Vice President; Executive Director; “Consultant;” Enterprise Solutions Architect; “Project Leadership and Client Management;” Chief Process Officer (CPO), Workflow Architect; Process Manager; and Project Management Officer. Many, if not all, of these “Other” roles could be categorized within one of the four other categories provided. What it does reflect, however, is that BPM is an area that cuts across traditional organizational boundaries, often blurring the lines of demarcation between business and IT. In this manner, it is likely that terms such as “Architect” refer to roles and responsibilities that are not specific to IT, and perhaps relate to organizational design rather than systems designs. Very often, individuals and teams engaged in BPM and business process improvement initiatives describe themselves as not representing a vertical function, such as finance, nor a horizontal (e.g., Human Resources), but, rather, as reflecting a “diagonal” – the multi-disciplinary nature of BPM and process work in general.
C-Level Executive (20%) Line of Businesss Manager (9%) Process Practitioner or Business Analyst (39%) IT Manager or IT Developer (14%) Other (18%)
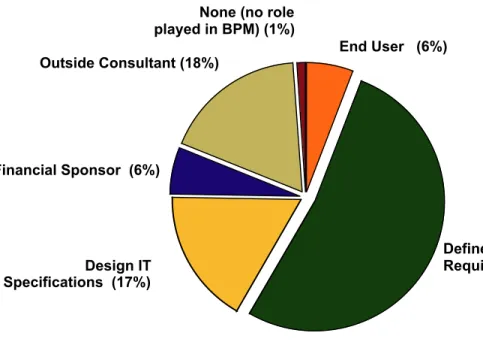
2.3 Respondent’s Role Within Organization’s BPM Program
More than two-thirds of respondents were engaged in some degree of requirements definition for BPM and process initiatives. Of these, 75% were responsible for business requirements, and only a quarter were involved with IT specifications. Where individuals were reported as outside consultants, they were generally related to a specific customer account where they play an “in residence” role, as opposed to responding to the survey as general purpose implementers.
Figure 3. Roles of Respondents Within BPM Program
As previously noted, the practice or discipline of defining business requirements is inherently multidisciplinary, given the need to understand the mix of business requirements and end user functional requirements, and how to translate these into technical specifications. Such a large concentration of respondents engaged in this activity reflects the inherent business-orientation of BPM and process optimization initiatives, in contrast with IT specification design. Again, this is not intended to make the case for excluding IT, but, rather, to illustrate that BPM is inherently a business function. End User (6%) Define Business Requirements (52%) Design IT Specifications (17%) Financial Sponsor (6%) Outside Consultant (18%)
None (no role played in BPM) (1%)
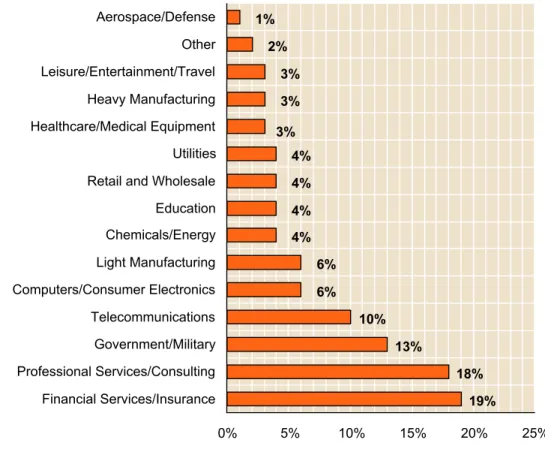
2.4 Distribution of Respondents by Industry
The distribution by industry has followed a pattern in the overall BPM industry similar to that of the geographic distribution. One notable figure is the high representation of Telecommunications, which represents 10% of responses but only about 2% of the world’s economic output (source: World Factbook). This is in contrast to Insurance and Financial Services, which, combined, are easily ten times the size of Telecom, or of Government/Military which is, by itself, many times larger than any commercial industry.
Figure 4. Distribution of Respondents by Industry
Although total spending in these sectors is greater than is seen in Telecom, they are among the largest sources of process automation investment, although not limited specifically to BPMS software. This is concentrated largely in customer service automation, including new customer provisioning and on-boarding – given the large role that customer transaction costs play in the operating overhead in this sector which is experiencing increasing pressure from shrinking margins. The highest concentration of investments is in back-office operations and in front-office customer service.
Comparisons and contrasts between sectors of industries are more pronounced than differences observed by geography (albeit all Telecom respondents were from North America and Europe), and they are explored in many of the sections that follow.
Financial Services/Insurance Professional Services/Consulting Government/Military Telecommunications Computers/Consumer Electronics Light Manufacturing Chemicals/Energy Education Retail and Wholesale Utilities Healthcare/Medical Equipment Heavy Manufacturing Leisure/Entertainment/Travel Other Aerospace/Defense 0% 5% 10% 15% 20% 25% 1% 2% 3% 3% 3% 4% 4% 4% 4% 6% 6% 10% 13% 18% 19%
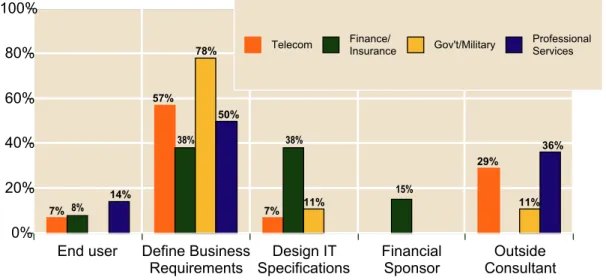
2.5 Respondent’s Role Within Organization’s BPM Program by Industry
When segmented by industry, the breakout of project roles shows an overall consistency. “Defining Business Requirements” was the highest for all industries; all industries had a relatively low number of end users found within the pool of respondents.
Figure 5. Roles of Respondents by Industry
It is interesting to note that the number of respondents involved in designing IT specifications within Financial Services and Insurance is 3-4 times greater than in any other category. Given the size of the pool of respondents and the significant delta in this one area, this has to be more than a statistical anomaly. Rather, it likely reflects the high level of strategic importance placed on IT and information systems in both financial services and insurance. Linked by the common characteristics of hyper-competition, regulatory scrutiny, and extreme pressure on transaction costs, IT offers a source of competitive differentiation in these sectors unlike almost any other. Among large banks and insurance firms, it is often nearly impossible, or at least impractical, to separate discussions of process from those surrounding IT and information systems. Areas such as policy underwriting that have not been automated in a manner that would eliminate “people work” nevertheless lean heavily on support systems such as case management applications. For areas such as new account processing or account reconciliation, the role of IT is even more pronounced. In fact, for the latter, it may indeed be impossible to separate process from IT. For other service-based sectors, including government, however, how work is performed should be defined first, before the systems designed to support that definition: This is where the value of BPM as a means to facilitate the separation of business logic from application logic can be best leveraged.
End user Define Business
Requirements Specifications Design IT FinancialSponsor ConsultantOutside 0% 20% 40% 60% 80% 100% 7% 8% 14% 57% 38% 78% 50% 7% 38% 11% 15% 29% 11% 36% Telecom Finance/ Insurance Gov't/Military Professional Services
2.6 The Size of the Respondent’s Organizations
The survey population offers relatively even distribution of company and department size, with the majority representing companies with more than 1,000 employees.
Figure 6. Distribution of Company Size
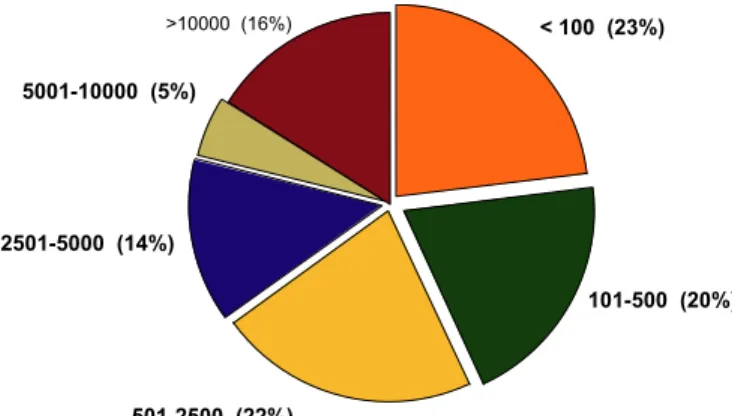
2.7 The Scope of the Business Process Initiatives Reported
Respondents were also asked to report the size of the group whose work they were describing. As shown below, the majority, by nearly two-thirds (64%), reported on enterprise-wide projects.
Figure 7. Scope of Projects Reported
Considering that 65% of the respondents came from companies with 2500 or fewer employees, it is understandable that most projects would be company-wide.
< 100 (23%) 101-500 (20%) 501-2500 (22%) 2501-5000 (14%) 5001-10000 (5%) >10000 (16%) Entire Enterprise (64%) Division (24%) Department (12%)
3. The Perceived Value of BPM Software
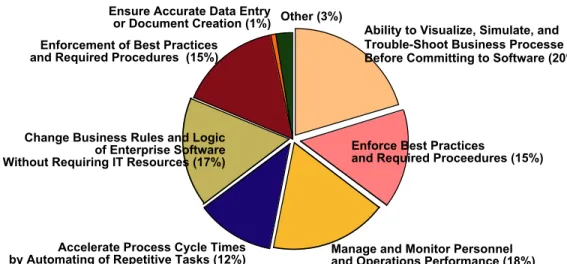
3.1 The Single Greatest Benefit Derived From the Use of BPM SoftwareWhen asked to identify “the single greatest benefit” to be realized from BPMS, respondents offered a variety of responses.
Figure 8. Single Greatest Benefit of BPM Software
One exception to this is the very low ranking of “accurate data correction or document creation” – the comparatively significant benefits offered through BPMS in this area. As shown in Figure 8, this area has consistently ranked low in perceived value. Even among the responses from telecommunications firms, none cited this as the single greatest benefit, despite the fact that the same group has invested disproportionately in order entry and billing (see “Figure 16. Industry Comparison of Process Focus Areas”).
Why is there such an inconsistency? The answer undoubtedly is rooted partly in the fact that BPMS is viewed as a means of managing the lifecycle of business processes across the enterprise, not just data entry.. Yet the fact remains that many BPM software deployments have ultimately been cost-justified based on their ability to eliminate or reduce ”data pollution,” and the personnel cost involved in correcting data entry errors, by taking advantage of capabilities such as validation rules during the entry process and data reuse across multiple applications.
Ability to Visualize, Simulate, and Trouble-Shoot Business Processe Before Committing to Software (20%)
Enforce Best Practices
and Required Proceedures (15%)
Manage and Monitor Personnel and Operations Performance (18%) Accelerate Process Cycle Times
by Automating of Repetitive Tasks (12%) Change Business Rules and Logic
of Enterprise Software Without Requiring IT Resources (17%) Enforcement of Best Practices and Required Procedures (15%)
Ensure Accurate Data Entry
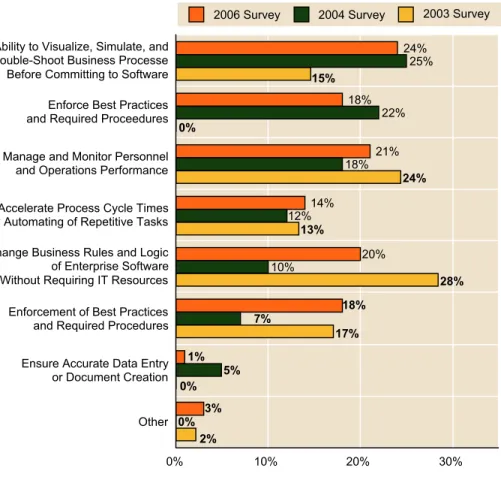
3.2 A Three-Year Perspective on BPMS Attitudes
An analysis of multiple surveys – where the same questions were undoubtedly asked of very different survey populations – shows notable consistency in answers. The notion of changing business logic without IT (read “empowerment of business users”) ranks high, yet plays a lesser role in perceived value ranking, when compared to modeling and simulation. These results are generally consistent across industries and geographies, and in every case the role of modeling and simulation is cited as the top BPMS benefit by about a quarter of respondents.
Figure 9. Three-Year Comparison of BPMS Benefits
This response introduces an interesting question: Can modeling and simulation alone constitute BPM? Our answer is “No,” particularly if the question revolves around a BPMS or “Business Process Management Suite.” Yet modeling and simulation are a valuable part of both process improvement overall and the deployment of BPM software specifically.
Other Ensure Accurate Data Entry or Document Creation Enforcement of Best Practices and Required Procedures Change Business Rules and Logic
of Enterprise Software Without Requiring IT Resources Accelerate Process Cycle Times by Automating of Repetitive Tasks Manage and Monitor Personnel and Operations Performance Enforce Best Practices and Required Proceedures Ability to Visualize, Simulate, and Trouble-Shoot Business Processe Before Committing to Software
0% 10% 20% 30% 24% 25% 15% 18% 22% 0% 21% 18% 24% 14% 12% 13% 20% 10% 28% 18% 7% 17% 1% 5% 0% 3% 0% 2%
4. The State of BPM Initiatives
4.1 Status of All Examined Process Improvement AreasIn order to assess what organizations were doing now, had done in the past, or planned to do around BPM and process improvement, we asked all participants to categorize a specific set of business areas provided, based on their current state of activity. The most commonly active area is departmental process improvement, cited by two-thirds of respondents and involving 95% percent of all respondents at one stage or another, from planning to “sunsetting.”
Figure 10. Status of Business Process Initiatives
The least commonly cited area was still reported by more than two-thirds of respondents as either planned or active – the establishment of a BPM Center of Excellence or dedicated business process practice group. However, as will be shown in several of the following pages, this is the area of activity that is most directly correlated to BPM project success.
The area with the second smallest number of active projects is the use of Business Process Automation Software. Thus, although BPMS is being extensively promoted, most companies are investing in process redesign, using modeling and analysis tools, at this point, and only a relatively smaller group are actually working on BPMS implementations.
Dedicated Business Process Practice Group or Center of Excellence Multi-Department or Enterprise Process Improvement Departmental Process Improvement Use of Business Process Automation Software Use of Process Modeling and Analysis Tools Business Transformation Initiative 24% 15% 22% 36% 3% 7% 20% 16% 53% 4% 28% 16% 18% 38% 5% 14% 16% 61% 4% 12% 22% 16% 45% 5% 27% 15% 20% 36% 1%
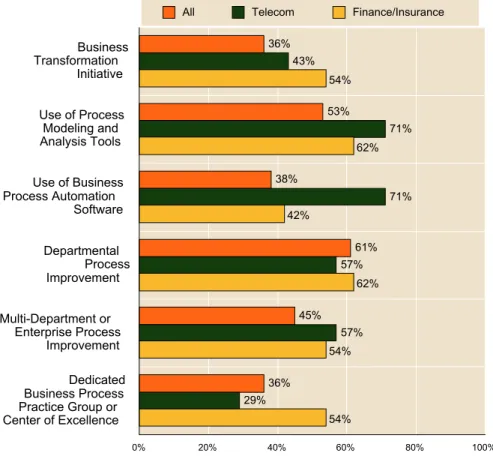
4.2 How Active Business Process Initiatives Compare by Industry
Throughout this report we talk about “BPM” and “process improvement initiatives” as separate but related activities. Clearly, they are not the same: “Process improvement initiatives” are a superset of BPM; you can engage in process improvement (or initiatives that otherwise impact processes with the intent of improvement) without BPM, but not vice versa. Consistent with this, only a third or 38% of respondents cited specific use of process automation software as part of their initiatives.
Figure 11. Industry Comparison of Business Process Initiatives
By a significant measure, Telecommunications firms reported the greatest use of process automation software, and the lowest occurrence of establishing a Center of Excellence. A picture begins to take shape, as described earlier, of the role of BPM inside this sector being a means for reducing transactions costs and automating activities such as provisioning, while being used less as strategic tool for management. (See “Figure 16. Industry Comparison of Process Focus Areas” for addition evidence of this.)
Dedicated Business Process Practice Group or Center of Excellence Multi-Department or Enterprise Process Improvement Departmental Process Improvement Use of Business Process Automation Software Use of Process Modeling and Analysis Tools Business Transformation Initiative 0% 20% 40% 60% 80% 100% 36% 43% 54% 53% 71% 62% 38% 71% 42% 61% 57% 62% 45% 57% 54% 36% 29% 54%
4.3 Use of a BPM Center of Excellence
To gain greater insight into how firms are dealing with BPM practice areas, we further broke down the type of dedicated process team or Center of Excellence, or the lack thereof. The results are striking, as shown in greater detail on the page to follow. Yet where the difference is most pronounced is with regard to reported Return On Investment (ROI) results.
Figure 12. Status of Business Process Initiatives
As shown below, organizations with an identified BPM Center of Excellence reported five times greater ROI over those with no Center of Excellence or dedicated process team. Similarly, those with a dedicated business process team in place reported nearly twice the ROI of those without any dedicated team in place.
Figure 13. Distribution of Reported ROI by BPM Program Type 107% 26% 18% 44% Center of Excellence BP Team No CoE or BP Team All Respondents Successfully Implemented BPM Center of Excellence (15%) Plan to Create BPM Center of Excellence (16%)
Identified and Defined Internal Team Tasked With Business Process Services (46%) We Have Not Identified Or Defined Specific Process Team (23%)
4.4 Correlation of BPM Project Success With BPM Centers of Excellence
As shown in Figure 14, there is an undeniable correlation between BPM project success and the leverage of a dedicated process team or establishment of a Center of Excellence. Firms with neither of these in place were significantly more likely to face problems or lack of success with BPM programs. On the other side, the only firms reporting very successful BPM were those with a Center of Excellence or business process team in place.
Figure 14. Correlating BPM Project Success
These results may appear intuitive, and their significance overlooked. That is, successful BPM programs are more likely to be expanded into ongoing BPM programs, while initially unsuccessful programs are less likely to expand. What should not be overlooked, however, is that BPM programs are not likely to succeed beyond the departmental level (if at all) without having in place an organized business process team of some kind. These results also indicate that the best way to ensure success at the enterprise level is to create a BPM Center of Excellence. This observation does beg a question of timing: Which came first, the Center or the success? The answer varies from organization to organization; however, the obvious lesson is that having both a formalized approach and firm management commitment through the creation of a BPM Center of Excellence plays a significant role in the success of a BPM project.
Little to No Success With BPM Initiatives Initially Significant Difficulties With BPM Initatives; Now Experiencing Limited Success Departmental Success With BPM Initiatives; No Success at Enterprise Level Leveraged Early Success Into Repeatable Process Improvement Initiatives Very Successful Enterprise Level BPM Program 0% 20% 40% 60% 80% 100% 0% 6% 12% 9% 15% 29% 27% 26% 35% 27% 32% 6% 36% 6% 0% Center of Excellence BP Team No BP Team or CoE
4.5 Status of BPM initiatives by Business Function
As previously stated, BPM has been applied to areas where transaction costs are highest, which includes customer service, billing and order entry, and back office operations (which cover a broad area, but, indeed, are distinct from front-office functions of customer service and middle-office functions such as finance and accounting processes).
Figure 15. Status of Business Process Initiatives
The high ranking of customer service investments may come as a surprise for some, and could suggest at least two interpretations. One is that it reflects a growing emphasis on the value of the customer in business processes (and the business overall). A more pragmatic, if not pessimistic, assessment, however, is that it does not show that the customer is properly valued, but indicates a belief that customers represent expense transaction costs that can be eliminated through automation and options such as customer self-service (generally, online access to customer oriented services). Anecdotal evidence found in our recent work points to the latter interpretation, although the idealist in us hopes it indicates trend towards customer empowerment.
R&D (e.g. new product development)
Risk Managment (unrelated to compliance) General Administration
Human Resources (benefits, payroll, etc.)
Sales and Marketing IT/MIS (i.e., services management) Supply Chain or
other logistics Manufacturing and Fulfillment Compliance Managment (e.g. Sarbanes Oxley or others)
Order Entry and Billing Back Office Operations Customer Service 0% 10% 20% 30% 40% 50% 60% 70% 80% 90% 100% 11% 41% 49% 23% 32% 45% 32% 30% 38% 45% 28% 27% 54% 20% 26% 38% 37% 25% 35% 42% 24% 38% 38% 23% 41% 40% 19% 38% 44% 18% 58% 32% 10% 68% 25% 7%
4.6 Status of BPM Initiatives by Industry
The high ranking of “Customer Service” on the previous chart can be explained partly by the very high level of its current use in the Telecommunications sector. The same is true to a lesser extent for back office operations and order entry. In these three areas, financial services and insurance lag behind what was reported for Telecom, which may not be true to the same extent industry-wide.
Figure 16. Industry Comparison of Process Focus Areas
What is indeed true and worth noting, however, is that Telecom is one of (if not the) largest adopter of process automation to reduce customer transaction costs. As shown, it is also true that financial services and insurance firms are investing in BPM to ensure compliance with regulatory requirements.
R&D (e.g. new product development)
Risk Managment (unrelated to compliance)
General Administration Human Resources (benefits, payroll, etc.)
Sales and Marketing IT/MIS (i.e., services management)
Supply Chain or other logistics Manufacturing and Fulfillment Compliance Managment (e.g. Sarbanes Oxley or others)
Order Entry and Billing Back Office Operations Customer Service 0% 10% 20% 30% 40% 50% 60% 70% 80% 90% 100% 49% 86% 54% 45% 83% 46% 38% 67% 31% 27% 17% 50% 26% 33% 15% 25% 0% 15% 24% 33% 15% 23% 33% 15% 19% 33% 31% 18% 17% 17% 10% 0% 8% 7% 17% 0% All Current Telco Finance/ Insurance
4.7 Types of BPM Initiatives Currently Under Way
In order to assess the nature of current activity, firms were asked to categorize the projects they do have in place (i.e., those relating to “Current” on the previous two pages). Some of these are left intentionally vague and broadly defined (e.g., “Improving Existing Projects”), and others were far more specific (using “Process Automation Using ERP Software.”) The reason was to allow some calibration of responses – for example, nearly everyone responding to the survey should have engaged in process improvement, but many fewer should be using ERP or a BPMS.
Other Monitoring Performance
of Managers Process Automation Using ERP Software
Delivery of Process Performance Data to Senior Executives Process Automation Using a BPMS Measuring Organizational Performance Enterprise-Wide Processes Modeling Redesigning a Major Business Process Improving Existing Processes
0% 20% 40% 60% 80% 100% 75% 56% 45% 36% 33% 31% 24% 18% 6%
Figure 17. Distribution of Active Projects
Examples in the “Other” category include matters such as the evaluation of outsourcing options for key business process, consolidation of fragmented projects and initiatives, documenting processes within a single repository and design tool, using BPM as a front-end to application development, and facilitating workflow automation within global ERP environment.
4.8 Currently Active BPM Initiatives by Industry
Examining existing projects by industry produced some interesting results. One such finding pertains to the Telecommunications firms among the respondents. It has been clearly indicated throughout that, while these firms are engaged in more prosaic matters, such as automating back office processes, they also indicated the greatest number of initiatives in process modeling and enterprise process redesign.
Figure 18. Active BPM Project Types by Industry
Within the analysis of this research, a picture has begun to emerge among the Telecom firms reporting, showing strategic work at the business strategy level, with technology investments focused on specific tangible areas such as customer transaction costs.
Other Monitoring Performance of Managers Process Automation Using ERP Software
Delivery of Process Performance Data to Senior Executives Process Automation Using a BPMS Measuring Organizational Performance Enterprise-Wide Process Modeling Redesigning a Major Business Process Improving Existing Processes 0% 20% 40% 60% 80% 100% 75% 71% 92% 88% 64% 56% 71% 53% 66% 50% 45% 71% 46% 55% 42% 36% 28% 38% 22% 50% 33% 57% 38% 55% 21% 31% 42% 46% 55% 14% 24% 57% 15% 44% 18% 28% 7% 22% 21% 6% 7% 11% All Respondents Telecom Finance/ Insurance Gov't/Military Professional Services
4.9 Reasons BPM Software Was Not Yet Deployed
For organizations where BPM has not yet been deployed, the most common answer (36% of total) was that existing resources would be used. This likely speaks more to the sophistication of the survey population, rather than to a growing shift away from adoption of BPMS software.
Figure 19. Why BPM Not Deployed
One of the facts which points to this interpretation is that in past surveys the single greatest reason cited for why BPM software was not yet deployed has consistently been the lack of a business case. In this survey, however, this issue ranks relatively low. Instead, the notion of using internal resources points to a larger, overall embracing of BPM, whether or not it leads to the specific purchase of BPM software licenses.
Unable to Develop Business Case (7%) Unable to Successfuly Deploy BPMS Already Owned (11%) Unable to Find Project Sponsor (11%) No Perceived Benefit to BPM (14%) Cannot Agree on BPM Vendor (4%) Using Existing Resources (36%) Other (18%)
5. Measuring BPM Success and Return On Investment
5.1 Reported Success of BPM InitiativesFigure 20 shows that among all respondents approximately one quarter (23%) have been able to leverage early BPM success into repeatable programs. Yet in Financial Services and Insurance, this figure jumps to nearly two-thirds, or 62% of the respondents from the industry sectors, indicating a disproportionate level of success there. This is, of course, consistent with the fact that respondents in this sector were nearly twice as likely to have in place a BPM Center of Excellence, which has been shown throughout this analysis to present a high co-efficient for success.
Figure 20. Success Level by Industry
It is worth noting that the responses among professional services firms are disproportionately high; this is at least partly attributable to the fact that, as demonstrated in Figure 16, services firms show little to no software adoption and, instead, are reporting largely on general process improvement initiatives, rather than BPMS deployments.
Other Have A Very Successful Enterprise BPM Program Have Leveraged Early Successes and Translated Them Into Repeatable Process Improvement Initiatives
Have Experienced Departmental or Discrete Success With BPM But Have Not Experienced Enterprise-Level Success Initially Experienced Significant Difficulties But Now Experiencing Some Success Experienced Little to No Success With BPM Initiatives 0% 20% 40% 60% 80% 5% 14% 0% 0% 0% 19% 14% 0% 33% 29% 28% 43% 8% 56% 21% 23% 29% 62% 0% 21% 11% 0% 15% 0% 21% 0% 0% 15% 11% 7% All Respondents Telecom Finance/ Insurance Gov't/Military Professional Services
5.2 ROI Analysis of BPM Initiatives by Industry
As shown in Figure 21, respondents overall were more than twice as likely not to have performed any analysis of ROI than respondents specifically from firms in Telecom, Financial Services, or Insurance – and those well ahead of any other sector; Telecom firms performed ROI analysis as part of cost justification in nearly 3 out of 4 cases.
Figure 21. Frequency of ROI Measurement
Although, admittedly, a bit of a generalization, it can be assumed that not performing ROI analysis at any point in a BPM project reflects a less sophisticated or less sincere approach to BPM. This inference is based on the fact that a lack of ROI analysis generally reflects a lack of awareness of business impact or, otherwise, a lack of accountability for the financial consequences of BPM investment.
In contrast, ongoing ROI analysis demonstrates a commitment to understanding and measuring the business value generated by BPM investments. In fairness to respondents, however, some of them demonstrated a knowledge of BPM business impact in areas not directly related to ROI, such as improved customer service and faster inventory turnover.
ROI Analysis is Done Periodically as Part of an Ongoing Assessment
ROI was/will be Analyzed Upon
Final Roll-Out ROI was Analyzed After the Initital Pilot ROI was Analyzed in Advance
as Part of Cost Justification ROI was Not Analyzed
0% 25% 50% 75% 100% 35% 14% 16% 36% 71% 41% 8% 14% 16% 7% 0% 8% 14% 0% 16% All
5.3 Metrics Used to Measure ROI Success
The most commonly cited metric for measuring ROI success is IRR or Internal Rate of Return. This is the measure of the discount rate often used in capital budgeting that makes the net present value of all cash flows from a particular project equal to zero; thus, the higher the IRR, the greater the value. This enables IRR to be used to rank several prospective projects, even in cases where the general parameters of these projects are dissimilar. Although the final rate of return that a given project ends up generating may differ from its estimated IRR, the project with the highest IRR would nonetheless provide the greatest opportunity for the highest return. For these reasons, IRR is generally favored by internal financial analysts and those engaged in capital budgeting.
Figure 22. Success Metrics for BPM Projects
Figure 22 reflects that all used measures and answers were not mutually exclusive from one another. For example, a firm may use IRR to justify the project initially and Inventory Turnover to measures its ongoing performance. One surprising result, however, is the low percentage of respondents citing Earnings Per Share (EPS) as a performance metric. Any project able to demonstrate a favorable impact on EPS is going to enhance the careers of any project manager or sponsor involved, but the low occurrence likely reflects the difficulty of rolling-up project results into EPS calculations.
Other metrics cited include Transaction Volume, Regulatory Compliance, Time-to-Value, Risk Reduction, Audit Report (GAO), Customer Retention, Increased Revenue, Direct Cost Reduction, Systemic Value-Added (SVA), and Corporate KPIs.
Other P/E or Earnings Per Share Inventory Turnover Return On Assets (ROA) Return On Equity (ROE) Cost performance index Economic Value Added (EVA) Internal Rate of Return (IRR)
0% 10% 20% 30% 40% 50% 40% 29% 29% 15% 13% 10% 4% 26%
5.4 Comparison of Success Metrics Used by Industry
As Figure 23 illustrates, the distribution of performance and success metrics is generally uniform across industry sectors, when examining Telecom, Finance, and Insurance (shown simply as “Finance”) against the aggregate of all respondents under “All.” The most visible exception to an otherwise even distribution, however, is the disproportionately higher instances of Internal Rate of Return (IRR) by Telecom firms, which is also seen to a lesser extent with Return On Assets (ROA), a metric often used in conjunction with IRR.
Figure 23. Success Metrics by Industry
These findings are consistent with the fact shown in Figure 19 that Telecom firms (at least respondents to this survey) were far more likely to perform ROI analysis in advance as part of a cost-justification exercise. In particular, because IRR is most useful for estimating future returns from present-day investments, rather than as a measurement of current or real-time business performance, it is not surprising to see IRR so favored as a performance measurement by Telecom firms. Other P/E or Earnings Per Share Inventory Turnover Return On Assets (ROA) Return On Equity (ROE) Economic Value Added (EVA) Cost Performance Index Internal Rate of Return (IRR) 0% 20% 40% 60% 80% 100% 40% 66% 50% 29% 33% 16% 29% 33% 41% 15% 0% 16% 13% 16% 8% 10% 0% 0% 4% 0% 0% 26% 16% 25%
5.5 How ROI Benchmarks and Expectations Were Established
Very often in the course of our consulting work we are asked questions like 1) “What is the appropriate target for Return On Investment?” and 2) “How do most firms determine this target?”
Although Figure 23 provides some expectations for what type ROI results a firm might shoot for ,based on industry results, Figure 24 shows that a given “hurdle rate” of minimum acceptable results is most likely to be established by management fiat or mandate. Typically, this is based on an established minimum Internal Rate of Return (IIR), since this metric is so readily applicable across dissimilar investment areas. What does the IIR come from? Generally, such a mandate, or the establishing of IRR expectations, comes from a combination of the cost of capital and the perception of alternative investment returns.
Figure 24. Source of ROI Requirements
What should be clear, however, is that investment returns for BPM should not be treated any differently than any other use of capital. Although BPMS software is sometimes promoted as offering “high ROI potential,” this is essentially a vacuous position. Investments in BPMS software carry the same risks as any other software deployment, and the onus is on the firm to connect software functionality with business value. It is accurate to assert, however, that a focus on process improvement can make the benefits both more visible and more tangible.
Management Mandate Expectations Established by Previous Investments Current Alternative Investment Returns Cost of Capital or WACC Other 0 0.1 0.2 0.3 0.4 0.5 0.6 0.7 63% 21% 9% 7% 5%
5.6 Time Frame Used for Measuring Project Success
Figure 25 shows the results when respondents were asked to indicate the time frame used to measure project success. This does not reflect actual measured success, but, rather, what the expectations were at the outset of the project and what period of time would be used to measure project success.
Figure 25. ROI Time Frame
The results from this question were generally unremarkable; however, this should not discount the fact that it is extremely important to have a mutually agreed upon time frame for measuring project success. The alternative is to risk that projects are prematurely assessed as failures, or to let them drift off into perpetuity without ever being properly assessed. In the case of the survey, most respondents reported expectations of realizing a positive ROI within 2-3 years, which is generally a reasonable expectation for well-executed projects (all other factors being equal). The most aggressive were firms in the Financial Service and Insurance sector, among whom 80% expected break-even results or profitability within the first 12 months.
Other Profitable Within 12 months Break-Even Within 12 months Positive ROI Within 2 years Positive ROI Within 3 years 0% 10% 20% 30% 40% 50% 20% 30% 20% 33% 27% 30% 33% 16% 10% 40% 33% 20% 20% 40% 18% 10% 16% All Respondents Telecom Finance/ Insurance Gov't/Military
5.7 Allocation of BPM Spending Categories as Percent of Project Budgets
Figure 26 shows the distribution of budget dollars by activity area. For example, 2% of the responses allocated nothing ($0) for Process Analysis and/or Requirements Analysis, 35% of respondents allocated 1-10% of their budgets to this area, and 23% allocated greater than 30%. Although this distribution shows that allocations varied widely, the overall area of greatest concentration for budget allocation is, not surprisingly, new software purchases (with 24% of respondents allocating more than 30% of budgets to this) and process/requirements analysis, which commanded more than 30% of budget allocations for a quarter of the respondents, and more than 20% of total budgeted dollars for nearly half (43%) of respondents.
Figure 26. Allocation of Project Budgets
The area showing the least percent of budget dollars is New Hardware, with nearly a quarter of respondents allocating nothing ($0) to this area. In total, two-thirds of respondents allocate less than 10% to hardware purchases and only 9% allocate greater than 30% (and among these the vast majority anticipates spending 30% - 40% to new hardware purchases).
Training and Change Management Services Deployment, Integration and Customization Services
New Hardware Software Purchases
and/or Licensing Process Analysis and/or
Requirements Analysis 2% 35% 20% 20% 23% 13% 29% 24% 11% 24% 23% 41% 19% 9% 9% 8% 20% 33% 22% 18% 8% 38% 25% 17% 12% 0% 1-10% 11-20% 21-30% > 30%
5.8 Distribution of Existing Spending on BPM
Figure 26 shows the distribution of existing BPM investments, broken out by software, business process services, and training or “methods” (referring to third-party assistance for business process analysis and optimization methodology.) In this case, the percentages refer to frequency of mention, not the distribution of investment dollars. For example, 57% of respondents reported spending less than $100,000 on BPM training, while 4% reported spending over $5 million on the same type of services.
Figure 27. Distribution of Existing BPM Investments
Not surprisingly, the majority of responses are grouped around the lower end of the spectrum. This is typical and accurately reflects the state of the market. Because it takes 10 transactions of $500,000 to equal $5 million, a distribution such as this will show more of smaller transactions. In fact, there are more transactions that are less than $1 million than those that are greater than $1 million. In the area of software spending, only 14% of respondents reported having spent greater than $1 million, and only half of these (or 7%) have spent greater than $2.5 million.
Investments in business process services follow a pattern similar to BPM software investments, with only 14% of the respondent’s reporting spending greater than $1 million and only 8% reporting spending an amount greater than $2.5 million. It should be noted, however, that, given the nature of the questions we asked and the target audience we examined, “business process services” refers more specifically to process improvement initiatives, as generally pursued in the course of business process management projects. These numbers do not reflect spending on other service areas such as “Business Process Outsourcing.”
0 <$100K $101-250K $251-500K $501-1M $1.1-2.5M $2.6-5M >$5M 0% 10% 20% 30% 40% 50% 60% 70% 22% 13% 18% 34%34% 57% 9% 21% 6% 12% 10% 9% 9% 6% 4% 7% 7% 1% 3% 4% 0% 4% 4% 4% BPM Software
Business Process Services
5.9 Distribution of Reported ROI Measured After Project Rollout
When asked to provide the rate of ROI already measured among existing projects, the majority responded somewhere between 20% and 60% using a fill-in-the-blank method. Respondents were asked to provide a specific number on the basis that the number would be individually disclosed, and all responses were categorized and factored into the average calculation of 44% ROI and a 30% median.
Figure 28. ROI after Project Roll-Out
A handful of firms reported ROI in excess of 100% with a smaller group citing returns of between 200% and 300% ROI. Yet the vast majority was grouped around the mean, as illustrated in the above spatial diagram.
No firms reported ROI of less than 10% nor cited results in terms of negative returns. This result can likely be explained in part by the fact that bad news is typically not reported in this type of survey. Also, projects that are likely to show negative, or otherwise poor, returns are often easily identified and not likely to be analyzed.
Although limiting publication to “good news” is a common practice, it is worth mentioning that the analysis of poor results can be just as valuable (if not more so). The lesson has been taught before that those ignorant of the past are doomed to repeat it. Yet it is often difficult to find firms willing to be transparent about failed projects, and the results reported in this case are consistent with that tendency; like the children of Lake Wobegon they are all above average (or, at least, lack striking failures).
Summary
In most ways this report agrees with the survey that BPTrends undertook in February of 2006. Companies are engaged in a wide variety of BPM activities and are moving into new areas slowly. More are using process modeling tools to do process redesign than are using BPMS tools to undertake the development of runtime process management systems, for example. One of the most striking revelations of this survey and its subsequent analysis was the high correlation between BPM project success and the leverage of some type of formalized discipline or practice area, most notably a BPM Center of Excellence. Firms with a Center of Excellence in place were six times more likely to report “very successful” enterprise-wide BPM initiatives than firms with just a dedicated BPM team, and had infinitely greater success rates than those with neither (since 0% of respondents without either a Center of Excellence or a dedicated BPM team reported “very successful” initiatives, and only 6% reported any results that can be leveraged). The difference in success rates is even more pronounced when it comes to reported Return On Investment (ROI) results. Firms citing the existence of a BPM Center of Excellence were five times more likely to be successful than firms with no Center of Excellence or those with just a dedicated BPM team in place (See Figure 13. Distribution of Reported ROI by BPM Program Type.) Although there is still room for debate on the issue of timing (i.e., which came first, success or Center of Excellence), there is overwhelming evidence to support the positive correlation between project success rates and the degree of formalization of BPM methods. Among industries, Financial Services and Insurance have consistently shown the greatest success. Given the large number of respondents from these sectors (combined into a single group within the survey), it is not likely that these results were anomalous, but, rather, they reflect the greater maturity of these sectors overall when it comes to both BPMS adoption and business process improvement initiatives.
Another sector that is well represented within the pool of respondents is Telecommunications (representing 10% of total respondents versus 19% for Financial Services and Insurance). Yet respondents from Telecom firms consistently did not report the same degree of success as those from Financial Services and Insurance, nor did those from Professional Services or Government, that, combined, represent about a third of total respondents.
Overall, the major conclusion of this survey is that both the use of BPMS software and business process improvement initiatives in general are yielding favorable results for most users. The area remains relatively immature. Only a handful of firms are able to realize consistent, repeatable results. The firms that are achieving results are those that have made a commitment to a dedicated BPM practice area, most notably, a BPM Center of Excellence.
Author
Nathaniel Palmer
Nathaniel Palmer is President of Transformation+Innovation, as well as the Executive Director of the Workflow Management Coalition. Previously he was Director, Business Consulting for Perot Systems Corp, and also spent over a decade with Delphi Group serving as Vice President and Chief Analyst.
The author of over 200 research studies and published articles as well as the critically-acclaimed management text, “The X-Economy” (Texere, 2001), Nathaniel is a widely-recognized industry expert who has been featured in numerous media ranging from Fortune to The New York Times. He has authored dozens of articles in IT publications such as CIO and InformationWeek, as well as regular columns in Enterprise Open Source Journal and Business Integration Journal. He is also the Senior Technical Editor of Business Transformation and Innovation, a bi-monthly management journal.
He has been featured as a guest expert on National Public Radio and World Business Review, and is also a regular speaker at leading BPM forums including Business Process eXcellence, ProcessWorld, Shared Insight’s Business Process Management Conference, Intelligent BPM, and the Metastorm Global BPM Forum & User Conference.
Nathaniel is on the advisory boards of many relevant industry publications, such as E-DOC, Business Integration Journal and Business Transformation Journal, as well as the Board of Directors of Association of Information Management (AIIM) NE, and was nominated to represent the Governor of Massachusetts on the Commonwealth’s IT Advisory Board.