2016 International Conference on Computer, Mechatronics and Electronic Engineering (CMEE 2016) ISBN: 978-1-60595-406-6
Machine Visual Location Method Research in Robot Unstacking
Jin-Quan LI, Fang CUI
*, Qi GUAN
and Rui ZHANG
Automation School, Beijing University of Post and Telecommunication, 100876, China
Keywords: Machine visual; Image segmentation; Camera calibration; Work pieces’ location
Abstract. Work pieces’ location based on machine visual in robot unstacking job has been researched. Adaptive threshold segmentation and modified Hough Transform are used to extract the target region needs further processing. A new method is proposed to choose the appropriate threshold to binary different images with different brightness. Watershed algorithm and Morphology algorithm are used to detect and connect the edges of work pieces. With the distance sensor and camera calibration to complete the location of pallet and work pieces, guiding robot to finish unstacking job successfully.
Introduction
Nowadays, methods of robotic technology with machine visual technology in detecting work pieces' position and shape is rarely used in the industrial robot unstacking operations. Zheng Kui-Jing [1] and others used region growing method to extract the spline area and analyze geometry to achieve precise position based on feature points matching spline, guiding robotic Assembly. Wang Huan-Huan [2] and others adopted MORLC multi directional length encoding method to achieve rapid detection and location of object characteristics, which is suitable for moving objects with changing perspective. Above methods are not suitable for positioning workpieces and pallets under light with changing illumination. A new method is proposed to search the appropriate threshold for images with different illumination to improve the detection accuracy in some extent.
Vision System Design
A machine visual experiment platform have built based on Nachi industrial robots, including work pieces placed module, vision module, robot control module and unstacking module. Work pieces placed module is consistent of conveyor belt and pallet. Vision module is consistent of camera mount, Basler Gigabit Ethernet industrial cameras acA3800-10gm, laser distance sensors DMG-30
and general lighting lamps in factories. Machine control module receives data from computer to control unstacking module which is consistent of robotic arm and hand to finish unstacking operation.
Image Pre-processing
Image segmentation
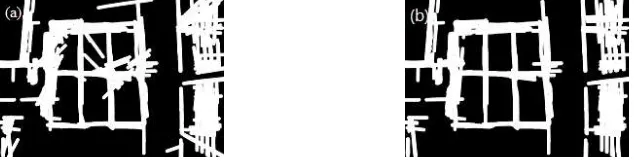
to detect straight lines in Fig. 1 (b). The difference between modified and traditional Hough transform is that modified Hough transform detect all straight lines in image first and then calculate slope 𝑘 of each straight line, if slope 𝑘 satisfy the inequality,
0.176 < |𝑘| < 5.67,
which means the angle between the straight line and the horizontal direction or the vertical direction
Figure 1. Result of adaptive threshold segmentation. (a) Before segmentation. (b) After segmentation.
is more than 10 °, in other words, the straight line deviates much from the horizontal direction or the vertical direction, which means the straight is unqualified and should be deleted. Table 1 shows the quantity of straight line and the time spent in represent these straight lines in two different methods.
Table 1. Comparison of Hough transform modified before and after.
traditional modified
quantity 1457 308
Time[s] 0.507 0.357
To compare the traditional and modified Hough transform, detect straight lines in traditional and modified Hough transform method respectively, then draw the straight lines in a new image which has same size as original image, the result is shown in Fig. 2. Obviously, modified Hough transform is more suitable for detecting the boundary of target connected region.
Figure 2. Result of Hough transform. (a) Traditional method; (b) Modified method.
Extract the Target Region
After using modified Hough transform, all connected regions in Fig.1 (b) are detected. Taking area as the criterion to search the target region A which has the biggest area, meaning work pieces placed area, as shown in Fig 3 (a). The result image B of AND operation between Fig. 3 (a) and Fig. 1 (b) is
shown in Fig. 3 (b), apparently through above image processing steps, the amount of data and influence of noise greatly reduced, which makes much easier for post image processing.
Dynamic Global Threshold Segmentation
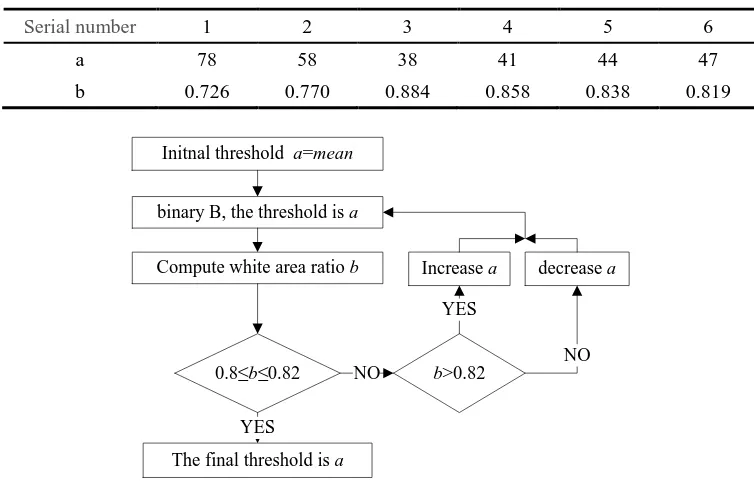
[image:3.595.107.484.247.491.2]Considering the illumination variation of light is relatively large, the effect of using fixed threshold to binary target region B will be poor, so a new method is proposed to search the appropriate threshold for images with different illumination to improve the detection accuracy in some extent. The specific steps are shown in Fig. 4. Where mean is the average gray value of the target area B, Table 2 lists the value of changing a and b in the dynamic threshold iterations process of region B in Fig. 3 (b).
Table 2. Change of a and b in dynamic threshold iterative process
Serial number 1 2 3 4 5 6
a 78 58 38 41 44 47
b 0.726 0.770 0.884 0.858 0.838 0.819
The final threshold is a
decrease a
binary B, the threshold is a
Initnal threshold a=mean
Increase a
b>0.82
0.8≤b≤0.82
YES
NO NO
YES
Compute white area ratio b
[image:3.595.100.504.540.742.2]Figure 4. Dynamic threshold iterative process.
Fig. 5 shows results of global threshold segmentation of images with different illumination, where m is the average gray level of image and t is the global threshold obtained by iterative method in Fig. 4.
m =128 m =78 m =36
t =57 t =47 t =22
Workpiece Positioning
Workpiece Separation
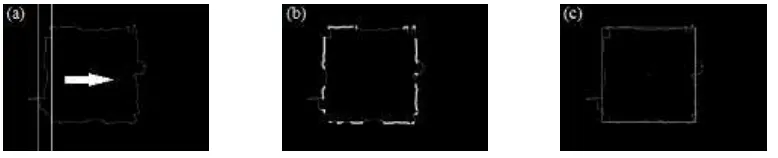
In order to separate all workpieces, first erode target area B in Fig.5, making gaps between workpieces more obvious to improve the separation accuracy, while reducing the impact of noise. Then extract the all contours in B after erosion. Contours inversion has been dilated, as is shown in Fig. 6 (a).
[image:4.595.95.492.178.255.2]
Figure 6. Workpiece separation results. (a) First step; (b) Second step; (c) Final separation result.
In fact, after above steps all workpieces may not completely separated, as is shown in Fig. 6 (a). Using modified Hough transform mentioned above can connect the break of white boundary and the separation result of the workpieces is shown in Fig. 6 (b). Extracting the contours of each separated workpiece to complete the separation of all workpieces, calculate the centroid of each separated workpiece. As shown in Fig. 6 (c), the centroid’s location is marked with white spots.
After the experiment, it is found that the workpiece surface pattern and incomplete pile type has a great influence on the accuracy of the positioning of the workpiece. Therefore, the accurate rate of tray positioning is proposed.
Pallet Positioning
Pallet Contour Extraction
After global threshold segmentation of target area B, there is still noise in B, as is shown in Fig. 5. In order to eliminate noise, using morphological open operation for target area B in Fig. 5 and then searching the contour which has the biggest area in Fig. 5. Take a rectangular window which has certain width, slide from the four directions to center point of the image with the appropriate step, as shown in Fig. 7 (a). Where the width of window is 20 pixels and the step is 5 pixels.
[image:4.595.105.494.558.637.2]
Figure 7. Pallet positioning. (a) Searching points; (b) Fitting points’ extraction result; (c) Pallet positioning result.
Computing the number of white pixels in the window and donated the number, denoted as N, searching the position of window where has the biggest N and collect all white pixels in the window of the specific position in point set U1,U2,U3 and U4. As is shown in Fig. 7 (b), the gray thickened part is the points to be fitted in the four directions of the detected contour.
Linear Fitting Locate the Pallet
First fit an edge as a reference, then fit the adjacent edges in the vertical direction and fit the other edges in turn. Specific implementation process is as following:
1) Compare N of four point sets and sort them in descending order assumed as U1, U2, U3 and U4; 2) Fitting U1 gives the line L 1 as the reference edge;
3) Fitting the points set vertical to U1 gives line L 2 and L 2⊥L1; 4) Fit others point sets in same way.
Fig. 7 (c) shows the result of fitting points sets based on above steps.
Camera Calibration
The module in Zhang’s camera calibration [3] is
𝑠 [ 𝑢𝑐 𝑣𝑐
1
] = 𝑘𝑐(𝑅𝑐[
𝑥𝑤
𝑦𝑤
𝑧𝑤] + 𝑡𝑐),
(1)
where 𝑠 is scale factor, 𝑘𝑐 = [
𝑓𝑥 0 𝑜𝑥 0 𝑓𝑦 𝑜𝑦
0 0 1
] is the intrinsic matrix of the camera, 𝑅𝑐, 𝑡𝑐 are the
extrinsic parameters with 𝑅𝑐 the rotation matrix and 𝑡𝑐 the translation vector. Considering influence of the camera lens, there is a derivation between the actual and the ideal image pixel coordinates, which is called lens distortion. A lens distortion mathematic model is
𝑢′= (1 + 𝑎
0𝑟2+ 𝑎1𝑟4+ 𝑎2𝑟6)𝑢 + 𝑠0𝑟2+ (𝑝0+𝑝2𝑟2)(𝑟2+ 2𝑢2),
𝑣′= (1 + 𝑎
0𝑟2+ 𝑎1𝑟4+ 𝑎2𝑟6)𝑣 + 𝑠1𝑟2+ (𝑝1+ 𝑝3𝑟2)(𝑟2+ 2𝑣2),
𝑟2 = 𝑢2+ 𝑣2. (2) where (𝑢, 𝑣) is the ideal image pixel coordinate without distortion, and (𝑢′, 𝑣′) is the distorted actual image pixel coordinate, and (𝑎0, 𝑎1, 𝑎2), (𝑠0, 𝑠1), (𝑝0, 𝑝1, 𝑝2, 𝑝3) are coefficients describing radial, prism, and tangential lens distortions, respectively. Use the calibration plate to calibrate the camera's intrinsic and extrinsic parameters and the distortion factor, joined with the distance measured by the distance sensor and formula (1) and (2), the image pixels coordinates of centroid of work pieces and the four corner points of detected pallet can be transformed into world coordinate.
Conclusion
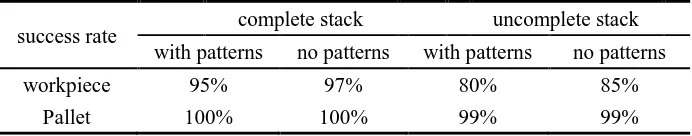
[image:5.595.126.472.682.750.2]The experiment was carried out for four periods of time and 800 pictures was taken in different weathers. As it can be seen from Table 3, woven bag pattern and stack-type have more influence in positioning the workpiece. Comparing with positioning the workpiece, positioning the pallet is more stable and accurate. The whole program for the application of robot vison using in Robot unstacking is an innovation and needs further study.
Table 3. Success rate of different situation.
success rate complete stack uncomplete stack with patterns no patterns with patterns no patterns workpiece 95% 97% 80% 85%
References
[1] Kuijing Zheng, Chunying Pan, Fei Xu. Visual guiding and positioning technology of robotic assembly, J. Design and Research. 3 (2016) 84-90.
[2] Huanhuan Wang, Qinping Yang, Xiangjun Wang. A fast test and recognition method for object character. J. Infrared and laser Engineering. 46 (2014) 1002-1008.