http://dx.doi.org/10.4236/mme.2016.62008
Performance Study of Refrigeration Units
That
Use the Refrigerant R-404A by Using
Computer Simulation
Abed Alrzaq Sleman Alshqirate
Associate Professor of Mechanical Engineering, Alshoubak University College, Al-Balqa’ Applied University, Al-Salt, Jordan
Received 29 August 2015; accepted 5 May 2016; published 11 May 2016
Copyright © 2016 by author and Scientific Research Publishing Inc.
This work is licensed under the Creative Commons Attribution International License (CC BY).
http://creativecommons.org/licenses/by/4.0/
Abstract
The performance parameters of vapor compression refrigeration units that used the refrigerant R-404A were studied by developing a computer simulation algorithm. The various performance parameters investigated per one kilowatt of refrigeration capacity, such as the mass flow rate, the compressor power consumption, the condenser heat rejection rate, the compressor exit tempera-ture and the coefficient of performance. Two refrigeration cycles were tested under various eva-porating and condensing temperatures: the standard cycle and the ideal cycle with superheating and sub-cooling. The results of the present work reveal that the compressor power variation over the evaporating temperature range from −10˚C to 15˚C at Tc = 40˚C is decreased by 38.8% for standard cycle and by 43.8% for ideal cycle. The compressor power variation over the condensing temperature range from 30˚C to 50˚C at Te = 10˚C is increased by 122% for standard cycle and by 54.5% for ideal cycle. On the other hand, the COP for the ideal cycle with 5˚C superheating and sub- cooling is approximately 25% higher than that of the standard cycle at Te = 10˚C and Tc = 40˚C for the refrigerant R-404A.
Keywords
Refrigeration Units, R-404A, Computer Simulation, Refrigeration Performance Parameters
1. Introduction
blend, colorless, odorless mixture of a near azeotropic blend (44% R125, 52% R143a and 4% R134a), are being used and introduced as a replacement for ozone depleting refrigerants. Motta et al.[1] investigated experimen-tally the critical flow of azeotropic mixtures R-407a and R-404A through adiabatic capillary tubes. The results were presented in both graphical and tabulated forms and were intended to be a contribution to the development of environmentally benign refrigeration systems. Zhang and Webb [2] developed a new correlation for two- phase friction pressure drop in small diameter tubes by modifying the Friedel correlation. Motta et al. [3] ex-plored a visual study of R-404A/oil flow through adiabatic capillary tubes, with special emphasis on the beha-vior of the vaporization point. The results showed trends of mass flow rate, and gave some useful insights about the location of the vaporization point for various oil concentrations and operating conditions. Ould Didi et al.[4]
predicted the two-phase pressure gradients of refrigerants during evaporation in two horizontal test sections for five refrigerants (R-134a, R-123, R-402A, R-404A and R-502). These data have then been compared against seven two-phase frictional pressure drop prediction methods. It was observed that the peak in the two- phase frictional pressure gradient at high vapor qualities coincided with the onset of dryout in the annular flow regime. Llopis et al.[5] presented the experimental performance evaluation, from an energy point of view, of R-404A and R507A refrigerant mixtures in an experimental double-stage vapor compression plant driven by a compound compressor. Zhou et al.[6] presented an experimental study on pulsed spray cooling with refrigerant R-404A in laser surgery. With a low boiling point (−45.5˚C at 1 atm) and high volatility, cryogen R-404A has the potential to replace current R-134a (−26.1˚C at 1 atm) for improved therapeutic outcome of dark skins in continuous laser treatment. Sapali and Pradeep [7] investigated experimentally the heat transfer during condensation of HFC-134a and R-404A inside of a horizontal smooth and micro-fin tube. New correlations based on the data gathered during the experimentation for predicting condensation heat transfer coefficients are proposed for wide range of operating conditions. Chena and Kruseb [8] developed simulation program to study concentration shift for the mixed refrigerants R-404A, R-32/134a, and R-407C in an air conditioning system. Furthermore, this program was used to predict the concentration shift and associated performance changes for the alternative re-frigerant mixtures R-407C, R-32/134a and R-404A. The simulation technique was extensively used in testing refrigeration systems using different refrigerants with different conditions, which means the cost of using labor-atory equipment for experimental tests and effort can be reduced.
Jung and Radermacher [9] performed a computer simulation of single-evaporator domestic refrigerators that charged with pure and mixed refrigerants had been in an attempt to screen out the best substitutes for R12. More efficient heat exchangers are recommended as one of the means of increasing energy efficiency. Alshqirate [10]
used the computer simulation technique to investigate the performance of a window type air-conditioning unit that used the refrigerant R-407c instead of R-22. Joudi et al.[11] presented an experimental and computer per-formance study of an automotive air conditioning system with alternative refrigerants. The major part of this work was an experimental investigation for the use of R290/R600a as a drop-in alternative for R-12 in a proto-type automotive air conditioning system. The results of this work showed good agreement with the experimental and theoretical results available in the literature. The DuPont [12] have been developed and presented tables of the thermodynamic properties of R-404A based on extensive experimental measurements.
The present work developed computer simulation software to study the various performance parameters in a refrigeration unit that used the refrigerant R-404A. The performance parameters are obtained using the saturated standard refrigeration cycle and the ideal cycle with super-heating and sub-cooling for various evaporator and condenser temperatures.
2. Refrigeration Cycle Calculations
The main components of the refrigeration cycle were shown in Figure 1.
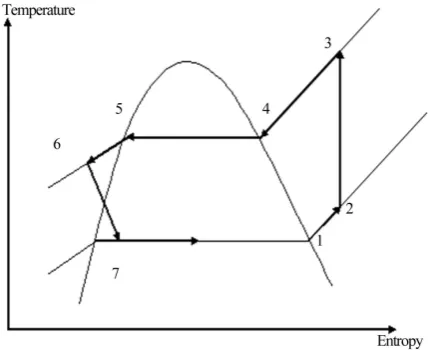
Standard refrigeration cycle and ideal cycle with superheating and sub-cooling can be used to predict the per-formance of the vapor compression cycle, which requires a complete set of refrigerant thermodynamic proper-ties. The standard vapor-compression cycle consist of isobaric heat transfer in condenser and evaporator, isen-tropic compression and irreversible adiabatic expansion as shown in Figure 2.
The states of ideal vapor-compression cycle with superheating and sub-cooling are shown in Figure 3. The various performance parameters of the standard cycle are calculated per one kilowatt of refrigeration ca-pacity i.e. Qref =1 kW.
Figure 1. Schematic diagram of standard vapor-compression cycle.
Figure 2. Temperature-entropy diagram of standard vapor-compression cycle.
Figure 3. Temperature-entropy diagram of the ideal vapor-compression cycle.
(
, ,)
1
e o e i
m
h h
= −
(1)
where
he,o = Specific enthalpy leaving the evaporator and entering the compressor in kJ/kg.
he,i= Specific Enthalpy entering the evaporator and leaving the condenser in kJ/kg.
[image:3.595.206.430.434.609.2](
, ,)
c c o e o
w =m h −h (2)
where
hc,o = Specific enthalpy at compressor outlet and equal to enthalpy entering the condenser in kJ/kg.
The heat rejection, Qref, in the condenser in (kW) per kilowatt of refrigeration is given as:
(
, ,)
ref c o e iQ =m h −h (3)
The coefficient of performance, COP, is obtained by dividing the refrigeration effect by the compressor work:
, ,
, ,
ref e o e i
c c o e o
q h h
COP
w h h
−
= =
− (4)
3. Thermodynamic Properties
In order to calculate the performance parameters of the refrigeration cycles considered in the present work using computer simulation, the thermodynamics properties of the used refrigerant should be presented in simple equa-tion forms. As menequa-tioned previously, The DuPont have been developed and presented tables of the thermody-namic properties of R-404A. All these data were manipulated and converted to simple equations. These equa-tions are presented as follows:
1) Saturated vapor (Tg) temperature:
Tg = A11 (P) 3
+ A12 (P) 2
+ A13 (P) + A14
2) Saturated vapor (Pg) and saturated liquid (Pf) pressure:
Pg = B11 (T)3 + B12 (T)2 + B13 (T) + B14
Pf = B21 (T)3 + B22 (T)2 + B23 (T) + B24
3) Saturated vapor (hg), saturated liquid (hf) and superheated (hs) enthalpy:
hg = C11 (P)3 + C12 (P)2 + C13 (P) + C14
hf = C21 (P)3 + C22 (P)2 + C23 (P) + C24
hs = C31 + C32 (T)
C31 = C33 + C34 (P)
C32 = C35 + C36 (P)
4) Saturated vapor (Vg) and superheated (Vs) specific volume:
Vg = D11 (P)3 + D12 (P)2 + D13 (P) + D14
Vs = D21 + D22 (T)
D21 = D23 + D24 (P)
D22 = D25 + D26 (P)
5) Saturated vapor (Sg), saturated liquid (Sf) and superheated (Ss) entropy:
Sg = E11 (P)3 + E12 (P)2 + E13 (P) + E14
Sf = E21 (P) 3
+ E22 (P) 2
+ E23 (P) + E24
Ss = E31 + E32 (T)
E31 = E33 + E34 (P)
E32 = E35 + E36 (P)
The values of the above coefficients were presented in Table 1 as follows: The temperature and pressure ranges that apply to the above equations are:
• For temperatures from −50˚C to 60˚C.
• For pressures from 80 to 2900 kPa.
4. Computer Algorithm
A computer simulation program was developed to calculate the thermodynamic properties and the performance parameters for the standard and the ideal cycles for the refrigerants R-404A. Matlab software was used as pro-gramming language.
5. Computer Program Codes
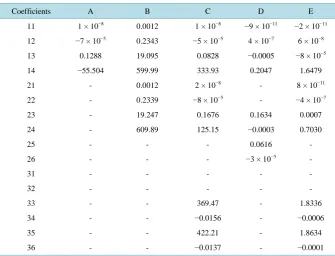
Table 1. Coefficients of equation.
Coefficients A B C D E
11 1 × 10⁻⁸ 0.0012 1 × 10⁻⁸ −9 × 10⁻¹¹ −2 × 10⁻¹¹
12 −7 × 10⁻⁵ 0.2343 −5 × 10⁻⁵ 4 × 10⁻⁷ 6 × 10⁻⁸
13 0.1288 19.095 0.0828 −0.0005 −8 × 10⁻⁵
14 −55.504 599.99 333.93 0.2047 1.6479
21 - 0.0012 2 × 10⁻⁸ - 8 × 10⁻¹¹
22 - 0.2339 −8 × 10⁻⁵ - −4 × 10⁻⁷
23 - 19.247 0.1676 0.1634 0.0007
24 - 609.89 125.15 −0.0003 0.7030
25 - - - 0.0616 -
26 - - - −3 × 10⁻⁵ -
31 - - - - -
32 - - - - -
33 - - 369.47 - 1.8336
34 - - −0.0156 - −0.0006
35 - - 422.21 - 1.8634
36 - - −0.0137 - −0.0001
performance parameters (mass flow rate in (kg/s) per kilowatt of refrigeration, heat rejection rate in (kW) per kilowatt of refrigeration, compressor power in kW per kilowatt of refrigeration, coefficient of performance, compressor discharge temperature in ˚C) with different conditions and for both standard and ideal cycles. Moreover, a comparison computer programs were developed to compare the results of each performance para-meter at different conditions between standard and ideal cycles.
6. Results and Discussion of Results
The comparison between the ideal and the standard cycle for different values of evaporating temperature (Te) and different values of condensing temperature (Tc) are carried out as follows:
1) Figure 4 compares the variation of m with Te and Tc, respectively, for the standard and the ideal cycles. This figure shows that the mass flow rate of the standard cycle is higher than that of the ideal cycle for all values of Te and Tc. This is due to the fact that specific enthalpy difference at the inlet and the outlet of the evaporator for Te and Tc variation results for the standard cycle is lower than that for the ideal cycle.
2) The compressor power, wc, consumed for the standard and the ideal cycles as Te and Tc increase shown in Figure 5. The wc for the standard cycle is higher than that for the ideal cycle. This difference in wc in-creases as Te or Tc inin-creases, because the difference in m for both cycles increases as Te or Tc increases.
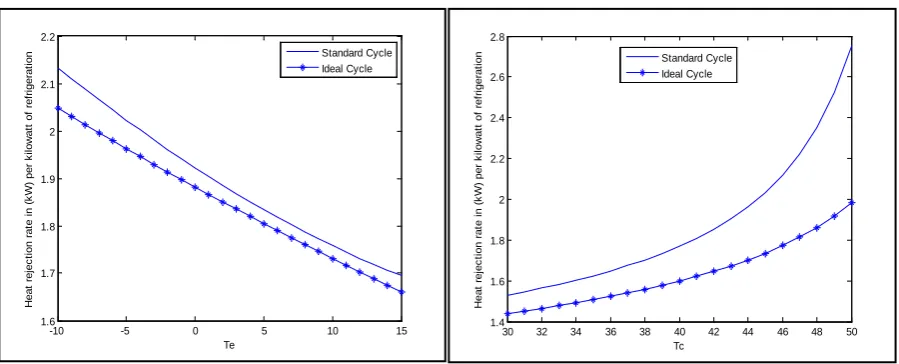
3) Figure 6 shows the comparison of the heat rejection rate, Qrej, for the standard cycle with that for the ideal cycle with variation of Te and Tc, respectively. From this figure it can be noticed that the heat rejection rate for the standard cycle is slightly higher than that of the ideal cycle for all values of Te and Tc. This differ-ence in Qrej increases as Te or Tc increases, because the difference in m for both cycles increases as Te or Tc increases.
4) The discharge temperature in Figure 7 shows the comparison of the standard cycle with that of the ideal cycle for the variation of Te and Tc, respectively. The compressor discharge temperature of the ideal cycle is higher than that of the standard cycle for all values of Te and Tc due to the compressor inlet temperature rise because of superheating state, which increases the compressor exit temperature.
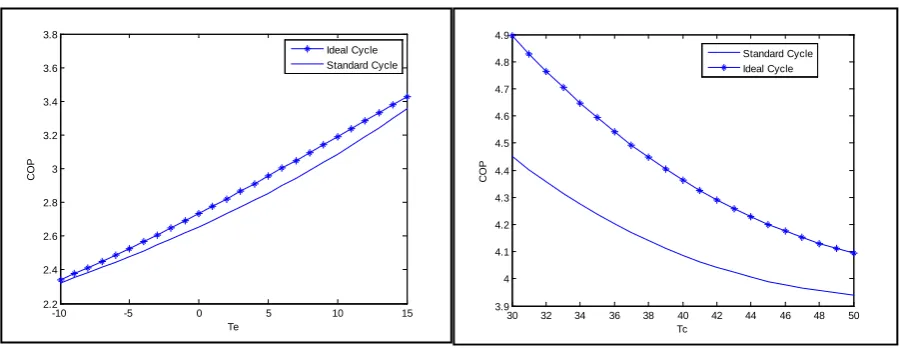
5) Figure 8 compares the coefficient of performance, COP, with Te and Tc, respectively, for the standard and the ideal cycles. The COP of the ideal cycle is higher than that of the standard cycle as seen from this figure. This is due to superheating and sub-cooling effect in the ideal cycle which cause the refrigeration effect Qref, to
Figure 4. Comparison between standard and ideal mass flow rate versus different Te (at Tc = 40˚C) and different Tc (at Te =
[image:6.595.90.538.299.477.2]10˚C).
Figure 5. Comparison between standard and ideal compressor power versus different Te (at Tc = 40˚C) and different Tc (at
Te = 10˚C).
Figure 6. Comparison between standard and ideal heat rejection rate versus Te (at Tc = 40˚C) and different Tc (at Te = 10
˚C).
-10 -5 0 5 10 15
0.0095 0.01 0.0105 0.011 0.0115 0.012 0.0125 0.013 0.0135 Te M as s f low r at e i n ( k g/ s ) per k il ow at t of r ef ri ger at ion Standard Cycle Ideal Cycle
30 32 34 36 38 40 42 44 46 48 50
0.004 0.006 0.008 0.01 0.012 0.014 0.016 0.018 0.02 0.022 0.024 Tc M as s f low r at e i n ( k g/ s ) per k il ow at t of r ef ri ger at ion Standard Cycle Ideal Cycle
-10 -5 0 5 10 15
0.65 0.7 0.75 0.8 0.85 0.9 0.95 1 1.05 1.1 1.15 Te C om pr es s or pow er i n ( k W ) per k il ow at t of r ef ri ger at
ion Standard Cycle
Ideal Cycle
30 32 34 36 38 40 42 44 46 48 50
0 0.2 0.4 0.6 0.8 1 1.2 1.4 1.6 1.8 Tc C om pr es s or pow er i n ( k W ) per k il ow at t of r ef ri ger at
ion Standard Cycle
Ideal Cycle
-10 -5 0 5 10 15
1.6 1.7 1.8 1.9 2 2.1 2.2 Te H eat r ej ec ti on r at e i n ( k W ) per k il ow at t of r ef ri ger at
ion Standard Cycle
Ideal Cycle
30 32 34 36 38 40 42 44 46 48 50
1.4 1.6 1.8 2 2.2 2.4 2.6 2.8 Tc H eat r ej ec ti on r at e i n ( k W ) per k il ow at t of r ef ri ger at
ion Standard Cycle
[image:6.595.89.539.513.695.2]Figure 7. Comparison between standard and ideal compressor discharge temperature versus Te (at Tc = 40˚C) and different Tc (at Te = 10˚C).
Figure 8. Comparison between standard and ideal coefficient of performance versus Te (at Tc = 40˚C) and different Tc (at
Te = 10˚C).
7. Conclusions
• The compressor power variation over the evaporating temperature range from −10˚C to 15˚C at Tc = 40˚C is decreased by 38.8% for the standard cycle and by 43.8% for the ideal cycle. The compressor power variation over the condensing temperature range from 30˚C to 50˚C at Te = 10˚C is increased by 122% for the stan-dard cycle and by 54.5% for the ideal cycle.
• The coefficient of performance of the ideal cycle with 5˚C superheating and sub-cooling is approximately 25% higher than that of the standard cycle at Te = 10˚C and Tc = 40˚C for the refrigerant R-404A.
• Based on the above conclusions, the simulation model can be used in testing refrigeration systems using the refrigerant under study with different conditions, which means that the cost of using laboratory equipment for experimental tests and effort can be reduced.
• The previous results and the tested properties show that the refrigerant R-404A is a suitable alternative re-frigerant to replace several chlorofluorocarbons and hydrochlorofluorocarbons due to their unfriendly influ-ences on the environment.
Acknowledgements
This work has been carried out during sabbatical leave granted to the author Abed Alrzaq Sleman Alshqirate from Al-Balqa’ Applied University (BAU) during the academic year 2014/2015.
-10 -5 0 5 10 15
46 48 50 52 54 56 58 60 Te D is c har ge t em per at ur e ( C ) Standard Cycle Ideal Cycle
30 32 34 36 38 40 42 44 46 48 50
40 45 50 55 60 65 70 75 80 Tc D is c har ge T em per at ur e ( C ) Standard Cycle Ideal Cycle
-10 -5 0 5 10 15
2.2 2.4 2.6 2.8 3 3.2 3.4 3.6 3.8 Te CO P Ideal Cycle Standard Cycle
30 32 34 36 38 40 42 44 46 48 50
[image:7.595.88.538.293.467.2]References
[1] Mottaa, S.F., Pariseb, J. and Braga, S.L. (2000) Critical Flow of Refrigerants through Adiabatic Capillary Tubes: Ex-perimental Study of Zeotropic Mixtures R-407a and R-404a. ASHRAE Transactions, 106, 929.
[2] Zhanga, M. and Webbb, R.L. (2000) Correlation of Two-Phase Friction for Refrigerants in Small-Diameter Tubes.
Experimental Thermal and Fluid Science, 25, 131-139.
[3] Mottaa, S., Pariseb, J. and Braga, S.L. (2002) A Visual Study of R-404A/Oil Flow through adiabatic Capillary Tubes.
International Journal of Refrigeration, 25, 586-596. http://dx.doi.org/10.1016/S0140-7007(01)00057-3
[4] Ould Didi, M.B., Kattan, N. and Thome, J.R. (2002) Prediction of Two-Phase Pressure Gradients of Refrigerants in Horizontal Tubes. International Journal of Refrigeration, 25, 935-947.
http://dx.doi.org/10.1016/S0140-7007(01)00099-8
[5] Llopis, R., Torrella, E., Cabello, R. and Sánchez, D. (2010) Performance Evaluation of R404A and R507A Refrigerant Mixtures in an Experimental Double-Stage Vapour Compression Plant. Applied Energy, 87, 1546-1553.
http://dx.doi.org/10.1016/j.apenergy.2009.10.020
[6] Zhou, Z., Chen, B., Wang, Y., Guo, L. and Wang, G. (2012) An Experimental Study on Pulsed Spray Cooling with Refrigerant R-404a in Laser Surgery. Applied Thermal Engineering, 39, 29-36.
http://dx.doi.org/10.1016/j.applthermaleng.2012.01.028
[7] Sapali, S.N. and Pradeep, A.P. (2010) Heat Transfer during Condensation of HFC-134a and R-404A inside of a Hori-zontal Smooth and Micro-Fin Tube. Experimental Thermal and Fluid Science, 34, 1133-1141.
http://dx.doi.org/10.1016/j.expthermflusci.2010.03.013
[8] Chena, J. and Kruseb, H. (1997) Concentration Shift Simulation for the Mixed Refrigerants R-404A, R-32/134a, and R-407C in an Air Conditioning System. HVAC&R Research, 3, 149-157.
[9] Jung, D.S. and Radermacher, R. (1991) Performance Simulation of Single-Evaporator Domestic Refrigerators Charged with Pure and Mixed Refrigerants. International Journal of Refrigeration, 14, 223-232.
http://dx.doi.org/10.1016/0140-7007(91)90007-4
[10] Alshqirate, A.S. (2003) Computer Simulation Study to Investigate the Performance of a Window Type Air Condition-ing Unit That Uses the Refrigerant R407c Instead of R22. M. Sc. Thesis, University of Jordan, Amman.
[11] Joudi, K.A., Mohammed, A.S. and Aljanabi, M. (2003) Experimental and Computer Performance Study of an Auto-motive Air Conditioning System with Alternative Refrigerants. Energy Conversion and Management, 44, 2959-2976.
http://dx.doi.org/10.1016/S0196-8904(03)00051-7
Nomenclature
A, B, C, D, E Coefficients of equations Latin symbols
COP The coefficient of performance Qrej The heat rejection in the condenser in (kW) hc,o Specific enthalpy at compressor outlet in (kJ/kg) Qrej Refrigeration capacity in (kW) he,i Specific Enthalpy entering the evaporator in (kJ/kg) m Mass flow rate in (kg/s)
he,o Specific enthalpy leaving the evaporator in (kJ/kg) wc The compressor power in (kW) hf Saturated liquid enthalpy in (kJ/kg) Subscripts
hg Saturated vapor enthalpy in (kJ/kg) C Condensing
hs Superheated enthalpy in (kJ/kg) E Evaporating
P Pressure in (kPa) F Liquid
Pf Saturated liquid pressure in (kPa) G Vapor
Pg Saturated vapor pressure in (kPa) I Inlet
Sf Saturated liquid entropy in (kJ/kg·K) O Outlet
Sg Saturated vapor entropy in (kJ/kg·K) Ref Refrigeration
Ss Superheated entropy in (kJ/kg·K) Rej Rejection
T Temperature in (˚C) S Superheat
Tc Condensing temperature in (˚C).
Te Evaporating temperature in (˚C)
Tg Saturated vapor temperature in (˚C)
Vg Saturated vapor specific volume in (m3/kg)