Munich Personal RePEc Archive
Reference-dependent preferences in the
public and private sectors: A nonlinear
perspective
Georgellis, Yannis and Gregoriou, Andros and Tsitsianis,
Nikolaos
Brunel University, University of East Anglia, University of
Hertfordshire
2009
Department of
Economics and Finance
Working Paper No. 09-25
http: / / www.brunel.ac.uk/ about/ acad/ sss/ depts/ economics
E
c
o
n
o
m
ic
s
a
n
d
F
in
a
n
c
e
W
o
rk
in
g
P
a
p
e
r
S
e
ri
e
s
Yannis Georgellis, Andros Gregoriou and Nikolaos
Tsitsianis
Reference- Dependent Preferences in the
Public and Private Sectors: A Nonlinear
Perspective
REFERENCE-DEPENDENT PREFERENCES IN THE PUBLIC AND
PRIVATE SECTORS: A NONLINEAR PERSPECTIVE
YANNIS GEORGELLIS*
Economics and Finance, Brunel University, Uxbridge UB8 3PH, United Kingdom; tel: + 44-1895-266635; e-mail: [email protected]
ANDROS GREGORIOU
Norwich Business School, University of East Anglia, Norwich NR4 7TJ, United Kingdom; tel: +44-1603-591321; e-mail: [email protected]
NIKOLAOS TSITSIANIS
Department of Accounting, Finance and Economics, University of Hertfordshire, Hatfield AL10 9AB, United Kingdom; tel: 01707-284000; e-mail: [email protected]
ABSTRACT
Although existing studies in the strategic management literature examine the importance of reference points in the context of managerial decisions vis-à-vis organizational performance, there is surprisingly little evidence on how reference earnings affect employees' wellbeing and behavior. The present study closes this gap by investigating adaptation dynamics towards reference earnings in the context of employees’ behavioral responses to social comparisons. We argue that a wedge between actual and aspiration-level earnings causes discontent that spurs employees into action to materialize their aspirations. The robustness of such action depends on the size of the wedge in a nonlinear fashion, a hypothesis supported by our findings. Nevertheless, heterogeneity in behavioral responses is evident across the public and private sectors and across gender and educational attainment. Such heterogeneity could be partially attributed to differences in public service motivation among public and private sector employees, to the different weights that employees place on pecuniary vs. non-pecuniary rewards, and whether reference earnings are likely to trigger behavioral responses through a 'jealousy' or through an 'ambition' channel. These findings have implications for the design of strategic human resource management policies to establish reward structures encouraging employees to adopt risk attitudes that are consistent with an overall business strategic plan.
Keywords: adaptation, reference earnings, comparison income, reference-dependent preferences, ESTAR models
Acknowledgements: We are grateful to Mustafa Ozbilgin and Vihn Sum Chau for helpful comments and suggestions on an earlier draft. We remain responsible for any remaining errors.
INTRODUCTION
Since their inception, Cyert and March's (1963) behavioral theory of the firm and Kahneman and
Tversky's (1979) prospect theory had a profound impact on decision analysis and management
science. Inspired by these theoretical contributions, numerous empirical studies have examined
reference points, risk attitudes, and the behavioral process of adaptation as potentially important
determinants of organizational performance. Mezias et al. (2002) finds, for example, that in the
context of an American financial services organization, attainment discrepancy and previous
aspiration levels had a positive effect on current aspirations whilst social comparisons – the
difference between a firm's performance and that of comparable firms - had a negative effect.
As Mezias et al. (2002) explain this negative effect is the result of organizations with
performance below that of their 'peers' setting higher targets or aspiration levels in an effort to
reduce such performance discrepancies. Evidence also suggests that a wedge between actual
and aspiration performance levels affects the degree of risk that characterizes organizational
strategy and behavior (Fiegenbaum and Thomas, 1988; Fiegenbaum, 1990; Greve, 1998).
Fiegenbaum and Thomas (1988) summarize risk-return studies and use prospecttheory to
predict a nonlinear relationship between risk and return for companies. Numerous other
empirical tests support this prediction, showing that decision makers in firms with returns below
a certain reference point are risk seeking, implying a negative risk-return association
(Fiegenbaum and Thomas, 1988; Fiegenbaum, 1990; Bromiley, 1991; and Grinyer and
McKiernan, 1990). In contrast, when performance exceeds aspiration levels, decision makers
are expected to adopt a more risk adverse attitude, consistent with a positive risk-return
relationship (see also Singh, 1986; March and Shapira, 1992). The study by Fiegenbaum and
partial adjustment model, assuming that a deviation between a firm's current strategic decision
and its reference point results in a strategic behavior adjustment in the next and each subsequent
period.
While the importance of aspirations and reference points has been explored extensively
in the context of managerial decisions and organizational performance, there is little evidence in
the strategic management literature on how reference points affect the behavior and risk attitudes
of employees within the organization. As strategic human resource management academics and
practitioners emphasize, employee behavior is an integral part of an overall business strategy, in
recognition of the fact that long-term organizational performance is inextricably linked to how
people in the organization, often the greatest asset, are managed, motivated, and deployed. In
this respect, understanding employees' behavioral responses to aspirations, reference points, and
social comparisons remains an important prerequisite for a successful business plan.
This paper focuses on one type of employees' behavioral response to social comparisons
– adaptation towards reference earnings. Examining whether individuals adapt to changing
circumstances has been a long-standing pursuit in psychological research. As advocates of
set-point theory maintain, individuals may react to changing circumstances, but personality traits
cause them to return to predetermined levels of wellbeing (Brickman, Coates, and
Janoff-Bulman, 1978; Heady and Wearing, 1989; Lykken and Tellegen, 1996). More recently,
empirical studies have exploited the potential of longitudinal data for testing adaptation and have
provided similar support of the baseline hypothesis (Lucas, Clark, Georgellis, and Diener, 2003;
Lucas, Clark, Georgellis, and Diener, 2004; Clark, Diener, Georgellis, and Lucas, 2008).
However, heterogeneity in individuals' reaction and patterns of adaptation are evident. As Lucas
patterns of adaptation differ across events and across individuals. Therefore, whether adaptation
is usually rapid and complete remains an open question that calls for additional empirical
evidence. What is more, recent survey-based evidence in the social sciences literature tends to
confirm the importance of comparison income as a determinant of employee welfare and
behavior (Clark and Oswald, 1996; Ferrer-i-Carbonnel, 2005; Stutzer, 2004). In a similar vein,
findings from behavioral and neurophysiological experiments on how social comparisons
influence reward processing in the human brain, offer additional support for the above
hypothesis. For example, Fliessbach et al. (2007), using MRI scans to monitor the brain activity
of volunteers performing tasks for a monetary reward, find that although the reward center in the
brain was activated by individual success, far more brain activity was recorded when volunteers
received higher rewards relative to those of their partners.
Consistent with the predictions of prospect theory, recent studies also find that reference
income not only influences individuals' attitude and disposition towards risk but it has important
behavioral implications. As Rizzo and Zeckhauser (2003) confirm, for example, a wedge
between physicians' actual earnings and the earnings of their professional peers encourages them
to adopt a risk-seeking or risk-averse attitude depending on whether actual earnings are below or
above reference earnings. Mas (2006) shows that, in the context of police wage negotiations,
when the actual pay award does not match the expectations formed during the arbitration
process, there is a negative impact on police performance. Using labor supply data for New
York taxi drivers, Farber (2008) finds that although a reference level of income on a given day
influences when a taxi driver ends his shift, reference income varies unpredictably day by day
and most drivers end their shift before they reach their reference income. This is suggestive of
income and the probability of stopping the daily shift than that implied by reference-dependent
preferences.
In this paper, we hypothesize that a wedge between employees' actual and
aspiration-level earnings causes discontent, which spurs employees into action to materialize their
aspiration-level of earnings. We further conjecture that the robustness of such action, and
therefore the speed of adjustment towards reference earnings, depends on the size of the wedge
in a nonlinear fashion in that employees whose current welfare or economic situation is far
below (above) that of their peers (i.e. the reference group) have a stronger (weaker) incentive to
improve their status. The implication of the presence of nonlinearities characterizing the
adaptation process is that earnings do matter, but much more so when the deviation of actual
from reference earnings is large. In contrast, evidence of reference-dependent preferences in a
small enough neighborhood around reference earnings is weak, if non-existent. This is
consistent with the adaptation-level theorists' suggestion that only stimuli that are significantly
different from a predetermined frame of reference can produce a positive or negative response
(Helson, 1964). We further hypothesize that heterogeneity in responses to reference earnings is
also evident. A source of such heterogeneity in responses could be traced back to individuals'
dispositions, which influence their perceptions of their current jobs and consequently their
adaptation or attitudinal equilibrium level (Bowling, Beehr, Wagner, and Libkuman, 2005).
DATA AND METHODS
Our empirical investigation is based on data from the British Household Panel Survey (BHPS), a
large-scale longitudinal survey that allows us to capture and model the dynamics of evolution of
individuals in approximately 5,000 households, interviewed annually, covering the period
1991-2005. It contains detailed information on standard demographic and labor market
characteristics, including education, earnings and whether working in the public or the private
sectors. Focusing on individuals 19-65 years of age results in a sample of 27048 and 27003
person-year observations for men and women respectively. Of those observations, 21577 refer
to men in the private sector and 5471 in the public sector. The corresponding split for women is
17705 to 9298.
To quantify and model the dynamic trajectory of the gap between actual and reference
earnings, we assume that etrepresents the gap between the actual earnings
( )
WSE of an employeewith educational attainment E employed in sector S and her reference earnings
( )
E * SW
et =
[
( )
]
*E S E
S W
W − . (1)
Contrary to the relatively straightforward identification of the dynamic evolution of
actual earnings, the time trajectory of reference earnings is more difficult to ascertain, mostly
because of the multitude of alternative definitions of the reference group. Among others,
Ferrer-i-Carbonell (2005) uses an operational definition of the reference group that includes all people
with similar education, in the same age bracket and living in the same region. McBride (2001)
uses the average values of all those in the same age group within five years younger or older
than the individual concerned. If reference earnings are defined as earnings of 'people like you'
with similar age, education, occupation and other demographic and labor market characteristics,
then the time trajectory of reference earnings will be influenced greatly by trends and patterns in
to those of the highest paid member in the organization, then trends in the compensation of the
highest earners (e.g. executive pay) will be the main driving force behind the evolution of
reference earnings. Brown, Gardner, Oswald, and Qian (2008) find evidence of the rank within
an organization being an important determinant of employees' wellbeing.
Our proxy for reference earnings is based on Clark and Oswald's (1996) definition, using
the fitted values from estimated multivariate earnings regressions. We estimate earnings
regressions and derive fitted values separately for men and women. We further disaggregate by
whether working in the public or the private sector and by educational attainment. More
specifically, we estimate nine regressions for men, based on separate samples for: (1) All men;
(2) All men in the public sector; (3) Men in the public sector with university education; (4)
Men in the public sector with teaching, nursing or other higher qualification; (5) Men in the
public sector with other education; (6) All men in the private sector; (7) Men in the private
sector with university education; (8) Men in the private sector with teaching, nursing or other
higher qualification; (9) Men in the private sector with other education. Based on the same
groupings, we estimate nine equivalent regressions for women. In all earnings regressions, we
control for the standard demographic and labor market characteristics, including age, marital
status, number of children, health, whether working full-time, firm size, region and time
dummies.1
Then, we explore separately for each of the above sub-samples the dynamics of
adjustment towards reference earnings adopting the Smooth Transition Autoregressive (STAR)
model (Granger and Terasvirta, 1993; Terasvirta, 1994). The main attraction of such a model is
that it allows for the speed of adjustment to vary in a nonlinear fashion with the distance
earning below a reference level of earnings increase with the distance from reference earnings.
In comparison, the partial adjustment model implies that such costs remain constant.
Naturally, whether the STAR model is superior to linear models in capturing the
dynamics of adjustment towards reference earnings is a testable hypothesis, which entails a
three-stage testing procedure for the presence of nonlinearities. The first stage specifies the
appropriate lag length for the linear autoregressive model and the second stage involves tests for
the presence of nonlinearities. If nonlinearities are present, the choice between the Logistic
STAR (LSTAR) and the Exponential STAR (ESTAR) model as potential candidates for best
describing the dynamic adjustment process is made in the third stage.
Formally, consider two possible regimes comprising a pure ‘small’ and a pure ‘large’
adjustment of individuals’ current earnings with respect to changes in their reference earnings.
Following Granger and Terasvirta (1993), we write a STAR model of order k,for et as:
(
) (
)
0 1' 0 1'
t t t t d t
e =θ +θ x + δ +δ x F e− +w, (2)
where xt =
(
et−1,et−2,...et k−)
, θ1=(
θ θ1, 2,...θk)
', δ1 =(
δ δ1, 2,...δk)
', wt ~iid(
0,σ2)
, F( )
.is a continuous transition function, et d− is the switching variable, and dis the delay parameter.
( )
.F is a monotonically increasing function with F
( )
− =0 and F (+) = 1 which yields anonlinear asymmetric adjustment.
Terasvirta and Anderson (1992) define the ESTAR function as:
(
)
(
)
21 exp
t d t d
F e− = − −a e− −c , (3)
1
where ameasures the speed of transition from one regime to another and cis a threshold value
for ewhich indicates the halfway point between the two regimes. The ESTAR function in (3)
defines a transition function about cwhere F
( )
. is still bounded between 0 and 1. As in thecase of the LSTAR model above, the main property of the ESTAR model, described in equation
(3), that makes it an attractive model in the present context is the fact that it captures the
nonlinear, smooth adjustment process towards reference values.
The initial testing for the presence of nonlinearities in et involves three stages. First, a
linear autoregressive model for et is specified in order to determine the lag length k. The lag
length selection is based on the Schwarz information criteria and the Ljung-Box statistic for
serial correlation. The residuals are saved from the chosen autoregressive model and denoted as
v. Second, having determined k, the next stage is to test for the presence of nonlinearities. This
is done through the estimation of
2 3
0 1' 2' 3' 4'
t t t t d t t d t t d t
v =β +β x +β x e− +β x e − +β x e − +w
, (4)
where the linearity test is on the null hypothesis H0:β2'=β3'=β4'=0. Equation (4) is
estimated across a range of values for d where the smallest p-value attached to the linearity test
determines d in the estimation of (2). The final stage of the nonlinearity test is to determine
which smooth transition model, LSTAR or ESTAR, is appropriate for the data. This is done by
04 : 4' 0
H β =
(5)
03: 3' 0 / 4' 0
H β = β =
(6)
02 : 2' 0 / 4' 3' 0
H β = β =β =
. (7)
The ESTAR model does not contain a cubic term (see equation 3.16 in Terasvirta). Therefore, if
we reject (5) there is a cubic term in the nonlinear model suggesting that we have an LSTAR
specification. If we accept (5) and reject (6), then the nonlinear model possess a squared term
but not a cubic term. Since a squared term is required for an ESTAR specification and we have
no cubic term, then we can conclude that accepting (5) and rejecting (6) implies acceptance of
the ESTAR model (see equation 3.16 in Terasvirta). Accepting (5) and (6) and rejecting (7)
leads to an LSTAR model because although H02:β2'≠0 is important for an LSTAR
specification, it is insignificant for an ESTAR model (see page 209, equation 3.10 in Terasvirta).
However, Granger and Terasvirta 1993) and Terasvirta 1994) show that application of this
sequence of tests may lead to incorrect conclusions because the higher order terms of the Taylor
expansion used in deriving these tests are disregarded. Thus, they recommend that the choice of
STAR model should be made based on the lowest p-value among the values computed for all the
F tests of (5)-(7).
To account for potential asymmetries in the adjustment process, we implement the STAR
methodology separately for when actual values are below reference values and for when actual
does not reject the null hypothesis of absence of nonlinear adjustment. In this case, a further test
of the null hypothesis Ho: β1 = 0 for the presence of linear adjustment shows no adjustment at all.
Therefore, all subsequent results reported in the empirical section focus on nonlinear adaptation
of earnings, job satisfaction and work hours when actual values are below reference values.2
RESULTS
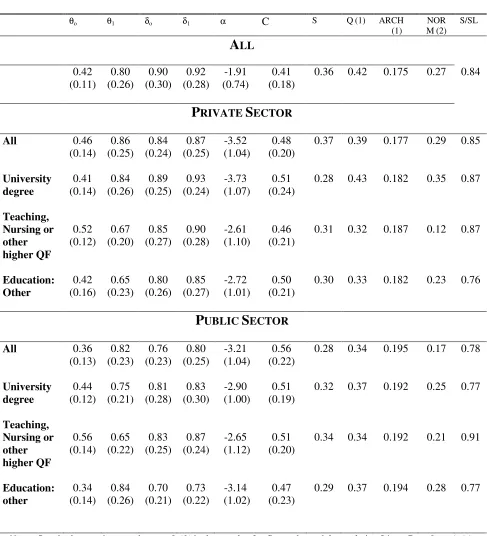
Table 1 presents the results of nonlinear estimation of equation (2) for men, estimated separately
for men in the public and private sector and by educational qualifications.3 The main parameter
of interest is α, which captures the speed of adjustment of actual towards reference earnings.
Small (large) values of α are indicative of a slow (fast) speed of adjustment. In all cases a is
correctly signed and significantly different from zero at the 5 per cent level, implying the
presence of significant nonlinearities in the speed of adjustment towards reference earnings. We
argue that such nonlinearities reflect the presence of nonlinearities in employees'
reference-dependent preferences and their incentives to take stronger remedial action to improve their
earnings when the distance between current and reference earnings is larger.
[TABLE 1 here]
2
The results of linear and nonlinear tests for the case of actual values above the reference values are available upon request.
3
The model was estimated using the Gauss Newton method. The Ljung-Box Q statistic for serial correlation
among the residuals suggests white noise residuals for all autoregressive models. Using 0.05 as a threshold p-value,
the test rejects linearity, classifying the series as nonlinear. The standard errors of the nonlinear models are smaller then the standard errors of the linear models for all the series suggesting, that the nonlinear models provide a better fit of the data. The Jacque Bera normality test indicates that the residuals are normally distributed for all the series examined, confirming that nonlinearities in individuals’ reported well-being are not the outcome of any outliers in
the data. We further test the residuals for first order serial correlation and ARCH effects. The p-values using 0.05
A comparison of the estimated coefficients a, based on separate samples for all men in
the private sector and for all men in public sector, points to a faster adjustment speed towards
reference earnings in the private sector than that in the public sector. A faster speed of
adjustment in the private sector is consistent with steeper earnings profiles in the private sector
as well as higher aspiration-level of earnings. This argument is further supported by evidence
showing that differences in adjustment speeds between the two sectors are more pronounced for
employees with a university degree or a higher educational qualification. As reflected by the
corresponding estimated coefficients a of -3.73 and -2.90 in the private and public sector
respectively, university graduates are closing the gap between actual and reference earnings
much faster in the private sector than in the public sector. The opposite is true, however, for
men with lower educational qualifications who tend to close the gap between their actual and
reference earnings at a much lower rate in the private rather than the public sector with
corresponding estimated acoefficients of -2.72 and -3.14. Largely, such differences in
adjustment speeds could be attributed to the differential returns to education across the two
sectors. Well-documented evidence of wage compression in the public sector, often portrayed
as a reason for the difficulty of the sector to attract highly skilled employees, implies lower
returns to education with flatter age-earnings profiles than those in the private sector.4 However,
the speed of adjustment depends not only on the level but also on the evolution of reference
values over time as well as how such reference values are perceived by employees. It is
possible, for example, that reference earnings operate via a 'jealousy' channel whereby peers'
higher earnings have a negative impact on individuals' well-being, thus mitigating the positive
4
effect of own earnings. Alternatively, it is likely that reference earnings induce a positive
well-being effect, which operates via an 'ambition' channel. In this case, peers' higher earnings raise
expectations of higher own earnings in the future, a conjecture consistent with Hirschman’s
(1973) ‘tunnel effect’ phenomenon referring to the possibility that in uncertain and adverse
situations individuals often interpret any positive signals that they observe around them to
predict an improvement in their own situation to occur sooner or later (Senik, 2008). In a
similar fashion, it is likely that university graduates aspire to higher reference earnings in the
private sector because of the presence of skewed distributions of graduate earnings with long
upper tails. In contrast, as earnings for less qualified employees are generally lower whilst
earnings distributions are generally less dispersed, reference or aspiration earnings for those
employees will tend to be lower. Higher reference earnings will, ceteris paribus, imply a larger
wedge between actual and reference earnings implying a stronger incentive to take action to
eliminate such a wedge. Differences between public and private sector employees' perceptions
about the earnings of their peers could determine the strength of the influence of reference
earnings on employees' well-being, which consequently influences their incentives to undertake
robust action to match the potentially higher earnings of their employees. Such perceptions are
generally shaped by employees' evaluation of intrinsic vis-à-vis extrinsic job rewards.
Assuming that public sector employees value, and they are motivated by, intrinsic rather than
extrinsic rewards, higher earnings of co-employees in the public sector will cause little disutility,
thus providing only a weak incentive to take action to achieve higher earnings. As arguments
advanced in the public administration literature suggest, employees in the public sector are
indeed more likely to exhibit characteristics and work attitudes that are consistent with Public
to motives grounded primarily or uniquely in public institutions" (Perry, 1996). An implication
of PSM in the context of the present study is that, in comparison to employees in the private
sector, public sector employees are less likely to be motivated by pecuniary rewards, so that
higher co-worker earnings (reference earnings) induce little disutility and a weak incentive for
taking action to close the gap between actual and reference earnings. Therefore, stronger
evidence of Public Service Motivation (PSM) among public sector than among private sector
employees could offer an additional explanation of potential differences in the speed of
adjustment towards reference earnings between the two sectors.
[TABLE 2 here]
As shown in Table 2, similar patterns of adaptation are evident for women. Although
adjustment speeds tend to be generally lower for women compared to those of men, adjustment
speeds for female university graduates are higher in the private sector than in the public sector.
As in the case of men, women with lower educational qualification tend to reach their reference
earnings faster in the public sector instead. It is worth noting, however, that such differences in
adjustment speeds across sectors and educational attainment are less pronounced in the case of
women. This is consistent with previous findings on the existence of significant gender
differences in age-earnings profiles as well as gender differences in the returns to education,
implying generally flatter age-earnings profiles of women in comparison to earnings profiles of
men. Interestingly, women with teaching, nursing or other higher qualifications are closing the
gap between actual and reference earnings faster in the private than in the public sector. This
of wages. Given anecdotal evidence or common wisdom that teaching and nursing are
occupations characterized by high public service motivation, higher earnings of co-employees in
these professions are likely to exert little influence on employees' perceptions of their relative
position and on the incentive to take robust action to reach their aspiration earnings.
CONCLUDING COMMENTS
Against the backdrop of a resurgent interest in the process of adaptation as a behavioral response
to social comparisons in the decision analysis and social science literature, examining whether
aspiration-level earnings affect employees' wellbeing has attracted surprisingly little attention in
the strategic management literature. Most of the existing studies examine the importance of
reference points and adaptation in the context of managerial decisions and organizational
performance. The present study closes this gap in the literature by investigating patterns of
adaptation of employees' actual earnings towards reference earnings, using large-scale
longitudinal data. Employing nonlinear methods, our findings uncover a consistent pattern
whereby the speed of adjustment towards reference earnings increases with the distance of
actual from reference earnings. From a Strategic Human Resource Management perspective, the
main implication of such a nonlinear pattern is that a greater wedge between actual and target
earnings spurs a stronger response and possibly more risk taking on the part of employees.
Noticeably, this is not the case when actual earnings are above target. To the extent that
encouraging a more risk taking attitude among employees is a desirable outcome, integral to a
business strategic plan, then personnel policies should aim at creating a rewards structure that
desirable outcome in the context of an overall business plan, then reward structures resulting in
more equitable, less dispersed earnings distributions should be adopted instead. Nevertheless,
heterogeneity in behavioral responses to reference earnings cannot be ignored. As our results
confirm, stark differences in the speed of adaptation towards reference earnings exist across the
public and private sectors and across gender and educational attainment. Such differences
could be partially attributed to differences in public service motivation among public and private
sector employees and, more generally, to the different weights that employees with different
characteristics place on pecuniary vs. non-pecuniary rewards. The possibility that reference
earnings could triger behavioral responses either through a 'jealousy' or through an 'ambition'
channel adds an additional dimension to the way employee reward structures could operate
within an organization. In this context, it becomes essential for human resource management
policies to incorporate and emphasize the need for an effective system for managing earnings
aspirations to meet organizational objectives.
This study makes also a methodological contribution to the existing literature by
introducing a novel approach for modeling adaptation dynamics. The ESTAR model captures
the inherent dynamics of the path of adjustment towards reference earnings better, in a statistical
sense, than alternative models. Certainly, the ESTAR model outperforms linear models in
accurately capturing the dynamics of adaptation of actual to reference earnings. What's more, it
offers an extension and a potentially viable alternative to the partial adjustment model, which
was used by Fiegenbaum and Thomas (1995) to model dynamic adjustment of strategic
reference groups. The main advantage of the ESTAR model over the partial adjustment model
is that it allows for the costs of disequilibrium to increase with the distance from the target or
exploiting the benefits of longitudinal data for testing the predictions of adaptation-level
theories. The use of the BHPS data, a large-scale longitudinal survey of more than 10,000
individuals who were followed for a considerable number of years is a 'quantum leap' from the
early evidence on adaptation-level theories, based on small cross-sectional samples.
The analysis presented here can be extended in several ways for future research. First, as
our analysis is based on a single measure of reference earnings, derived from predicted earnings
of 'people like you', there is ample scope for exploring alternative operational definitions of
reference points. Guided by a large literature on reference groups and a growing number of
empirical studies testing the importance of reference points, future work could compare dynamic
paths of adjustment towards different or competing reference points. In such a context, the issue
of heterogeneity in responses to reference values could be revisited by disaggregating the sample
into more refined categories. Second, in future work we aim to disentangle the influence of
behavioral responses from other factors that may affect the dynamic trajectory towards reference
earnings. Such factors include employees' observed productive characteristics, the differential
returns to education in the public and private sectors, the prevalence of wage compression in the
public sector, and the possible existence of public service motivation, which dampens the
negative well-being effect of peers' higher earnings. A closer investigation of such factors could
also inform our understanding of how reference points evolve over time, which could allow for
explicitly modeling shifts of individual reference points overtime. This approach was adopted
by Lehner (2000) who relaxed the assumption of a common reference level and allowed for the
REFERENCES
Bender K, Elliott R. 2002. The role of job attributes in understanding the public-private wage
differential. Industrial Relations, 41 (3): 407-421.
Bowling N, Beehr T, Wagner S, Libkuman T. 2005. Adaptation-level theory, opponent process
theory, and dispositions: An integrated approach to the stability of job satisfaction.
Journal of Applied Psychology, 90: 1044-1053.
Brickman P, Coates D, Janoff-Bulman, R. 1978. Lottery winners and accident victims: Is
happiness relative? Journal of Personality and Social Psychology, 36: 917-927.
Bromiley P. 1991. Testing a causal model of corporate risk taking and performance'. Academy
of Management Journal, 34: 37-59.
Brown G, Gardner J, Oswald A, Qian, J. 2008. Does wage rank affect employees' wellbeing?
Industrial Relations, 47: 355-389.
Clark A, Diener E, Georgellis Y, Lucas R. 2008. Lags and leads in life satisfaction: A test of the
baseline hypothesis. Economic Journal, 118: F222-F243.
Clark A, Oswald A. 1996. Satisfaction and comparison income. Journal of Public Economics,
61: 359-381.
Cyert R.M, March J.G. 1963. A behavioral theory of the firm. Prentice-hall, Englewood Cliffs,
NJ.
Easterlin R. 2005. A puzzle for adaptive theory. Journal of Economic Behavior and
Organization, 56: 513-521.
Farber H. 2008. Reference-dependent preferences and labor supply: The case of New York City
Ferrer-I-Carbonell A. 2005. Income and well-being: an empirical analysis of the comparison
income effect. Journal of Public Economics, 89, 5-6: 997-1019.
Fiegenbaum A. 1990. Prospect theory and the risk-return association. Journal of Economic
Behavior and Organization, 14: 187-203.
Fiegenbaum A, Thomas T. 1988. Attitudes towards risk and the risk-return paradox: prospect
theory explanations. Academy of Management Journal, 31: 85-106.
Fiegenbaum A, Thomas H. 1995. Strategic groups as reference groups: theory, modeling and
empirical examination of industry and competitive strategy. Strategic Management
Journal, 16: 461-476.
Fiegenbaum A, Hart S, Schendel D. 1996. Strategic reference point theory. Strategic
Management Journal, 17: 219-235.
Fliessbach K, Weber B, Trautner P, Dohmen T, Sunde U, Elger C.E, Falk A. 2007. Social
comparison affects reward-related brain activity in the human ventral striatum. Science,
318, 5854: 1305-1308.
Granger C, Terasvirta T. 1993. Modelling nonlinear economic relationships, Oxford University
Press.
Greve H.R. 1998. Performance, aspirations, and risky organizational change. Administrative
Science Quarterly, 43: 58-86.
Grinyer P.H, McKiernan P. 1990. Generating major change in stagnating companies. Strategic
Management Journal, 11: 131-146.
Headey B, Wearing A. 1989. Personality, life events, and subjective well-being: toward a
Helson H. 1964. Current trends and issues in adaptation-level theory. American Psychologist,
19: 26-38.
Hirschman A. 1973. The changing tolerance for income inequality in the course of economic
development. Quarterly Journal of Economics, 87: 544–566.
Hundley G. 1991. Public and private sector occupational pay structures. Industrial Relations, 30:
417-434.
Kahneman D, Tversky A. 1979. Prospect theory: An analysis of decisions under risk.
Econometrica, 47: 263-291.
Kahn L. 2008. The impact of wage-setting institutions on the incidence of public employment in
the OECD: 1960-1998. Industrial Relations, 47: 329-354.
Katz L, Krueger A. 1991. Changes in the structure of wages in the public and private sectors.
Research in Labor Economics, 12: 137-172.
Lehner J. 2000. Shifts of reference points for framing of strategic decisions and changing
risk-return associations. Management Science, 46 1): 63-76.
Lucas R. 2007. Adaptation and the set-point model of subjective well-being: Does happiness
change after major life events? Current Directions in Psychological Science, 16: 75-79.
Lucas R, Clark A, Georgellis Y, Diener E. 2003. Reexamining adaptation and the set point
model of happiness: Reactions to changes in marital status. Journal of Personality and
Social Psychology, 84: 527-539.
Lucas R, Clark A, Georgellis Y, Diener E. 2004. Unemployment alters the set point of life
satisfaction. Psychological Science, 15: 8-13.
Lykken D, Tellegen A. 1996. Happiness is a stochastic phenomenon. Psychological Science, 7:
Mas A. 2006. Pay, reference points, and police performance. Quarterly Journal of Economics.
121: 783-821.
McBride M. 2001. Relative-income effects on subjective well-being in the cross-section.
Journal of Economic Behavior and Organization, 45: 251-278.
Mezias S, Chen Y-R, Murphy P. 2002. Aspiration-level adaptation in an American financial
services organization: A field study. Management Science, 48 10): 1285-1298.
Perry J.L. 1996. Measuring public service motivation: An assessment of construct reliability and
validity. Journal of Public Administration Research and Theory, 6: 5-22.
Rizzo J, Zeckhauser R. 2003. Reference incomes, loss aversion, and physician behavior. Review
of Economics and Statistics, 85: 909-922.
Senik C. 2008. Ambition and jealousy: Income interactions in the 'old' Europe versus the 'new'
Europe and the United States. Economica, 75: 495-513.
Singh J. V. 1986. Performance, slack, and risk taking in organizational decision making.
Academy of Management Journal, 29: 562-585.
Stutzer A. 2004. The role of income aspirations in individual happiness. Journal of Economic
Behavior and Organization, 54: 89-109.
Terasvirta T, Anderson H. 1992. Characterizing nonlinearities in business cycles using smooth
transition autoregressive models. Journal of Applied Econometrics, 7: S119-S139.
Terasvirta T. 1994. Specification, estimation, and evaluation of smooth transition autoregressive
models. Journal of the American Statistical Association, 89: 208-218.
van Praag B, Ferrer-I-Carbonell A. 2004. Happiness quantified: A satisfaction calculus
Table 1 – Estimates of the Estar Models (Men)
θo θ1 δo δ1 α C S Q(1) ARCH
(1) NOR M(2) S/SL
A
LL 0.42 (0.11) 0.80 (0.26) 0.90 (0.30) 0.92 (0.28) -1.91 (0.74) 0.41 (0.18)0.36 0.42 0.175 0.27 0.84
P
RIVATES
ECTORAll 0.46
(0.14) 0.86 (0.25) 0.84 (0.24) 0.87 (0.25) -3.52 (1.04) 0.48 (0.20)
0.37 0.39 0.177 0.29 0.85
University degree 0.41 (0.14) 0.84 (0.26) 0.89 (0.25) 0.93 (0.24) -3.73 (1.07) 0.51 (0.24)
0.28 0.43 0.182 0.35 0.87
Teaching, Nursing or other higher QF 0.52 (0.12) 0.67 (0.20) 0.85 (0.27) 0.90 (0.28) -2.61 (1.10) 0.46 (0.21)
0.31 0.32 0.187 0.12 0.87
Education: Other 0.42 (0.16) 0.65 (0.23) 0.80 (0.26) 0.85 (0.27) -2.72 (1.01) 0.50 (0.21)
0.30 0.33 0.182 0.23 0.76
P
UBLICS
ECTORAll 0.36
(0.13) 0.82 (0.23) 0.76 (0.23) 0.80 (0.25) -3.21 (1.04) 0.56 (0.22)
0.28 0.34 0.195 0.17 0.78
University degree 0.44 (0.12) 0.75 (0.21) 0.81 (0.28) 0.83 (0.30) -2.90 (1.00) 0.51 (0.19)
0.32 0.37 0.192 0.25 0.77
Teaching, Nursing or other higher QF 0.56 (0.14) 0.65 (0.22) 0.83 (0.25) 0.87 (0.24) -2.65 (1.12) 0.51 (0.20)
0.34 0.34 0.192 0.21 0.91
Education: other 0.34 (0.14) 0.84 (0.26) 0.70 (0.21) 0.73 (0.22) -3.14 (1.02) 0.47 (0.23)
0.29 0.37 0.194 0.28 0.77
Notes: Standard errors in parentheses. Q (1) is the p-value for first order serial correlation Ljung-Box Q statistic). ARCH (1) is the p-value for the first order autoregressive conditional heteroscedasticity (Engle F-test). NORM (2)
is the p-value for the Jacque-Bera normality test. S/SL is the ratio of the standard errors for the nonlinear and linear
Table 2 – Estimates of the Estar Models (Women)
θo θ1 δo δ1 α C S Q(1) ARCH
(1) NOR M(2) S/SL
A
LL 0.50 (0.15) 0.77 (0.23) 0.84 (0.27) 0.87 (0.25) -1.44 (0.31) 0.52 (0.20)0.31 0.39 0.195 0.28 0.75
P
RIVATES
ECTORAll 0.38
(0.13) 0.73 (0.25) 0.82 (0.24) 0.84 (0.25) -1.30 (0.61) 0.44 (0.18)
0.29 0.31 0.18 0.16 0.92
University degree 0.40 (0.12) 0.87 (0.24) 0.87 (0.26) 0.91 (0.28) -2.02 (1.00) 0.50 (0.23)
0.27 0.40 0.179 0.31 0.86
Teaching, Nursing or other higher QF 0.43 (0.14) 0.81 (0.25) 0.72 (0.28) 0.75 (0.27) -1.72 (0.80) 0.45 (0.22)
0.31 0.35 0.183 0.26 0.75
Education:
other 0.45
(0.10) 0.71 (0.24) 0.87 (0.23) 0.93 (0.24) -1.10 (0.34) 0.52
(0.22) 0.36 0.29 0.183 0.13 0.84
P
UBLICS
ECTORAll 0.39
(0.14) 0.80 (0.24) 0.75 (0.31) 0.77 (0.30) -1.6 (0.74) 0.54 (0.20)
0.37 0.42 0.178 0.31 0.93
University degree 0.40 (0.11) 0.79 (0.27) 0.86 (0.25) 0.91 (0.26) -1.80 (0.87) 0.51 (0.21)
0.33 0.37 0.197 0.19 0.72
Teaching, Nursing or other higher QF 0.46 (0.12) 0.76 (0.22) 0.77 (0.30) 0.81 (0.29) -1.52 (0.70) 0.48 (0.21)
0.35 0.41 0.176 0.30 0.89
Education: other 0.37 (0.13) 0.67 (0.23) 0.88 (0.26) 0.91 (0.30) -1.84 (0.80) 0.45 (0.20)
0.34 0.41 0.198 0.24 0.81
Notes: Standard errors in parentheses. Q (1) is the p-value for first order serial correlation Ljung-Box (Q statistic). ARCH (1) is the p-value for the first order autoregressive conditional heteroscedasticity (Engle F-test). NORM (2)
is the p-value for the Jacque-Bera normality test. S/SL is the ratio of the standard errors for the nonlinear and linear