Munich Personal RePEc Archive
Assessing difference: examining Florida’s
initial teacher preparation programs and
exploring alternative specifications of
value-added models
Mason, Patrick L.
Florida State University
2010
Online at
https://mpra.ub.uni-muenchen.de/27903/
Assessing difference: Examining Florida’s initial teacher preparation programs and exploring alternative specifications of value-added models
Patrick L. Mason
Professor of Economics & Director,
African American Studies Program (Florida State University) & Tallahassee, FL
June 10, 2010
Abstract: This study explores important statistical issues on the appropriate functional form and model specification of the value-added educational achievement equation. We also wish to estimate the causal effect of a teacher’s institution of academic preparation and pedagogical training. Standardized test scores, viz., the Florida Comprehensive Assessment Tests (FCAT), provide a measure of pupil academic achievement. Accordingly, this study uses a value-added
regression model to establish whether there is a “college preparation effect” on the average pupil’s FCAT reading and mathematics scores. We find that value-added regression analysis fails to uncover robust and substantive college preparation effects. Regardless of race (African American, Hispanic, or white), male or female status, or FCAT mathematics versus FCAT reading, pupil academic achievement does not vary substantively according to a teacher’s college of preparation. Further, the statistical significance of teacher program effects also depends on the functional form and specification of the value-added model.
JEL codes: I2, J15, J44, J45, J48
Key words: teacher quality, value-added model, historically black colleges and universities, HBCU, teacher productivity, education and value-added
I thank the staff of the Florida PK-20 Education Data Warehouse for their assistance in obtaining and interpreting the data used in this study. All errors, omissions, opinions, and conclusions
expressed herein are solely the author’s and do not necessarily reflect the opinions of the Florida
Department of Education and its subsidiary administrative units.
1
Teacher preparation institutions are now being challenged to defend the effectiveness of
their graduates in the classroom. Many also suggest that the pay and promotion of teachers
should be strongly tied to their in-class productivity, as measured by their pupils’ performance on standardized examinations. Such discussions presume 1) there is a strong consensus on how
to assess a teacher’s value-added with respect to students’ academic achievement, 2) there are substantively large teacher program effects across alternative institutions. This study explores
important statistical issues on the appropriate functional form and model specification of the
value-added educational achievement equation. We also wish to estimate the causal effect of a
teacher’s institution of academic preparation and pedagogical training. We find that the statistical significance and substantive importance of alternative teacher preparation programs vary
according to the specification of the value-added regression.
Section I of this paper presents pertinent information of the institution context of
Florida’s supply of new teachers and the utilization of the state’s standardized test for public
schools. Section II provides a discussion of the various econometric issues involved in estimating
the academic achievement equation. Sections III and IV presents the study’s data and results,
respectively. We conclude in section V with a discussion of the study’s results and limitations.
I. Pupil academic achievement and Florida’s supply of new teachers: institutional context Florida Comprehensive Assessment Test
The Florida Comprehensive Assessment Test (FCAT) is a criterion-based examination
established by the State of Florida, used to assess learning effectiveness in reading and
2
teacher pay and promotion, and student graduation criteria are based on the FCAT
developmental scale scores.
Based on the developmental scale scores, student achievement on the FCAT is assigned
an ordinal rank of 1 – 5. Level 1 and 2 are the lowest levels of achievement, signifying minimal or limited grade-level content. Achievement level 3 (the lowest level consistent with proficient
achievement) signifies that performance is on grade-level, students are at least partly successful
with grade-level content. Levels 4 and 5 indicate that students are mostly successful or
completely successful with the most challenging grade-level content.
A pupil is deemed to have made an annual learning gain when one of the following
conditions hold: i) there is improvement on the achievement level over the previous year; or, ii)
the student has maintained a proficient achievement level on FCAT relative to the previous year;
or, iii) pupil remained within FCAT achievement levels 1 or 2 but demonstrated more than 1
year’s growth on the FCAT development scale score (Florida Department of Education, 2010b).
The later method is not applicable for pupils retained at the same grade level, persons whose who
declined a grade level, or pupils who are 2 or more grade levels higher than the previous year;
for these pupils, learning gains are accessed according to method i) or ii). If a pupil’s FCAT achievement level declines from one year to the next, the pupil is not deemed to have made an
annual learning gain.
Teacher preparation
The State University System of Florida, private universities and colleges, and other
public and private institutions supply new teachers to Florida’s public school’s through 1 of 4 paths: 1) initial teacher preparation program (ITP); 2) alternative certification in an educator
3
professional training option (PTO) for non-education majors. ITP completers are graduates of
the State University System of Florida (11 public universities), the Florida College System
(community colleges), and independent colleges and universities. All State University System
institutions are ITP participants. Chipola College, Miami-Dade College, and St. Petersburg
College are the only Florida College System institutions with an ITP, but 27 Florida College
System institutions have an EPI. Eighteen of Florida’s independent colleges and universities have an ITP.
ITP programs provide the traditional route for entering the teaching profession.
Individuals must demonstrate general and subject knowledge, along with mastery of professional
preparation and education competence. ITP program completers are qualified for a Professional
Certification upon program completion. Often, ITP program completers will have completed one
or more years of teaching at the point of program completion.
Colleges and universities offering ITP programs “are also authorized to offer an approved Professional Training Option (many times delivered as a minor in education) to degree seekers
outside of the college of education or as a post-baccalaureate program of study (Milton, et al.,
2008:2).” PTO teachers enter the profession by completing all the education courses required for
professional preparation, along with obtaining a subject area bachelor’s degree outside of the college of education. The PTO is design for undergraduate students in a discipline where there is
a Florida Department of Education certification, but where the college or university does not
offer the disciplinary specialty within the college of education. For example, FAMU’s College of
Education has decided to offer the PTO only for disciplines such as journalism, agriculture, etc.
EPIs are also managed by Colleges of Education. Certification via EPI differs from PTO
4
field; but wish to enter into education. EPI individuals enter the teaching profession by
demonstrating mastery of professional preparation and education competence.
Colleges of Education are not involved in DAC programs. Each local school district
manages its own DAC, though each program is approved by the Florida Department of
Education. The district programs generally serve bachelor’s degree holders hired to teach with a Temporary Certificate. According to Milton, et al. (2008:3), “These programs [DAC and EPI] were conceived to help primarily with critical shortage areas in secondary education where a
content major in the areas of arts and sciences could be paired with intense pedagogical training
to move teachers without delay into the classroom with the tools they need to become effective.” During 2003-2004, 71 percent, 19 percent, and 10 percent of individuals completing a
Florida teacher preparation program were graduates of public universities of Florida,
independent colleges and universities of Florida, DAC programs, respectively (Florida
Department of Education, 2009b). For 2006-2007, the supply shares were public universities (54
percent), independent colleges and universities (16 percent), DAC programs (18 percent), EPI
programs (9 percent), and public colleges (3 percent).
Fifty-five percent and 53 percent of EPI and ITP program completers, respectively, go on
to enter teaching but 87 percent of DAC program completers enter into the teaching profession
(Florida Department of Education, 2010). Among all program completers of 2007-2008, 65
percent were ITP program completers, 19 percent were DAC program graduates, and 16 EPI
program graduates. Among all program completers of 2007-2008 who were employed as a
teacher during 2008-2009, 58 percent were ITP program completers, 28 percent were DAC
5
Measured by the percentage of pupils with at least 50 percent learning gains, there
appears to be little difference in the effectiveness of ITP, DAC, and EPI programs (Table 1).
[Insert Table 1]
According to the Florida Department of Education (2009a), 64 percent of FAMU ITP
completers had 50 percent of their pupils make learning gains during 2007-2008.
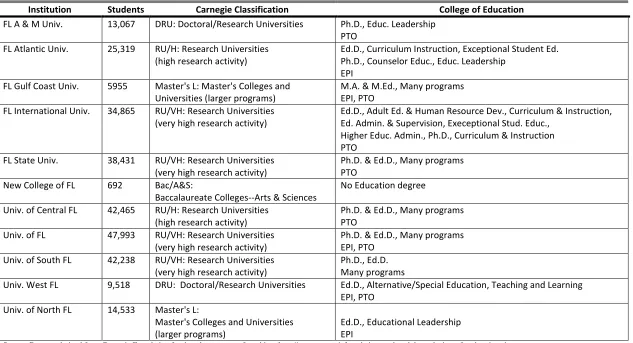
State University System of Florida
The State University System of Florida consists of 11 public universities differing in size,
scope, and student demographics, disbursed throughout the state’s population centers (Table 4).
New College of Florida is a small liberal arts institution, classified as a Baccalaureate College by
the Carnegie Foundation. It does not have a College of Education. Florida Gulf Coast University
(FGCU) and the University of North Florida (UNF) are Master’s Colleges and Universities (Larger Programs). FGCU does not have offer tenure to its faculty nor does its College of
Education offer a doctoral degree.
Florida A & M University (FAMU) and the University of West Florida (UWF) are
medium size universities classified as Doctoral/Research Universities. UWF and FAMU offer a
Doctor of Education and a Doctor of Philosophy, respectively, in educational leadership.
Florida Atlantic University (FAU) and University of Central Florida (UCF) are Research
Universities - High Research Activity. Both offer Doctor of Education and Doctor of Philosophy
degrees. FAU has an EPI, while UCF has a PTO program.
Florida State University, University of Florida, University of South Florida, and Florida
International University are Research Institutions - Very High Research Activity. Each offers
multiple doctoral degrees. The US News and World Report shows that the University of
6
Education (No. 3), Special Education (5) and Educational Administration (26). “Overall, the college ranks 54th nationally and 25th among public education institutions in the elite
Association of American Universities (http://www.coe.ufl.edu/).” [Insert Table 4]
II. Model
The quality of preparation provided to students may vary across and within universities.
College students of greater ability or greater willingness to work may be disproportionately
attracted to higher quality (more challenging) academic majors. Hence, the teaching ability of
graduating teachers may vary both because of heterogeneity in the ability, effort, and background
of college students and because of heterogeneity in the quality of academic majors and teaching
program.
Consider pupil i potential achievement for grade g, where A1,igt is the pupil’s year t
potential achievement if the pupil’s teacher entered teaching via a degree from college 1 and
A0,igt is the pupil’s year t potential achievement if the pupil’s teacher entered teaching via college
0. Let 1
t
ig
A represent pupil i actual achievement during the previous year. Hence, the potential
annual achievement gain to each pupil is
A1,igt = A1,igt – Aigt1 and
A0,igt = A0,igt – Aigt1.
If there are no endogeneity problems, the differences in achievement represent the value
added by college 1 teachers (the treatment group in the experiment) relative to college 0 teachers
(the control group in the experiment). For any given pupil i, we observe either A1,igt or A0,igt (or,
7
collegiate program (P) of the teacher and therefore we may state the observed difference in pupil
achievement as E(A1,igt) – E(A0,igt) = E(Aigt|P = 1) – E(Aigt|P = 0). In a regression framework, this is
Aijgt = 0 + 1Pijgt + it,
for student i and teacher j and where P = 1 if teacher has a college degree from teacher
preparation program P, but 0 otherwise. If E(|P) = 0, then 1 = E(Aigt|P = 1) – E(Aigt|P = 0) is the
mean value-added attributable to teachers having a collegiate program P degree.
For observational data, it is likely that E(|P) 0. Consistent and efficient estimation of
the differential productivity effect of teacher program P training (1) is conditional on our ability
to resolve this endogeneity problem via our sampling framework and empirical specification of
the pupil achievement equation. All of the teachers included in this study are new graduates of
public universities in the state of Florida; as such, each teacher from university P received
pre-professional training from a university of identical academic standards and resources and
on-the-job training is not correlated with P status.
To construct a regression model free of other endogeneity problems, we must further
control for nonrandom assignment of college students across universities, nonrandom assignment
of pupils to schools, and nonrandom matching of teachers and pupils within schools. We do so
by adding the following vectors to our regression model: teacher characteristics (T), pupil’s grade level and other characteristics (C), and school characteristics (S). In this case,
1 = E(Aijkt|P = 1, gradeijkt, Tijkt, Cijkt, Sijkt) – E(Aijkt|P = 0, gradeijkt, Tijkt, Cijkt, Sijkt) is the mean
value-added attributable to teachers having a program P degree, conditional on the characteristics
8
Equation (1) states that pupil academic achievement (Ai) is a function of pupil ability and
prior learning (Ai,t-1), teacher preparation program P, pupil grade level, teacher characteristics
(T), additional pupil characteristics (C), school fixed effects (S), and ε is a random error term.
(1) Aijkt = 0 + Ai,t-1 + P p
p ijpt
P 1, + 2Gradeit + Ttβ3 + Ctβ4 +
k
k kt
School + εt,
where P = {p1, p2, …, pn} is set of mutually exclusive and collectively exhaustive binary variables representing alternative undergraduate teacher preparation institutions.
Teacher’s demographic characteristics = {years of teaching experience, African
American male, African American female, white male, white female (omitted), Latino, Latina,
Native American male, Native American female, Asian male, Asian female, mixed race male,
mixed race female, other race male, other race female}. We capture a teacher’s analytical skills, intellectual development, and work ethic prior to college entry by a vector of college entry
examination scores, viz., scholastic achievement test (SAT) mathematics and verbal scores, and
teacher’s undergraduate grade point average within the State University System of Florida.
The following variables control for pupil heterogeneity: race (black, white, Hispanic) and
gender identity of the pupil; English language learner status of the pupil, that is, whether the
pupil is currently enrolled in classes specifically designed for limited English proficiency (LEP)
students or pupil is classified as LEP pupil but not enrolled in LEP classes, pupil who left the
LEP program within past 2 years or who left the LEP program more than 2 years ago; pupil is
eligible for free or reduced price lunch; primary exceptionality (22 controls for learning
disabilities, alternative measures of handicap status, and giftedness).1
Other controls include grade of pupil and year of examination.
Teacher’s college major consists of 21 academic disciplines within the College of
9
The teacher preparation institutions included in this study include Florida’s initial teacher preparation programs, which consist of three mostly two-year degree institutions, Chipola
College, Miami-Dade College, and St. Petersburg College, and the SUS institutions.
We test for the statistical significance and substantive educational importance of
teacher’s program of preparation. Our primary hypotheses are
H0: 1,p= 0 for each p and
H1: 1,p 0.
Pupil learning during a given period depends on a pupil’s entire history of learning, as affected by previous socioeconomic status, past teachers, natural ability, developed ability, past
peers, and so forth. Thus, Ai,t-1 is a baseline achievement measure, a sufficient statistic for all
past unobserved educational inputs and a pupil’s endowment of mental capacity. Todd and
Wolpin (2003) show that baseline achievement (Ai,t-1) is endogenous, that is, E(εt|Ai,t-1) 0. There are functional form and specification challenges posed by this endogeneity issue.
One approach ignores the endogeneity problem and estimates (1) as specified (Noelle, et al.,
2008; Boyd, et al., 2008; Chingos and Peterson, 2010). This approach yields parameter estimates
that are biased and inconsistent and the standard errors are incorrect.
A second approach seeks to eliminate the endogeneity problem via an annual gain
specification of the achievement function. This approach assumes = 1 and uses ordinary least
squares to estimate
(2) Aijkt - Ai,t-1 = 0 + P p
p ijpt
P 1, + 2Gradeit + Ttβ3 + Ctβ4 +
k
k kt
10
However, the annual gain specification is inappropriate on three grounds: i) it imposes a very
strong assumption on learning persistence; ii) it misspecifies the achievement function; and, iii) it
exacerbates the endogeneity problem.
The annual gain specification requires perfect learning persistence (α = 1), that is, all learning from the previous year carries over without loss to the current year and to all future
years of learning. For this assumption to hold, everything a pupil learned in 2nd grade would
persist (without any decay) for the pupil in 3rd grade and equal the achievement effects for every
grade beyond 3rd grade. Harris and Sass (2008) address this problem by allowing the persistence
coefficient (α) to take on a range of values within the interval [0.20 – 1.0]. Mostly, for
elementary school and middle school, their results show that parameter estimates and standard
errors decline as α decreases from 1.0 to 0.20. For high school, the opposite effect holds; namely, parameter estimates and standard errors increase as α decreases from 1.0 to 0.20.
Harris and Sass find no changes in the qualitative effects of parameters as the persistence
coefficient varies and no changes in statistical significance for high school pupils, and no
changes in statistical significance for 9 of 10 middle school equations. For the sole middle
mathematics equation where there is an important change in statistical significance, the size of
the test for the coefficient on the variable on interest moves from 0.05 to 0.10 as α decreases from 0.60 to 0.40 and the size of the test becomes greater than 0.10 at α = 0.20. Similarly, for a middle school reading equation, the size of the test for the parameter of interest moves from 0.05
to 0.10 as α decreases from 0.40 to 0.20.
For elementary school, for 3 of 5 reading equations, Harris and Sass (2008) find that the
size of test is constant at 0.10 as the persistence coefficient takes on a range of values within the
11
school mathematics equations, the parameter of interest becomes statistically insignificant for α = 0.60, α = 0.40, and α = 0.20 and is significant at the 5 percent and 10 percents levels α = 1.0 and α = 0.80, respectively.
The Harris and Sass results suggest that for both reading and mathematics and for
elementary, middle, and high school, the persistence coefficient falls into the range 0.60 ≤ α <
1.0. Mason (2010) finds complementary results, though Mason also shows that learning
persistence may vary according the race and gender of pupils as well as grade level. Using the
instrumental variables specification (discussed below), Mason finds that point estimates for
mathematical persistence are in the interval [0.65 – 0.78] and point estimates for reading persistence are in the interval [0.72 – 0.89]. For both reading and mathematics achievement, elementary school pupils have the highest persistence effect.
Equation (1) is an autoregressive distributive lag model. For this class of models, it is
well known that = 1 indicates that the achievement function has a unit root; hence, neither E(At
|A0) nor Var(At |A0) is a constant, so the achievement values will increase overtime without limit.
When a unit root exists, coefficients are biased (though consistent), the standard errors are
incorrect, and spurious correlation may occur.
Differencing the dependent variable is a common method for insuring that the series is
stationary. Differencing equation (1) yields
(3) At - At-1 = At-1 - At-2 + β1(Xt - Xt-1) + (εt - εt-1) or ∆At = ∆At-1 + β1∆Xt + νt.
where X represent all explanatory variables other than prior year achievement. Note that the
correct annual gain specification, equation (3), is different in important ways from the annual
gain specifications that are usually estimated in econometric practice, equation (2). Specifically,
12
the covariates, since Xt is used in equation (2) instead of ∆Xt as in equation (3). Equation (3) worsens the endogeneity problem associated with equation (1). We know E(εt |At-1) ≠ 0, E(εt-1 |At-2) ≠ 0, and E(εt-1 |At-1) > 0; hence, E(νt |∆At-1) ≠ 0. Differencing (1) solved the stationarity problem but it amplified the endogeneity problem. Utilizing (3), we would need instruments for
both At-1 and At-2.
Instrumental variable estimation provides a third approach for estimating (1). Per Todd
and Wolpin (2003), E(εt|Ai,t-2) = 0 and E(Ai,t-1|Ai,t-2) 0. We may use the latter conditional
expectation to obtain a predicted baseline achievement measure Aˆi,t1 and thereby obtain
consistent parameter estimates from equation (4).
(4) Aijkt = 0 + Aˆi,t1 +
P
p ijpt p
P 1, + 2Gradeit + Ttβ3 + Ctβ4 +
k
k kt
School + εt.
This approach requires at least 3 years of test scores. Only the final year of observations
is available for analysis. For an imbalanced 3-year panel, such as that utilized in this study, only
a fraction of the final year of observations is available for analysis. If a non-random fraction of
pupils have 3 years of test scores then the instrumental variable procedure may introduce
selection bias into the estimation process.
Equation (5) presents a fourth approach. It is an imputed persistence approach, combining
the strengths of the annual gain and instrumental variable specifications. Specifically, we use the
instrumental variable specification to obtain a race-sex group specific estimation of the
persistence coefficient (α). Given the race-sex estimate ˆrswe then estimate an annual gain
specification that is free of the assumption that α = 1. A strength of this approach is that we will
have just as many observations as in the annual gain specification; hence, we avoid both the
13
strong assumptions on learning persistence, the unit root problem, and the amplified endogneity
problem, all associated with equation (2).
A weakness of equation (5) is that the imputed point estimate for the persistence
parameter (ˆrs) may not unbiased or consistent; hence, the dependent variable of equation (5)
may suffer from measure error. If so, the coefficient estimates will be unbiased, consistent, and
efficient but the standard errors of the estimates are larger than they would be in the absence of
the error-in-variables problem for the dependent variable. Further, measurement error will reduce
R2 (goodness-of-fit) relative to the case without measurement error. Hence, coefficient estimates
from (5) are less likely to reject the null hypothesis relative to a model estimated without
measure error for the dependent variable.
(5) Aijkt - ˆrsAi,t-1 = 0 + P p
p ijpt
P 1, + 2Gradeit + Ttβ3 + Ctβ4 +
k
k kt
School + εt.
Finally, rather than concentrating on estimating the level of pupil academic achievement,
equation (6) seeks to estimate the net growth in academic achievement. This is a flow-to-flow
specification: a flow of teacher, pupil, family, and school resources during current year yields a
flow of net academic growth during the current year.
(6)
1 , 1 , , t ijk t ijk t ijk A A A
= 0 + P
p ijpt p
P 1, + 2Gradeit + Ttβ3 + Ctβ4 +
k
k kt
School + εt.
Nevertheless, this specification suffers from all of the weaknesses of equation (2). Its primary
strength is the ease of interpretation of its coefficients. Namely, the coefficients represent annual
growth rates or rates of return associated with particular explanatory variables. Mean levels of
learning gains (expected increases in standardized test scores) vary according to grade level, so
14
increase. (See Mason 2010). The net growth specification, equation (6), allows us to compare the
program effects on learning growth across grade levels.
For each specification we estimate 12 equations: separate equations for male and female
pupils, for African Americans, Hispanics, and whites, and for mathematics and reading
achievement. Equation (5), the imputed persistence parameter specification, is our preferred
model. The measurement error associated with this model creates higher standard errors than
would be the case in the absence of measurement error (though the parameter estimates are
efficient) and reduces the overall fit of the model; hence, the signs of the coefficients are valid,
even though the t-statistics are less likely to reject the null hypothesis than would be the case if
we did not have measurement error, and R2 will be lower. The instrumental variable specification
(equation 4) may create selection bias in our sample because we do not have a balanced sample.
Our sample is limited to pupils with teachers with less than 5 years of experience; hence, for a
given three-year period, we would not have the pupil’s test score for the year or years the pupil had a highly experience teacher, that is, a teacher with 6 or more years of experience. Also,
during a given three year period, pupils may move into or out of the sample, which also
contributes to imbalance. When the imputed persistence and instrumental variable specifications
have parameters with the same sign and the parameter is statistically significant in both
specifications, we can be confident of the qualitative effect of the parameter estimate.
By contrast, the parameter estimates are inconsistent and the standard errors are incorrect
for the lagged dependent variable (equation 1), annual gain (equation 2), and net growth
(equation 6) specifications. For these specifications, we do not know the direction of the bias of
the estimated coefficients. The lagged dependent variable specification suffers from endogenous
15
persistence and suffer from omitted variable bias, variable misspecification, measurement error,
and heighten endogenous variable bias.
III. Data
Description of variables
The data are provided by Florida’s K20 Education Data Warehouse, covering pupils and their new teachers who graduated from a Florida university during the academic years
2000-2001 to 2005-2006. The teacher sample is limited to persons teaching mathematics or English
courses. Pupil data refer only to pupils in mathematics and English/reading courses taught by
teachers in Florida’s public schools, with FCAT scores for 1998-1999 to 2005-2006. Teachers
and pupils are merged via a common course identification number. Each educator teaches within
the state of Florida and, therefore, has passed an identical series of state administered
certification examinations. Since all educators are new teachers (no teacher has more than 5
years of post-graduation experience), they were trained by a roughly similar set of
teacher-educators and other collegiate faculty at each undergraduate institution.
Experience and attrition will have a positive (negative) correlation if professional attrition
is relatively higher (lower) among poor quality teachers. Given the short duration of their
teaching career, on-the-job training effects (captured by years of experience) will not be
confounded by attrition (Kane, Rockoff, and Staiger, 2006). If experience varies by institutional
status, then estimates of the marginal effect of teacher preparation on pupil learning will be
biased, inconsistent, and inefficient because of the correlation of experience and attrition. Hence,
given a sample of new teachers, on-the-job training and undergraduate teacher preparation
16
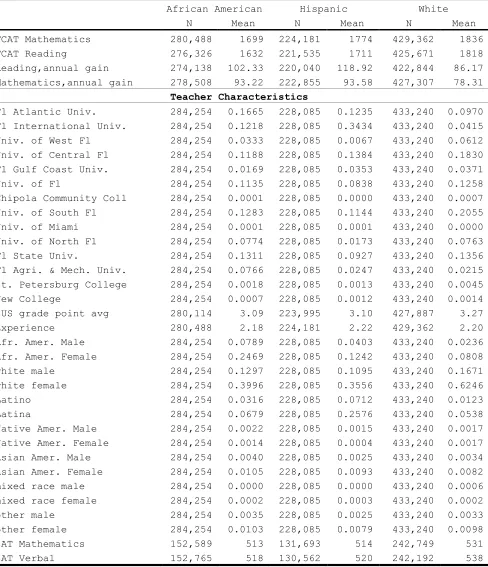
Table 3 presents descriptive statistics by race of pupil. Eight percent, 2.5 percent, and 2
percent of African American, Hispanic, and white pupils, respectively, are taught by graduates of
FAMU. Seventeen percent of African American pupils are taught by graduates of FAU, while 34
percent and 21 percent of Hispanic and white graduates are taught by graduates of Florida Intl.
University and Univ. of South Florida, respectively. White women are the largest group of
teachers of African American (40 percent), Hispanic (36 percent), and white pupils (62 percent).
African American and Hispanic pupils have teachers with nearly equal SAT scores, though the
SAT scores of teachers of white pupils are slightly higher.
[Insert Table 3]
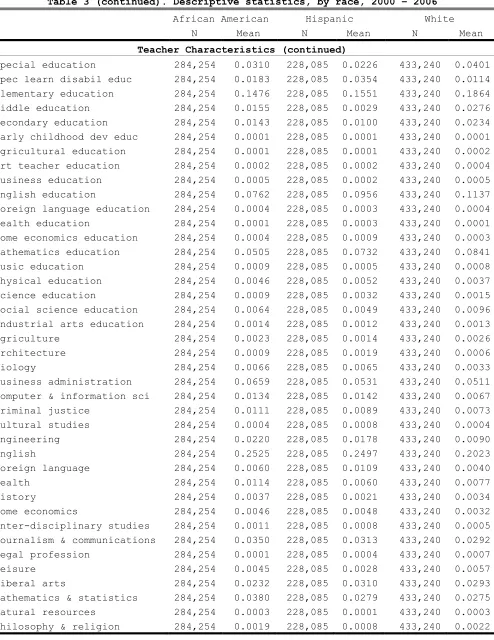
Thirty-eight percent of teachers of African American pupils have an education degree,
versus 43 percent and 51 percent of teachers of Hispanic and white pupils. Twenty-five percent
of teachers of African American and Hispanic pupils have English degrees, while 20 percent of
teachers of white pupils have English degrees. Just 4 percent of teachers of African American
pupils have a degree in mathematics or statistics, while only 3 percent of teachers of Hispanic
and white pupils have a mathematics or statistics degree.
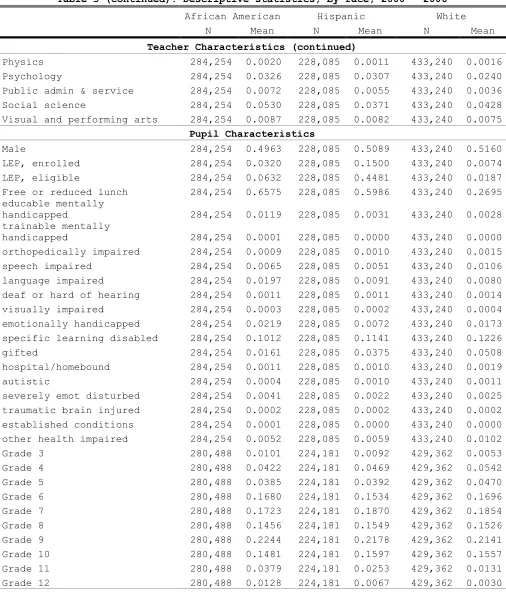
About 10 percent of African American pupils and 2.5 percent of white pupils are enrolled
in or eligible for enrollment in limited English proficiency courses. However, 60 percent of
Hispanic pupils are currently enrolled in or eligible for enrollment in limited English proficiency
courses. Two-thirds of African American pupils and 3/5 of Hispanic pupils are eligible for free
or reduce price lunch, but only 27 percent of white pupils are eligible for free or reduced price
lunch.
Ten percent, 11 percent, and 12 percent of African American, Hispanic, and white pupils
17
classified as gifted pupils. Roughly equal percentages of each group of pupils are enrolled in
grades 3 – 11.
IV. Results
We estimate five specifications of the pupil academic achievement equation. The teacher
program effects have virtually no sign differences between alternative specifications, though the
specifications do exhibit differences in the statistical significance and absolute value of
parameters. Regardless of specification or statistical significance, most teacher program
parameters are negative, indicating that pupils taught by teachers who graduated from Florida
Atlantic University, the comparative institution, will attain higher FCAT scores than otherwise
identical pupils taught by teachers prepared at other Florida universities and colleges.
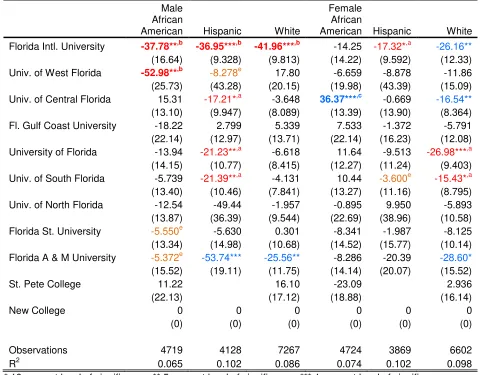
For the imputed persistence specification (equation 5), Tables 5a, 6a, and 7a (discussed
below) present the teacher program effects for elementary school, middle school, and high
school mathematics scores of pupils, both male and female. Tables 5b, 6b, and 7b present the
same information for the reading scores of pupils. The appendix contains the results for the
lagged dependent variable specification (equation 1, Tables A1 – A3), annual gain specification (equation 2, Tables A4 – A6), instrumental variable specification (equation 4, Tables A7 – A9), and net growth specification (equation 6, Tables A10 – A12).
The annual gain specification requires 100 percent achievement persistence, that is, α = 1,
while the net growth model assumes equal achievement persistence, regardless of race, gender,
subject matter, or grade level. Table 4 shows that neither assumption is appropriate. Except for
the reading achievement of African American females, achievement persistence declines as
pupils advance from elementary school to high school. Regardless of subject matter or grade
level, achievement persistence is about 10 percentage points lower among African American and
18
females than males, though there does not appear to be a gender difference for elementary school
and middle school. Finally, except for Hispanic and white elementary pupils, reading persistence
is greater than mathematics persistence.
[Insert Table 4]
Because of differing dependent variables, the R2 statistics for the alternative
specifications are not comparable. However, it is noteworthy that R2 is much lower for the
specifications affected by measurement error for the dependent variable (imputed persistence,
annual gain, and net growth) than for the lagged dependent and instrumental variable
specifications. For example, for the imputed persistence, annual gain, and net growth
specifications, for both reading and mathematics, and for male and female pupils, R2 never
exceeds 0.13 and is usually below 0.09. (See Table A13). But, for the lagged dependent variable
and instrumental variable specifications, R2 is never below 0.45 and is usually above 0.50.
With a balanced panel, the instrumental variable specification would be the preferred
specification. However, with our unbalanced panel the instrumental variable specification is
associated with a great reduction in degrees of freedom. For elementary school, we lose 1/4 to
1/3 of the observations. (See Table A13). For middle and high school, we lose 15 – 19 percent of the observations. These reductions are non-random. Pupils are most likely to have new teachers
for multiple years in a row at schools with high teacher turnover. Such large non-random
reductions in degrees of freedom create sample selection bias.
Tables 5 – 7 present the teacher program effects taken from the imputed persistence equations. Given the econometric problems associated with alternative specifications, along with
19
R2, and changes in sample size, the imputed persistence equation is our preferred specification. It
is the only specification with consistent and efficient parameter estimates.
In addition to the normal procedure of identifying statistically significant parameters, we
also use a system of superscripts to facilitate comparisons between statistical models. The
superscript “a” indicates that a parameter is statistically significant and has the same sign for
both the imputed persistence and instrumental variable specifications. When a parameter is
statistically significant and has the same sign for the imputed persistence, instrumental variable,
and annual gain or net growth specifications, it is identified by a “b” superscript.A “c”
superscript is assigned to parameters that are statistically significant and has the same sign for
both the imputed persistence and annual gain or net growth specifications. A “d” superscript is used to identify parameters that are insignificant in the imputed persistence model, but that are
significant in either the annual gain or net growth specification and that have the same sign as the
imputed persistence specification. Finally, an “e” superscript indicates that a parameter has the same sign in both the imputed persistence and instrumental variable specifications but that it is
significant only in the latter model.
Elementary school
The imputed persistence model suggests multiple teacher program effects for the
mathematics scores of Hispanic male and white female elementary pupils, but only limited
teacher program effects for the mathematics scores all other race-gender pupils (Table 5a). Many
of the statistically significant imputed persistence estimates are also significant in the other
specifications of the pupil achievement equation.
20
respectively, than otherwise identical pupils taught by FAU trained teachers. For elementary
white females, the FIU, UF, and FAMU program effects are -26 points, -27 points, and -29
points, respectively. For both race-gender groups, these are the largest program effects.
[Insert Tables 5a and 5b]
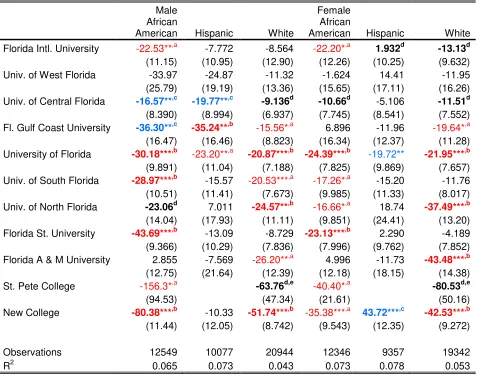
The imputed persistence model suggests the fewest number of significant teacher
program effects for the reading scores of Hispanic male and female elementary pupils, with a
greater number of teacher program effects for the reading scores all other race-gender pupils
(Table 5b). Nearly all of the statistically significant imputed persistence estimates are significant
in the other specifications of the pupil achievement equation.
The reading scores of African American males and females, white males and females,
and Hispanic males taught by graduates of New College are lower than the reading scores of
otherwise identical pupils taught by graduates of nearly all other other teacher programs, with
program effects of -80 points and -35 points, -52 points and -43 points, and -44 points,
respectively. Just St. Petersburg College has larger program effects for the reading achievement
of white male (-64 points) and female (-81 points) elementary pupils.
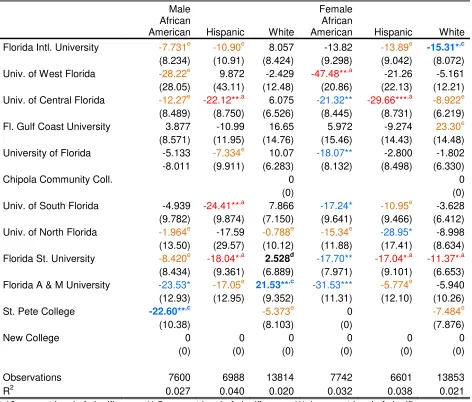
Middle school
The imputed persistence specification reveals diverse teacher program effects for the
mathematics scores of Hispanic male, African American female, and Hispanic female middle
school pupils, with fewer statistically significant program effects for the mathematics scores of
all other race-gender pupils (Table 6a). Many of the statistically significant imputed persistence
estimates are significant in the additional specifications of the pupil achievement equation.
However, it is also the case that statistically significant parameters for the instrumental variable
21
For middle school Hispanic males, FSU, UCF, and USF, have mathematics achievement
scores that are 18 points, 22 points, and 24 points lower, respectively, than otherwise identical
pupils taught by FAU trained teachers. For middle school African American females, UWF and
FAMU have the largest mathematics program effects, -47 points and -32 points, respectively,
while UCF (21 points), UF (-18 points), USF (-17 points), and FSU (-18 points) have smaller
program effects. UCF, UNF, and FSU also have the only significant program effects for
Hispanic females, -30 points, -29 points, and -17 points, respectively.
[Insert Tables 6a and 6b]
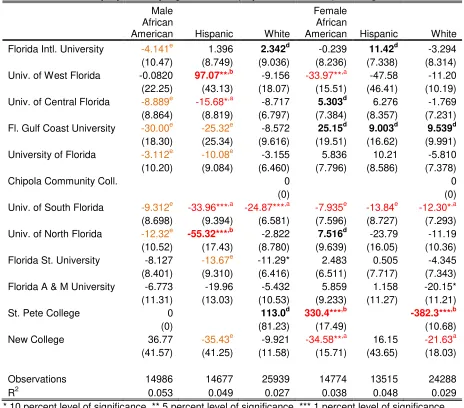
The imputed persistence specification uncovers no statistically significant program
effects for the reading scores of middle school African American males and Hispanic females
(Table 6b). Mostly, the statistically significant imputed persistence estimates are significant in
the additional specifications of the pupil achievement equation, even as the alternative
specifications identify statistically significant parameters that are insignificant for the imputed
persistence specification.
The reading scores of Hispanic males taught by graduates of UWF are 97 points higher
than the reading scores of otherwise identical pupils taught by graduates of FAU, though the
program effects for UCF, USF, and UNF are -16 points, -34 points, and -35 points, respectively.
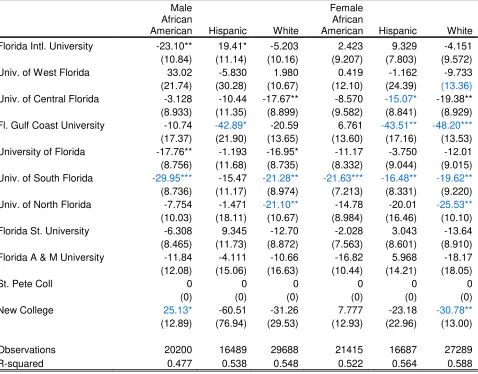
High school
The imputed persistence specification reveals diverse teacher program effects for the
mathematics scores for all race-gender groups of high school pupils (Table 7a). Many of the
statistically significant imputed persistence estimates are significant in the instrumental variable
specification of the pupil academic achievement equation. Yet, the imputed persistence
22
of high school pupils; the instructional variable specification has a larger number of statistically
significant parameters, though far less than for mathematics achievement.
[Insert Tables 7a and 7b]
For mathematics achievement, the imputed persistence specification identifies St.
Petersburg College as the most distinct teacher preparation program since for 4 of the 6
race-gender equations, St. Petersburg College has the largest or the next to the largest program effects
for the mathematics scores of high school pupils: -49 points (African American males), -46
points (Hispanic males), -38 points (African American females), and -35 points (Hispanic
females).
V. Discussion: limitations and conclusions
We estimate five specifications of the pupil academic achievement equation: lagged
dependent variable (1), annual gain (2), instrumental variables (4), imputed persistence (5), and
net growth (6) specifications. For all specifications, ordinary least squares is the estimation
procedure. The standard errors are adjusted for clustering: pupils with the same teacher have
correlated standard errors. We estimate separate regressions for elementary (grades 3 – 6), middle (grades 7 – 8), and high school (grades 9 – 12). Within each of these educational segments, we estimate separate regressions for African American males, African American
females, Latinos, Latinas, white males, and white females. For each race-gender group, we
estimate a separate equation for mathematics and readings. Finally, we control for teacher
preparation program effects via a complete set of binary controls representing all universities and
where FAU is the comparative institution. The estimation strategy yields a set of 72 regressions.
Our results show that: 1) the imputed persistence and instrumental variable specifications
23
and, 2) except for Florida Atlantic University, we found little systematic evidence of a college
preparation effect: pupils taught by teachers educated at Florida Atlantic University attain higher
FCAT scores than pupils with identical observable characteristics but with teachers trained other
Florida institutions, but there appears to be no systematic difference in teacher program effects
on pupil academic achievement among the Non-FAU trained teachers.
The near absence of college preparation effects on pupil achievement is for teachers with
1-5 years of experience; hence, it is unlikely to have occurred because of differences in teacher
attrition based on a teacher’s college of preparation. Also, this study does not contain any
information on the cost of training teachers by college of preparation. If, as this study suggests,
teachers are of nearly equal quality regardless of their institution of preparation, but teacher
preparation are relatively less expensive at some Florida institutions than at other Florida
institutions, then there may be efficiency differences among Florida’s institutions of higher education.
An important limitation of this study is that we do not have information on the
effectiveness of Florida-trained teachers employed outside the state of Florida or outside of
teaching within the State of Florida. Milton, et al. (2008) find that 72 percent of Initial Teacher
Preparation program completers are employed in a Florida school. Only 59 percent of our
Florida A & M University college of education completers is employed in a Florida school
compared to 71 percent for Florida Atlanta University, 76 percent for Florida International
University, 60 percent for Florida State University, and 61 percent for the University of Florida.
Hence, strictly speaking, our results provide program effects for teachers who graduated from a
Florida university and who choose to remain within the state of Florida. An additional important
24
individual schools. We have no information on the direction or the statistical significance of the
correlation between the preparation program of teachers and the quality of educational leadership
of the schools of employment of teachers.
Also, the present study as well as the professional literature equates college preparation
effects with mean test scores. But, the absence of a mean test score effect does not rule an
inequality effect as capture that the standard deviation of test scores. For example, teachers
trained at an institutions which emphasized “excellence” and teachers at institutions which
emphasize “equity” may have pupils with identical mean test scores but with statistically
significant differences in the standard deviation of test scores. Knowing whether a high mean
score has occurred because a teacher has raise the scores of all pupils or just raised the scores of
a few superstar pupils is a substantive policy issue.
Finally, this study has modeled education as a single product industry, that is, we have
assumed that pupil standardized test scores are the sole output. However, it may be the case that
education is a joint product industry, producing standardized test scores, disciplinary behavior,
information regarding career opportunities, retention and promotion, and so forth. The near
absence of a college preparation effect for standardized test scores does not provide information
on these simultaneous educational outcomes. Further, our study does not examine academic
outcomes other than reading and mathematics. Historical knowledge, science, art, and vocational
preparation are important academic outcomes that may have college preparation effects. Finally,
there are important non-academic outcomes that may have college preparation effects teen
pregnancy prevention, absence of negative contact with the criminal justice system, and
25 Notes
1
Primary exceptionalities include the following: educable mentally handicapped, trainable
mentally handicapped, orthopedically impaired, occupational therapy, physical therapy, speech
impaired, language impaired, deaf or hard of hearing, visually impaired, emotionally
handicapped, specific learning disabled, gifted, hospital/homebound, profoundly mentally
handicapped, dual-sensory impaired, autistic, severely emotionally disturbed, traumatic brain
26 References
Chingos, Matthew and Paul E. Peterson. (2010). “Do Schools Districts Get What They Pay For?
Predicting Teacher Effectiveness by College Selectivity, Experience, Etc.” Harvard University Program on Education Policy and Governance Working Papers Series 10-08.
Corcoran, S. P., & Jennings, J. L. (2009). Review of “An Evaluation of Teachers Trained
Through Different Routes to Certification: Final Report.” Boulder and Tempe: Education and the Public Interest Center & Education Policy Research Unit.
Florida Department of Education. (2009). “Overall Performance of 2007-08 Teacher Preparation Program Completers Teaching Reading and Mathematics Grades 4-10 during 2008-09.”
November.
Florida Department of Education. (2010a). “Teacher effectiveness in reading and mathematics
2008-2009.”
Florida Department of Education. (2010b). “Rule 6A-1.09981: Implementation of Florida’s System of School Improvement and Accountability,” Florida Administrative Weekly & Florida Administrative Code. https://www.flrules.org/gateway/RuleNo.asp?id=6A-1.09981 (April 12, 2010).
Florida Department of Education. (2004). “Fall Staff and Student Survey Data,” State Board of Education.
Harris, Douglas and Tim R. Sass. (2006). “Value-Added Models and the Measurement of
Teacher Quality,” Florida State University, Working paper.
Harris, Douglas and Tim R. Sass. (2008). “Teacher training, teacher quality and student achievement,” Florida State University, Working paper.
Kane, Thomas J., Jonah E. Rockoff, and Douglas O. Staiger. (2006). “What does certification tell us about teacher effectives? Evidence from New York City,” National Bureau of Economic
Research Working Paper 12155. http://www.nber.org/papers/w12155.
Milton, Sande, Pamela Flood, Melinda Dukes, Fely Curva, Ryan Wilke, Eileen McDaniel, Kathryn S. Hebda, Genae Crump, and Rebecca Pfeiffer (2008). “Beginning Teachers from Florida Teacher Preparation Programs: A Report on State Approved Teacher Preparation
Programs with Results of Surveys of Program Completers.” Florida Department of Education,
The Florida Center for Interactive Media, College of Education, Florida State University. January.
27
Rockoff, Jonah E. (2004). “The impact of individual teachers on student achievement: evidence from panel data,” American Economic Review Papers and Proceedings.
Todd, Petra E. and Kenneth I. Wolpin. (2003). “On the specification and estimation of the
28 Table 1. Percent of pupils with 50 percent or higher learning gains
Reading Mathematics
ITP DAC EPI ITP DAC EPI
Elementary school 88 83 93 81 85 77
Middle school 91 90 91 79 82 84
High school 37 35 31 89 96 82
Data are taken from Florida Department of Education, 2010.
Table 2. State University System of Florida (SUS)
Institution Students Carnegie Classification College of Education
FL A & M Univ. 13,067 DRU: Doctoral/Research Universities Ph.D., Educ. Leadership PTO
FL Atlantic Univ. 25,319 RU/H: Research Universities (high research activity)
Ed.D., Curriculum Instruction, Exceptional Student Ed. Ph.D., Counselor Educ., Educ. Leadership
EPI FL Gulf Coast Univ. 5955 Master's L: Master's Colleges and
Universities (larger programs)
M.A. & M.Ed., Many programs EPI, PTO
FL International Univ. 34,865 RU/VH: Research Universities (very high research activity)
Ed.D., Adult Ed. & Human Resource Dev., Curriculum & Instruction, Ed. Admin. & Supervision, Execeptional Stud. Educ.,
Higher Educ. Admin., Ph.D., Curriculum & Instruction PTO
FL State Univ. 38,431 RU/VH: Research Universities (very high research activity)
Ph.D. & Ed.D., Many programs PTO
New College of FL 692 Bac/A&S:
Baccalaureate Colleges--Arts & Sciences
No Education degree
Univ. of Central FL 42,465 RU/H: Research Universities (high research activity)
Ph.D. & Ed.D., Many programs PTO
Univ. of FL 47,993 RU/VH: Research Universities (very high research activity)
Ph.D. & Ed.D., Many programs EPI, PTO
Univ. of South FL 42,238 RU/VH: Research Universities (very high research activity)
Ph.D., Ed.D. Many programs
Univ. West FL 9,518 DRU: Doctoral/Research Universities Ed.D., Alternative/Special Education, Teaching and Learning EPI, PTO
Univ. of North FL 14,533 Master's L:
Master's Colleges and Universities (larger programs)
Ed.D., Educational Leadership EPI
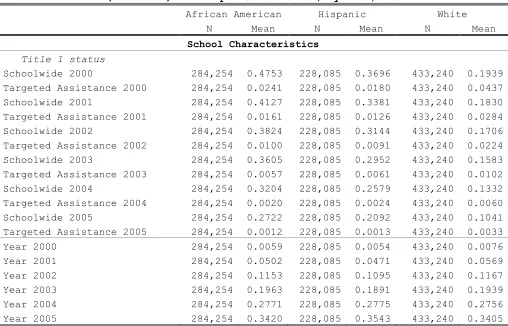
Table 3. Descriptive statistics, reading and mathematics classes, grades 3 -12,
by race, 2000 – 2006
African American Hispanic White
N Mean N Mean N Mean
FCAT Mathematics 280,488 1699 224,181 1774 429,362 1836 FCAT Reading 276,326 1632 221,535 1711 425,671 1818 Reading,annual gain 274,138 102.33 220,040 118.92 422,844 86.17 Mathematics,annual gain 278,508 93.22 222,855 93.58 427,307 78.31
Teacher Characteristics
Table 3 (continued). Descriptive statistics, by race, 2000 – 2006
African American Hispanic White
N Mean N Mean N Mean
Teacher Characteristics (continued)
[image:32.612.78.572.81.721.2]Table 3 (continued). Descriptive statistics, by race, 2000 – 2006
African American Hispanic White
N Mean N Mean N Mean
Teacher Characteristics (continued)
Physics 284,254 0.0020 228,085 0.0011 433,240 0.0016 Psychology 284,254 0.0326 228,085 0.0307 433,240 0.0240 Public admin & service 284,254 0.0072 228,085 0.0055 433,240 0.0036 Social science 284,254 0.0530 228,085 0.0371 433,240 0.0428 Visual and performing arts 284,254 0.0087 228,085 0.0082 433,240 0.0075
Pupil Characteristics
Male 284,254 0.4963 228,085 0.5089 433,240 0.5160 LEP, enrolled 284,254 0.0320 228,085 0.1500 433,240 0.0074 LEP, eligible 284,254 0.0632 228,085 0.4481 433,240 0.0187 Free or reduced lunch 284,254 0.6575 228,085 0.5986 433,240 0.2695 educable mentally
handicapped 284,254 0.0119 228,085 0.0031 433,240 0.0028 trainable mentally
[image:33.612.70.576.95.689.2]Table 3 (continued). Descriptive statistics, by race, 2000 – 2006
African American Hispanic White
N Mean N Mean N Mean
School Characteristics
Title 1 status
Schoolwide 2000 284,254 0.4753 228,085 0.3696 433,240 0.1939 Targeted Assistance 2000 284,254 0.0241 228,085 0.0180 433,240 0.0437 Schoolwide 2001 284,254 0.4127 228,085 0.3381 433,240 0.1830 Targeted Assistance 2001 284,254 0.0161 228,085 0.0126 433,240 0.0284 Schoolwide 2002 284,254 0.3824 228,085 0.3144 433,240 0.1706 Targeted Assistance 2002 284,254 0.0100 228,085 0.0091 433,240 0.0224 Schoolwide 2003 284,254 0.3605 228,085 0.2952 433,240 0.1583 Targeted Assistance 2003 284,254 0.0057 228,085 0.0061 433,240 0.0102 Schoolwide 2004 284,254 0.3204 228,085 0.2579 433,240 0.1332 Targeted Assistance 2004 284,254 0.0020 228,085 0.0024 433,240 0.0060 Schoolwide 2005 284,254 0.2722 228,085 0.2092 433,240 0.1041 Targeted Assistance 2005 284,254 0.0012 228,085 0.0013 433,240 0.0033 Year 2000 284,254 0.0059 228,085 0.0054 433,240 0.0076 Year 2001 284,254 0.0502 228,085 0.0471 433,240 0.0569 Year 2002 284,254 0.1153 228,085 0.1095 433,240 0.1167 Year 2003 284,254 0.1963 228,085 0.1891 433,240 0.1939 Year 2004 284,254 0.2771 228,085 0.2775 433,240 0.2756 Year 2005 284,254 0.3420 228,085 0.3543 433,240 0.3405
Table 4. Estimates of achievement persistence: by race, gender, grade, and subject matter
Males
African
American Hispanic White Elementary school Mathematics 0.77 0.75 0.86
Reading 0.77 0.74 0.85 Middle school Mathematics 0.69 0.66 0.78 Reading 0.76 0.71 0.80 High school Mathematics 0.58 0.64 0.71 Reading 0.71 0.71 0.79
Females
African
American Hispanic White Elementary school Mathematics 0.77 0.78 0.83
Reading 0.77 0.74 0.88 Middle school Mathematics 0.69 0.67 0.77 Reading 0.78 0.70 0.79 High school Mathematics 0.61 0.67 0.73 Reading 0.77 0.70 0.86
[image:34.612.69.577.95.421.2] [image:34.612.119.531.471.691.2]Table 5a.
Imputed persistence coefficient specification, mathematics: elementary school, program effects
Male Female
African
American Hispanic White
African
American Hispanic White Florida Intl. University -37.78**,b -36.95***,b -41.96***,b -14.25 -17.32*,a -26.16** (16.64) (9.328) (9.813) (14.22) (9.592) (12.33) Univ. of West Florida -52.98**,b -8.278e 17.80 -6.659 -8.878 -11.86 (25.73) (43.28) (20.15) (19.98) (43.39) (15.09) Univ. of Central Florida 15.31 -17.21*,a -3.648 36.37***,c -0.669 -16.54** (13.10) (9.947) (8.089) (13.39) (13.90) (8.364) Fl. Gulf Coast University -18.22 2.799 5.339 7.533 -1.372 -5.791 (22.14) (12.97) (13.71) (22.14) (16.23) (12.08) University of Florida -13.94 -21.23**,a -6.618 11.64 -9.513 -26.98***,a (14.15) (10.77) (8.415) (12.27) (11.24) (9.403) Univ. of South Florida -5.739 -21.39**,a -4.131 10.44 -3.600e -15.43*,a (13.40) (10.46) (7.841) (13.27) (11.16) (8.795) Univ. of North Florida -12.54 -49.44 -1.957 -0.895 9.950 -5.893 (13.87) (36.39) (9.544) (22.69) (38.96) (10.58) Florida St. University -5.550e -5.630 0.301 -8.341 -1.987 -8.125 (13.34) (14.98) (10.68) (14.52) (15.77) (10.14) Florida A & M University -5.372e -53.74*** -25.56** -8.286 -20.39 -28.60* (15.52) (19.11) (11.75) (14.14) (20.07) (15.52)
St. Pete College 11.22 16.10 -23.09 2.936
(22.13) (17.12) (18.88) (16.14)
New College 0 0 0 0 0 0
(0) (0) (0) (0) (0) (0)
Observations 4719 4128 7267 4724 3869 6602
R2 0.065 0.102 0.086 0.074 0.102 0.098
* 10 percent level of significance, ** 5 percent level of significance, *** 1 percent level of significance
a
statistically significant for both imputed coefficient and instrumental variable specifications and same sign
b
statistically significant for both imputed coefficient, instrumental variable, and annual gain or net growth specifications and same sign
c
statistically significant for both imputed coefficient and annual gain or net growth specifications and same sign and same sign for imputed coefficient and annual gain or net growth
d
same sign for imputed coefficient and annual gain or net growth
e
Table 5b. Teacher preparation program effects (imputed coefficient), reading: elementary school
Male Female
African
American Hispanic White
African
American Hispanic White Florida Intl. University -22.53**,a -7.772 -8.564 -22.20*,a 1.932d -13.13d (11.15) (10.95) (12.90) (12.26) (10.25) (9.632) Univ. of West Florida -33.97 -24.87 -11.32 -1.624 14.41 -11.95 (25.79) (19.19) (13.36) (15.65) (17.11) (16.26) Univ. of Central Florida -16.57**,c -19.77**,c -9.136d -10.66d -5.106 -11.51d (8.390) (8.994) (6.937) (7.745) (8.541) (7.552) Fl. Gulf Coast University -36.30**,c -35.24**,b -15.56*,a 6.896 -11.96 -19.64*,a (16.47) (16.46) (8.823) (16.34) (12.37) (11.28) University of Florida -30.18***,b -23.20**,a -20.87***,b -24.39***,b -19.72** -21.95***,b
(9.891) (11.04) (7.188) (7.825) (9.869) (7.657) Univ. of South Florida -28.97***,b -15.57 -20.53***,a -17.26*,a -15.20 -11.76 (10.51) (11.41) (7.673) (9.985) (11.33) (8.017) Univ. of North Florida -23.06d 7.011 -24.57**,b -16.66*,a 18.74 -37.49***,b
(14.04) (17.93) (11.11) (9.851) (24.41) (13.20) Florida St. University -43.69***,b -13.09 -8.729 -23.13***,b 2.290 -4.189 (9.366) (10.29) (7.836) (7.996) (9.762) (7.852) Florida A & M University 2.855 -7.569 -26.20**,a 4.996 -11.73 -43.48***,b (12.75) (21.64) (12.39) (12.18) (18.15) (14.38) St. Pete College -156.3*,a -63.76d,e -40.40*,a -80.53d,e
(94.53) (47.34) (21.61) (50.16)
New College -80.38***,b -10.33 -51.74***,b -35.38***,a 43.72***,c -42.53***,b (11.44) (12.05) (8.742) (9.543) (12.35) (9.272)
Observations 12549 10077 20944 12346 9357 19342
R2 0.065 0.073 0.043 0.073 0.078 0.053
* 10 percent level of significance, ** 5 percent level of significance, *** 1 percent level of significance
a
statistically significant for both imputed coefficient and instrumental variable specifications and same sign
b
statistically significant for both imputed coefficient, instrumental variable, and annual gain or net growth specifications and same sign
c
statistically significant for both imputed coefficient and annual gain or net growth specifications and same sign and same sign for imputed coefficient and annual gain or net growth
d
same sign for imputed coefficient and annual gain or net growth
e
Table 6a
Imputed persistence coefficient specification, mathematics: middle school, program effects
Male Female
African
American Hispanic White
African
American Hispanic White Florida Intl. University -7.731e -10.90e 8.057 -13.82 -13.89e -15.31*,c (8.234) (10.91) (8.424) (9.298) (9.042) (8.072) Univ. of West Florida -28.22e 9.872 -2.429 -47.48**,a -21.26 -5.161 (28.05) (43.11) (12.48) (20.86) (22.13) (12.21) Univ. of Central Florida -12.27e -22.12**,a 6.075 -21.32** -29.66***,a -8.922e (8.489) (8.750) (6.526) (8.445) (8.731) (6.219) Fl. Gulf Coast University 3.877 -10.99 16.65 5.972 -9.274 23.30e (8.571) (11.95) (14.76) (15.46) (14.43) (14.48) University of Florida -5.133 -7.334e 10.07 -18.07** -2.800 -1.802 -8.011 (9.911) (6.283) (8.132) (8.498) (6.330)
Chipola Community Coll. 0 0
(0) (0)
Univ. of South Florida -4.939 -24.41**,a 7.866 -17.24* -10.95e -3.628 (9.782) (9.874) (7.150) (9.641) (9.466) (6.412) Univ. of North Florida -1.964e -17.59 -0.788e -15.34e -28.95* -8.998 (13.50) (29.57) (10.12) (11.88) (17.41) (8.634) Florida St. University -8.420e -18.04*,a 2.528d -17.70** -17.04*,a -11.37*,a (8.434) (9.361) (6.889) (7.971) (9.101) (6.653) Florida A & M University -23.53* -17.05e 21.53**,c -31.53*** -5.774e -5.940 (12.93) (12.95) (9.352) (11.31) (12.10) (10.26)
St. Pete College -22.60**,c -5.373e 0 -7.484e
(10.38) (8.103) (0) (7.876)
New College 0 0 0 0 0 0
(0) (0) (0) (0) (0) (0)
Observations 7600 6988 13814 7742 6601 13853
R2 0.027 0.040 0.020 0.032 0.038 0.021
* 10 percent level of significance, ** 5 percent level of significance, *** 1 percent level of significance
a
statistically significant for both imputed coefficient and instrumental variable specifications and same sign
b
statistically significant for both imputed coefficient, instrumental variable, and annual gain or net growth specifications and same sign
c
statistically significant for both imputed coefficient and annual gain or net growth specifications and same sign and same sign for imputed coefficient and annual gain or net growth
d
same sign for imputed coefficient and annual gain or net growth
e
Table 6b. Teacher preparation program effects (imputed coefficient), reading: middle school
Male Female
African
American Hispanic White
African
American Hispanic White Florida Intl. University -4.141e 1.396 2.342d -0.239 11.42d -3.294 (10.47) (8.749) (9.036) (8.236) (7.338) (8.314) Univ. of West Florida -0.0820 97.07**,b -9.156 -33.97**,a -47.58 -11.20 (22.25) (43.13) (18.07) (15.51) (46.41) (10.19) Univ. of Central Florida -8.889e -15.68*,a -8.717 5.303d 6.276 -1.769 (8.864) (8.819) (6.797) (7.384) (8.357) (7.231) Fl. Gulf Coast University -30.00e -25.32e -8.572 25.15d 9.003d 9.539d (18.30) (25.34) (9.616) (19.51) (16.62) (9.991) University of Florida -3.112e -10.08e -3.155 5.836 10.21 -5.810 (10.20) (9.084) (6.460) (7.796) (8.586) (7.378)
Chipola Community Coll. 0 0
(0) (0)
Univ. of South Florida -9.312e -33.96***,a -24.87***,a -7.935e -13.84e -12.30*,a (8.698) (9.394) (6.581) (7.596) (8.727) (7.293) Univ. of North Florida -12.32e -55.32***,b -2.822 7.516d -23.79 -11.19 (10.52) (17.43) (8.780) (9.639) (16.05) (10.36) Florida St. University -8.127 -13.67e -11.29* 2.483 0.505 -4.345 (8.401) (9.310) (6.416) (6.511) (7.717) (7.343) Florida A & M University -6.773 -19.96 -5.432 5.859 1.158 -20.15* (11.31) (13.03) (10.53) (9.233) (11.27) (11.21) St. Pete College 0 113.0d 330.4***,b -382.3***,b
(0) (81.23) (17.49) (10.68)
New College 36.77 -35.43e -9.921 -34.58**,a 16.15 -21.63a (41.57) (41.25) (11.58) (15.71) (43.65) (18.03)
Observations 14986 14677 25939 14774 13515 24288
R2 0.053 0.049 0.027 0.038 0.048 0.029
* 10 percent level of significance, ** 5 percent level of significance, *** 1 percent level of significance
a
statistically significant for both imputed coefficient and instrumental variable specifications and same sign
b
statistically significant for both imputed coefficient, instrumental variable, and annual gain or net growth specifications and same sign
c
statistically significant for both imputed coefficient and annual gain or net growth specifications and same sign and same sign for imputed coefficient and annual gain or net growth
d
same sign for imputed coefficient and annual gain or net growth
e
Table 7a.
Imputed persistence coefficient specification, mathematics: high school, program effects
Male Female
African
American Hispanic White
African
American Hispanic White Florida Intl. University -4.882 -11.37*,a -28.70***,a -11.75*,a -14.91**,a -13.79*,a (8.067) (6.510) (8.334) (6.919) (6.085) (7.844) Univ. of West Florida -6.268 -25.90***,a -14.86**,c -22.86***,c -10.81* -8.560d (6.878) (6.798) (7.316) (8.714) (5.900) (9.686) Univ. of Central Florida -13.04** -23.11***,a -19.28***,a -16.92***,a -25.25***,b -13.27***,a (5.661) (6.437) (4.107) (6.197) (5.350) (4.591) Fl. Gulf Coast University -20.25 -34.64***,a -24.76***,a -29.16*,c -20.37***,a -18.87**,a (15.34) (11.11) (5.600) (15.53) (6.893) (7.870) University of Florida -11.99**,a -13.93**,a -19.04***,b -15.36***,a -15.42**,a -11.73***,a (5.214) (6.524) (3.956) (4.878) (5.998) (4.009) Univ. of South Florida -6.964 -21.19***,a -23.54***,b -15.71***,b -17.84***,a -18.55***,a (5.612) (7.352) (4.798) (5.559) (6.051) (4.655) Univ. of North Florida 7.087d 3.576 -3.466 -6.996 -10.05e -2.245 (5.846) (7.005) (4.501) (6.326) (7.427) (4.134) Florida St. University -7.138 -15.77**,a -21.15***,b -14.13***,a -13.56**,a -10.31**,a (5.373) (7.495) (4.059) (4.438) (5.944) (4.181) Florida A & M University -8.324 -5.335 -35.36***,c -21.82*** -3.795e -9.478 (9.872) (9.758) (8.645) (5.674) (6.963) (6.659) St. Pete College -49.12***,a -46.29***,a -20.99*,a -38.16***,a -35.11***,a -14.20**,a (7.346) (9.907) (11.22) (7.543) (11.57) (6.053) New College 26.28***,c -51.95***,b -24.60*** -11.36*,a -12.69e -3.345e (7.630) (8.917) (5.831) (6.663) (8.440) (5.908)
Observations 11923 11216 20075 12618 10984 19522
R2 0.073 0.082 0.063 0.080 0.074 0.084
* 10 percent level of significance, ** 5 percent level of significance, *** 1 percent level of significance
a
statistically significant for both imputed coefficient and instrumental variable specifications and same sign
b
statistically significant for both imputed coefficient, instrumental variable, and annual gain or net growth specifications and same sign
c
statistically significant for both imputed coefficient and annual gain or net growth specifications and same sign and same sign for imputed coefficient and annual gain or net growth
d
same sign for imputed coefficient and annual gain or net growth
e