© 2018, IRJET | Impact Factor value: 6.171 | ISO 9001:2008 Certified Journal | Page 630
Survey on data mining techniques for disease prediction
Durga Kinge
1, S. K. Gaikwad
21Student, Dept. of Computer engineering, College of Engineering Pune, Maharashtra, India 2 Professor, Dept. of Computer engineering, College of Engineering Pune, Maharashtra, India
---***---Abstract -
Medicinal services produces gigantic information on every day ground having diverse structures like printed, images, numbers pool and so forth. However there is absence of devices accessible in heathcare to process this data. Data mining frameworks are utilized to extricate information from this data which can be utilized by media proficient individual to figure future procedures. Heart illness is the primary driver of death in the masses. Early recognizing and hazard expectations are essential for patient's medicines and specialists analysis. Data mining algorithms like Decision trees (J48), Bayesian classifiers, Multilayer perceptron, Simple logistic and Ensemble techniques are utilized to determine the heart ailments. In this work, different data mining classification procedures are analyzed for testing their precision and execution on preparing medicinal informational index. The classification results will be envisioned by various representation procedures like 2D diagrams, pie graphs, and different techniques. The beforehand mentioned calculations are analyzed and assessed based on their exactness, time utilization factor, territory under ROC and so on.Key Words: Data mining, Decision tree, Ensemble techniques, multilayer perceptron, Bayesian classifiers, simple logistic.
1. INTRODUCTION
Heart ailment are one of the significant reason of death and disability on the planet, killing 17.5 million individuals every year and more than twenty-three million anticipated passing from cardiovascular sickness by 2030. Coronary illness incorporates different sorts of conditions that can influence center reason. The heart is an important organ of human body. On the off chance that the blood dissemination to the body is lacking, the organs of the body that is cerebrum and heart quit working and passing happens in couple of minutes. The peril factors related are distinguished as age, family history, diabetes , hypertension, elevated cholesterol, tobacco, smoke, liquor inward breath, heftiness, physical idleness, chest torment write and less than stellar eating routine [1].
Medical industry is data rich yet learning poor. There is requirement for a wise emotionally supportive network for ailment forecast. Data mining strategies like Classification, regression are utilized to anticipate the infection. With the advancements of computing facility gave by software engineering innovation, it is currently conceivable to anticipate many states of infirmities more accurately[15].
Data mining is a cognitive procedure of discovering the hidden approach patterns from large data set. It is generally utilized for applications, for example, financial data ,analytic thinking, retail, media transmission industry, genome data analysis, logical applications and health mind frameworks and so on. Data mining holds Extraordinary potential to improve heath frameworks by utilizing data and analytics to recognize the accepted procedures that enhance care and reduce cost. WEKA is a effective tool as it contains both supervised and unsupervised learning techniques[14]. We utilize WEKA because it causes us to evaluate and compare data mining techniques (like Classification, Clustering, and Regression etc.) conveniently on real data.
The objective of this work is to anayze the potential utilization of classification based data mining techniques like naive bayes, decision tree(j48), ensemble algorithms and simple logistic and so forth.
2.LITERATURE REVIEW
Various work has been improved the situation disease forecast concentrating on heart illness utilizing different data mining systems. Authors have connected distinctive data mining techniques like decision trees, KNN, support vector machine, neural network that contrast in their accuracy, execution time.
Mr.Chintan Shah et.al [1], clarifies dialog of different classification algorithms in view of specific parameters like time taken to build the model, accurately and inaccurately classified instances and so on. Theresa Princy. R. [2] proposed a framework to precisely foresee heart disease utiizing ID3 and KNN classifiers and accuracy level also provided for different number of attributes.
Finding of coronary illness with the assistance of Bayesian Network calculation has been characterized by Xue et al [3]. Abraham proposed a methodology so as to increase classification accuracy of medical data based on Naive Bayes classifier algorithm [4]. Palaniappan & Awang [5] recommended a model of IHDPS (Intelligent Heart Disease Prediction System) actualizing data mining calculations, like Naive-Bayes, Decision Trees and Neural Network. The last yield of these algorithm depicts that every strategy has its distinctive capacities in the reason for the portrayed mining objectives.
© 2018, IRJET | Impact Factor value: 6.171 | ISO 9001:2008 Certified Journal | Page 631 FPGrowth are used to discover association rules of heart
dataset attributes[6]. In [7], diverse machine learning systems including Decision Tree (DT), Naive Bayes (NB), Multilayer Perceptron (MLP), K-Nearest Neighbor (K-NN), Single Conjunctive Rule Learner (SCRL), Radial Basis Function (RBF) and Support Vector Machine (SVM) have been applied, individually and in combination, using ensemble machine learning approaches, on the Cleveland Heart Disease data set keeping in mind the end goal to analyze the execution of every strategy. Gudadhe et al. [8] realized a design base with both the MLP network and the SVM approach. This design accomplished an accuracy of 80.41% in terms of the classification between two classes (the presence or absence of heart disease, respectively).
Author in [9] assesses the disease categorization using three different machine learning calculations by WEKA Tool. We compare the results in terms of time taken to build the model and its accuracy. This work demonstrate the Random Forest is best classifier for disease categorization of WEKA tool because it runs efficiently on large datasets. In paper [10], author applied HNB classifier for analysis of coronary illness tested execution for heart stalog data collection. Experimental result demonstrate that HNB model exhibits a predominant execution compared with other Approaches. Proposed approach applies discretization and IQR filters to enhance the efficiency of Hidden naïve bayes.
Authors in [12] executed the framework that extracts hidden knowledge from a historical heart disease database. Mamta Sharma[13] uncovers that the Neural Networks with 15 attributes shows significant results over all other data mining techniques. Decision Tree methods has proven excellent precision with C4.5, ID3, CART and J48.
3. THEORITICAL BACKGROUND
Knowledge discovery in databases (KDD) is the interactive and iterative process of finding valuable information from a collection of data. KDD incorporates multidisciplinary exercise. The means engaged with KDD process are listed below-
Selection - Data applicable to the analysis task are retrieved from the database
Pre-processing - In this step noise and inconsistent data are removed from large data set. Data cleaning is a fundamental step to solve inconsistency problem and cleanup errors in crude data.
Transformation - The strategies like smoothing, aggregation, normalization to transform them into forms appropriate for mining.
Data mining - Intelligent strategies are applied in order to extract data patterns.
Interpretation/ Evaluation - Data patterns are evaluated and visualized and removing redundant patterns from the patterns we generated.
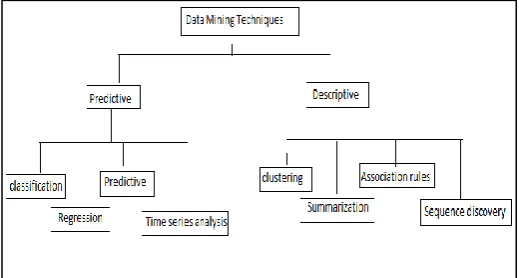
[image:2.595.307.567.209.348.2]Data mining is the core part of the knowledge discovery process of sorting through large data sets to discover correlation among attributes. There are few noteworthy data mining techniques have been produced and used in data mining projects as outlined in underneath figure. Description methods concentrate on understanding the way the underlying data operates while prediction-oriented methods aim to build a behavioral model for acquiring new and unseen samples and for foreseeing estimations of at least one variables related to the sample.
Fig -1: Taxonomy of Data Mining Methods
These strategies falls into two categories in particular supervised and unsupervised learning. In supervised learning a function is inferred from training data while in unsupervised learning, find hidden structured data in unlabeled data.
3.1 Data mining techniques used for Heart Disease Prediction
There are two forms of analysis algorithms introduced in data mining as classification and prediction.
3.1.1 Classification
Classification is a supervised technique which assigns items in the collection to target category or classes. Mainly two classes are present- binary and muti-class.
The classification task takes as input the component vector X and predicts its value for the outcome Y i.e.
C(X) ∈ Y
where:
X is a feature vector
Y is a response taking values in the set C C( X) are the values in the set C.
© 2018, IRJET | Impact Factor value: 6.171 | ISO 9001:2008 Certified Journal | Page 632 Diverse classification algorithms utilize distinctive
techniques for discovering relationships. These connections are summarized in a model, which would then have the capacity to connected to an other informational collection in which the class assignments are obscure for testing reason.
3.1.2 Prediction
Regression is adapted to foresee the scope of numeric or continuous values given a particular dataset.
Following equation demonstrate that regression is the way toward estimating the value of a continuous target (p) as a function (F) of one or more predictors (x1 , x2 , ..., xn), a set of parameters (R1 , R2 , ..., Rn), and a measure of error (e).
e
R
x
F
p
(
,
)
Regression helps in distinguishing the behavior of a variable when other variable(s) are changed in the process.
3.1.3 Clustering
It is unsupervised learning technique in which specific arrangement of unlabeled occurrences are gathered in view of their characteristics. By representing the records including fewer clusters loses certain fine details, but achieves simplification. Cluster analysis expects to discover the groups with the end goal that the inter-cluster similarity is low and the intra-group similitude is high. There are few distinctive methodologies of clustering: partitioning, hierarchical, density-based, grid-based and constrained-based methods.
3.1.4 Ensemble learning
Ensemble learning is also called committee based learning/ multiple classifier systems/ classifier combinations. The idea of deploying multiple model has been utilized for long time. In this compose multiple classifiers are consolidated to solve same problem by constructing set of hypothesis and join them to use. Training data might not provide adequate information for choosing single best learner. Ensemble helps to minimize noise, bias, variance. For getting good ensemble base learners ought to be more accurate and diverse. Accuracy can be accomplished by cross-validation and diversity can be achieved by sub sampling of training examples, manipuating attributes and outputs, injecting randomness.
Strategies used for ensemble learning are Boosting, Bagging, Stacking. These are also called as meta algorithms.
Bagging : It is also called as bootstrap aggregation which tries to implement similar learners on small sample population and then takes mean of all predictions.
Equation for bagging =
n
i i
e
n
11
It is parallel technique used to decrease the variance . It trains M distinct trees on various subsets of data picked arbitrarily with substitution and compute the ensemble. It uses bootstrap sampling to obtain data subsets of training the base learners.
Boosting : Boosting is an ensemble technique in which the predictors are not made autonomously, but rather consecutively used to reduce bias. This system utilizes the rationale in which the subsequent predictors learn from the mistakes of the previous predictors and finally takes weighted average. In this way, the perceptions have an unequal likelihood of showing up in resulting models and ones with the highest error appear most.
Equation for boosting =
n
i i i
e
w
n
11
In this way, the perceptions have an unequal likelihood of showing up in resulting models and ones with the most elevated blunder seem most.
Stacking : In this type the base level models are trained based on a complete training set, then the meta model is trained on the output of base level for improving predictive force.
3.2 Algorithms used for disease prediction
3.2.1 Decision tree algorithm(J48)
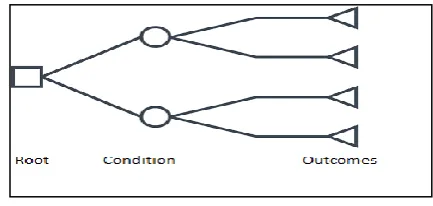
[image:3.595.323.540.511.614.2]It is a supervised learning algorithm used to predict class / value of target variable using decision rules. Each inward hub of the tree relates to an attribute, and each leaf hub compares to a class name. The record’s attribute values are continuously compared with other internal nodes of the tree until leaf node is reached with predicted class value.
Fig -2 : Decision Tree
Decision Trees follow Sum of Product (SOP) representation for all the classes. Decision trees can handle both categorical and numerical data. Attribute selection is based on information gain and gini index.
ci
i
i
p
p
S
E
1
2
log
)
(
© 2018, IRJET | Impact Factor value: 6.171 | ISO 9001:2008 Certified Journal | Page 633 more profound to diminish the preparation set blunder
however comes about with an extended test set mistake. J48 is an extension of ID3. Different highlights of j48 algorithm are that it supports tree pruning, can handle missing values and furthermore gives out efficient yield for prediction analysis in weka[11].
3.2.2 Naive Bayes
The Naive Bayes Classifier system depends on the Bayesian speculation and is especially suited when the dimensionality of the input is high. Bayes Theorem - It works on conditional probability. Conditional probability is the probability that an occasion will happen, given that other occasion has just happened.
)
(
)
(
*
)
|
(
)
|
(
E
P
H
P
H
E
P
E
H
P
where
P(H) is the likelihood of hypothesis H being valid. This is known as the prior probability.
P(E) is the likelihood of the evidence(regardless of the hypothesis).
P(E|H) is the likelihood of the evidence given that hypothesis is true.
P(H|E) is the likelihood of the hypothesis given that the evidence is there.
Naive Bayes Classifier - It predicts membership probabilities for each class, for example, the likelihood that given record or information point has a place with a specific class. The class with the highest probability is considered as the most likely class. It is a highly fast and scalable algorithm.
3.2.3 Support Vector Machine (SVM)
A Support Vector Machine (SVM) is a supervised learning classifier characterized by by a separating hyperplane. The hyperplane is a line that partitions a plane in two sections where each class lay in either side.
There are 2 sorts of SVM classifiers: 1. Linear SVM Classifier
2. Non-Linear SVM Classifier
3.2.4 Random Forest
This constructs a randomized decision tree in each iteration of the algorithm and frequently creates excellent predictors. Every sub tree gives a classification and provides the tree votes for that class.
Every tree in the ensemble is built using sample from the training set. With increase in number of trees in forest accuracy increases too. Random forest algorithm can use for both classification and the regression kind of problems. For classification issues, the ensemble of trees vote in favor of the most prominent class. In the regression problem, their responses are averaged to obtain an estimate of the dependent variable.
Random Forests reduces high variance and bias present in decision tree by averaging the values o outcomes.
3.2.4 AdaBoost
The core principle of AdaBoost is to fit a succession of feeble learners (i.e., models that are just somewhat superior than random guessing, such as small decision trees) on repeatedly modified versions of the data. The predictions from every one of them are then combined through a weighted majority vote (or sum) to deliver the final prediction.
3.2.5 Simple Linear Regression model
Simple linear regression is a statistical method that empowers users to summarize and study relationships between two continuous variables. It is a model that expect a linear relationship between the input variables (x) and the single output variable (y). Here the y can be figured from a linear blend of the input variables (x).
If there is only one input variable (x), the method is called a simple linear regression otherwise multiple linear regression.
3.2.6 Multilayer Percepteron(MLP)
Multilayer perceptron which makes use of multiple layers of the neural network is created by using the set of various parameters which are selected to adjust the models with the help of correlation between parameters and prediction of the disease[16].
Fig-3 : Support Vector Machine
SVMs are powerful when the quantity of highlights are very vast. Since the SVM algorithm works locally on numeric properties, it utilizes a z-score standardization on numeric characteristics.
0
(.)
R
R
f
M
_
1
k
1th
response
tree
K
k k
© 2018, IRJET | Impact Factor value: 6.171 | ISO 9001:2008 Certified Journal | Page 634 An MLP comprises of multiple layers of nodes in a directed
graph, with each layer completely associated with the following one. Aside from the information nodes, every node is a neuron (or preparing component) with a nonlinear enactment work. MLP utilizes a supervised learning technique called back propagation for training the network.
Multi-layered neural networks are basically used to manage data-sets that have an extensive number of features, especially non-linear ones. Intuitively, the more hidden layers it has, the more 'complex' shapes it can fit.
3.2.7 Logistic Regression
Logistic regression is a type of supervised technique that measures the connection between the dependent and independent variables by evaluating probabilities using a logistic function. Logistic regression predicts the likelihood of a result that can only have two values (i.e. a dichotomy). In this model categorical variables are used.
3.3 Performance Metrics
3.3.1 Accuracy : The ability of the model to correctly predict the class label of new or previously unseen data
Accuracy =
FN
FP
TN
TP
TN
TP
T
N
Where
N- number of correct predictions T - Total of all the cases to be predicted
True positive (TP): Sick people correctly identified as sick False positive (FP): Healthy people incorrectly identified as sick
True negative (TN): Healthy people correctly identified as healthy
False negative (FN): Sick people incorrectly identified as healthy
Recall = TR/ T= TP / (TP + FN) Specificity = TN / N = TN / (TN + FP) Precision = TP / P = TP / (TP + FP)
F Score = 2*(Recall * Precision) / (Recall + Precision)
3.3.2 Mean Absolute Error : Measure of difference between two continuous variables.
MAE =
n
Forecast
Actual
n
i
i i
13.3.3 Root Mean Squared error : It follows an assumption that error are unbiased and follow a normal distribution.
RMS =
n
e
n
i i
1 2
3.3.4 ROC (Receive operating characteristic) :It is a graphical representation of performance of classifiers.
3.3.5 Kappa Statistics : The kappa statistic is frequently used to test inter rater reliability that is it is used to compare accuracy of the system to the random system.
K = P(A) − P(E) /(1− P(E) P(A) - Agreement percentage P(E) - Agreement chances.
If K = 1 - Agreement in tolerable range
4 DATA ANALYSIS AND RESULTS
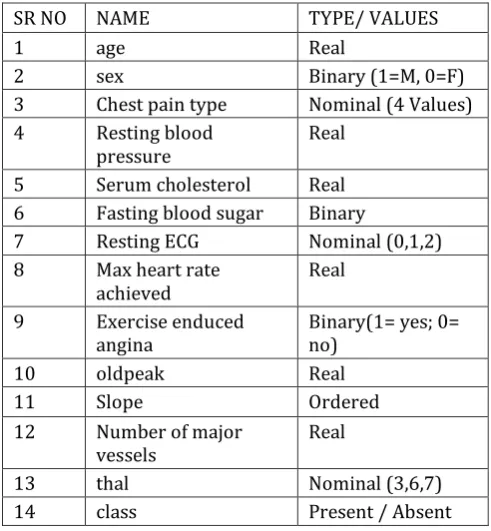
[image:5.595.311.557.416.682.2]The dataset utilized is the UCI Heart-disease dataset having total 303 instances. It comprise of aggregate 75 attributes from which 14 are used. Attributes utilized are of real, binary, nominal, and ordered type. The attributes and its descriptions are given as below
Table -1 : Heart Disease Dataset
SR NO NAME TYPE/ VALUES
1 age Real
2 sex Binary (1=M, 0=F)
3 Chest pain type Nominal (4 Values)
4 Resting blood
pressure Real
5 Serum cholesterol Real
6 Fasting blood sugar Binary
7 Resting ECG Nominal (0,1,2)
8 Max heart rate
achieved Real
9 Exercise enduced
angina Binary(1= yes; 0= no)
10 oldpeak Real
11 Slope Ordered
12 Number of major
vessels Real
13 thal Nominal (3,6,7)
14 class Present / Absent
4.1 Interpretation and Evaluation
© 2018, IRJET | Impact Factor value: 6.171 | ISO 9001:2008 Certified Journal | Page 635 Table -2 Supervised simulation errors
Mean Absolute Error
Root Mean Sq Error
Relative Absolut e Error
Root Relative Sq error
J48 0.25 0.43 55.48 92.59
N. Bayess 0.18 0.35 37.16 72.40
R. Forest 0.27 0.35 54.57 72.18
Adaboost 0.23 0.36 48.06 76.62
Bagging 0.29 0.37 59.41 75.95
MLP 0.21 0.42 45.54 86.44
S.logistic 0.23 0.35 46.60 71.59
As appeared in Table II and Table III, all simulations were performed using WEKA machine learning environment which consists of collection of popular machine learning techniques that can be used for practical data mining
Table -3 WEKA evaluation criteria
Preci
sion Recall F Kappa Stat
Area under ROC
Time in sec
J48 0.80 0.82 0.81 0.55 0.79 0.01
N Bayes 0.84 0.87 0.86 0.67 0.90 0.04
RF 0.84 0.87 0.85 0.66 0.90 0.26
Adboost 0.84 0.84 0.83 0.63 0.89 0.06 Bagging 0.83 0.85 0.84 0.63 0.88 0.08
MLP 0.82 0.81 0.81 0.58 0.86 0.59
S.logist 0.84 0.87 0.85 0.66 0.90 0.32
Classification metrics such as TP (True Positive), FP (False Positive), Precision, Recall, FMeasure and ROC Area are used to assess classifiers performance.
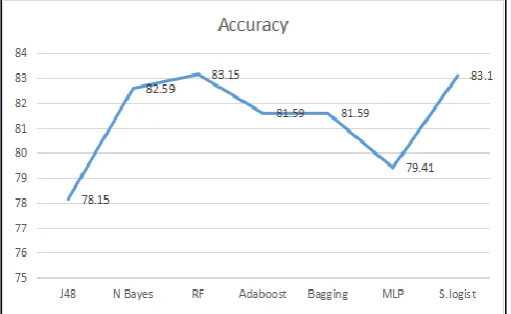
Chart -1: Accuracy of Algorithms
Above figure shows the accuracy levels for all classifiers. It demonstrate that both J48 and random forest, simple logistic have better accuracy whereas the J48 shows poor accuracy levels.
Chart -2 :
Classifier Accuracy Measures Values
5 CONCLUSIONS
Heart Disease is a fatal disease by its nature. This disease makes a life threatening complexities, for example heart attack and death. The significance of Data Mining in the Medical Domain is acknowledged and steps are taken to apply relevant techniques in the Disease Prediction. The various research works with some effective techniques done by different people were studied. This work evaluates the disease categorization using diverse machine learning algorithms by WEKA Tool.
In this work, seven classifiers Naive Bayes, Random Forest, simple logistic, Bagging, MLP and Adaboost are used for experimentation. It shows that random forest, simple logistic and Naive bayes perorm better for heart disease prediction.
6 REFERENCES
[1] Yanwei X, Wang J, Zhao Z, Gao Y., “Combination data mining models with new medical data to predict outcome of coronary heart disease”, Proceedings International Conference on Convergence Information Technology;2007. p. 868–72.
[2] Theresa Princy. R,J. Thomas, “Human Heart Disease Prediction System using Data Mining Techniques. International Conference on Circuit”, Power and Computing Technologies [ICCPCT],2016.
[3] Weimin Xue, Yanan Sun, Yuchang Lu, “Research and Application of Data Mining in Traditional Chinese Medical Clinic Diagnosis”, In proc of IEEE 8th international Conference on Signal Processing, Vol. 4, ISBN: 0-7803-9736-3, 2006.
[image:6.595.35.291.525.682.2]© 2018, IRJET | Impact Factor value: 6.171 | ISO 9001:2008 Certified Journal | Page 636 [5] S. Palaniappan and R. Awang, “Intelligent heart disease
prediction system using data mining techniques,” in Proc. of IEEE/ACS Int. Conf., Doha, 2008, pp. 108-115.
[6] Jagdeep Singh, Amit Kamra, Harbhag Singh. Prediction of Heart Diseases Using Associative Classification, Vol 978-1-5090-0893-3/16 IEEE 2016.
[7] Seyedamin Pouriyeh , Sara Vahid , Giovanna Sanninoy, Giuseppe De Pietroy, Hamid Arabnia, “A Comprehensive Investigation and Comparison of Machine Learning Techniques in the Domain of Heart Disease”, 22nd IEEE Symposium on Computers and Communication (ISCC 2017): Workshops - ICTS4eHealth 2017.
[8] M. Gudadhe, K. Wankhade, and S. Dongre, “Decision support system for heart disease based on support vector machine and artificial neural network,” in Computer and Communication Technology (ICCCT), 2010 International Conference on, 2010, pp. 741–745.
[9] Munaza Ramzan, “Comparing and Evaluating the Performance of WEKA Classifiers on Critical Diseases”, 978-1-4673-6984-8/16/$31.00 c � 2016 IEEE.
[10] M.A.Jabbar, Shirina samreen, “Heart disease prediction system based on hidden naïve bayes classifier”, ICECIT, pp 183-192, Elsevier, vol 1(2012).
[11] Ajinkya kunjir, Harshal sawant, Nuzhat Sheikh, “Data mining and visualization for prediction of multiple diseases in healthcare”, IEEE 2007.
[12] Garima Singh, Kiran Bagwe, Shivani Shanbhag, Shraddha Singh, Sulochana Devi, “Heart disease prediction using Naïve Bayes”, International Research Journal of Engineering and Technology (IRJET) e-ISSN: 2395 -0056 Volume: 04 Issue: 03 | Mar -2017.
[13] Prof. Mamta Sharma, Farheen Khan, Vishnupriya Ravichandran, “Comparing Data Mining Techniques Used For Heart Disease Prediction”, International Research Journal of Engineering and Technology (IRJET) e-ISSN: 2395 -0056 Volume: 04 Issue: 06 June -2017.
[14] Munaza Ramzan, “Comparing and Evaluating the Performance of WEKA Classifiers on Critical Diseases”, 978-1-4673-6984-8/16/$31.00 2016 IEEE.
[15] C. M. Velu and K. R. Kashwan, “Visual Data Mining Techniques for Classification of Diabetic Patients”, IEEE, DOI: 10.1109/IAdCC.2013.6514375.
[16] Aditya A. Shinde, Rahul M. Samant, Atharva S. Naik, Shubham A. Ghorpade, Sharad N. Kale, “Heart Disease Prediction System using Multilayered Feed Forward Neural Network and Back Propagation Neural Network”, International Journal of Computer Applications (0975 – 8887) Volume 166 – No.7, May 2017.