Electrical Impedance Tomography using EIDORS in a
Closed Phantom
Vidya Sarode
Xavier Institute of Engineering,Mumbai, India.
Priya M. Chimurkar
Electrical Department,VJTI, Mumbai, India.
Alice N Cheeran
Electrical Department, VJTI, Mumbai, India.ABSTRACT
Electrical Impedance Tomography is an imaging technique which images the resistivity distribution of the body. An alternating current is injected through the contact electrodes placed on the surface and resulting potentials are measured to image the current density distribution which is solved as Inverse Problem. The EIDORS (Electrical Impedance and Diffused Optical Reconstruction Software) is an open source software suite used for the reconstruction of Electrical Impedance Tomography (EIT) and Diffused Optical Tomography (DOT). This paper describes the EIT experiments conducted on a circular box phantom. Here a low magnitude current is applied in a neighboring current pattern and the boundary potentials are measured and the resistivity images are reconstructed using EIDORS for circular inhomogeneities used inside the phantom.
General Terms
Electrical Impedance Tomography, Anomaly detection.
Keywords
EIT, Inverse Problem, EIDORS, Phantom, Impurities.
1.
INTRODUCTION
Electrical Impedance Tomography is an upcoming medical and industrial imaging technique. EIT is advantageous [1] to other imaging technology in medical field such as Positron Emission Tomography (PET), X-Ray, Computed Tomography (CT), and Breast Magnetic Resonance Imaging (BMRI) [2] with respect to harmful radiations which may cause side effects to the body. Also these machines are bulky and require special attention by skilled personnel while EIT is portable [3, 4]. EIT makes noninvasive sample analysis for geophysical explorations as well as biomedical diagnosis for breast cancer. The measured voltages are used in reconstruction algorithm to reconstruct the resistivity profile inside the body under test [5, 6, 7].
Finite Element Method is the basis for all the softwares used for reconstruction in EIT. EIDORS is used for 2-D and 3-D reconstruction of image based on voltage dataset. EIDORS is an open source suite implemented in MATLAB package [8, 9]. This software is divided in three stages i.e. mesh generation, forward problem and inverse problem [10]. The forward problem calculates the voltage values inside the object when conductivity distribution is given in that object. The inverse problem is to obtain an adequate estimation of the interior conductivity distribution, based on the measured voltage values. To perform the EIT an experiment directly on the patient‟s body is neither ethical nor permitted hence a phantom can be used instead of human body.
The EIT experiments are explained in subsequent sections. Section 2 describes the EIT system and the experimental set
up and the current injection pattern. The algorithm used for reconstruction is explained in section 3. Section 4 gives details of impurities, locations and their reconstructed profiles
2.
EIT SYSTEM
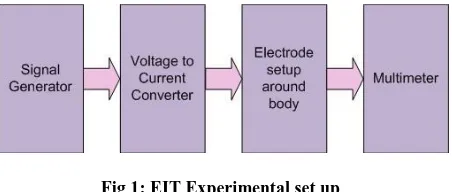
[image:1.595.318.544.433.529.2]Fig 1 shows EIT Experimental set up. It includes signal generator, a voltage to current converter producing a current of 20 mA at 5 KHz, a closed phantom with 16 electrode set up and a multimeter to measure resulting differential voltages [11]. This paper gives description of experiments performed on 16 gold plated silver electrodes, plastic container of 14cm diameter and 7cm height filled with saline solution of 0.9% of sodium chloride having electrical conductivity of 300 ms/m. The low magnitude and low frequency sinusoidal current is applied to the pair of electrodes. Current can be applied in neighboring pattern, opposite pattern, cross pattern and adaptive pattern [12, 13]. The neighboring pattern is also known as adjacent pattern. Brown and Segar (1987) [14] suggested a method where current is applied to a pair of electrodes and voltage is measured from other noncurrent pair of electrodes.
Fig 1: EIT Experimental set up
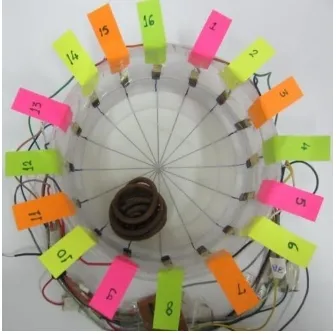
Various conducting and non conducting impurities are used in this experiment Conducting impurities used are a copper spindle of 4.5 cm diameter and copper cents of 1.8 cm diameter which are 17 in number and are arranged in cylindrical fashion to form a single conducting impurity. The non conducting impurities used are wooden balls of different diameters, smaller wooden ball has diameter of 3.5 cm and larger wooden ball has diameter of 5 cm. The other non conducting impurities are clay cylinder of 1.8 cm diameter × 5.8 cm height and an oval shaped marble having diameter of 4 cm and height of 5.8 cm. These conducting and non conducting impurities are inserted one after another inside the solution.
Fig 2: Adjacent current projection method
3.
ALGORITHM DESCRIPTION
The reconstruction algorithm is based on modified Newton Raphson method [17]. It is a non linear algorithm used to find homotopy between the measured value and calculated value. This difference algorithm is applied to obtain the conductivity distribution when any impurity of conducting or non conducting nature is kept in saline solution. The basis equation for the algorithm is
𝜙 =12(𝑉𝑠− 𝑉𝑚)𝑇(𝑉𝑠− 𝑉𝑚) (1)
Where 𝜙 is potential at that point, 𝑉𝑠 is the voltage when there
is no impurity in saline solution and 𝑉𝑚 is the voltage when
impurity is placed in the solution. EIT problem is to find the update in conductivity (∆𝝈) and minimize the 𝜙 value. So, we differentiate 𝜙 with respect to 𝝈 and set the result equals to zero.
𝜕𝜙 𝜕𝜎 =
𝜕𝑉𝑠
𝜕𝜎 𝑇
𝑉𝑠− 𝑉𝑚 = 0 (2)
where𝜕𝑉𝜕𝜎𝑠= 𝐽, Jacobean Matrix
Using Taylor Series Expansion for calculating the conductivity value for kth iteration 𝝈 = 𝜎𝑘
𝜕𝜙 𝜕𝜎 =
𝜕𝜙 𝜕𝜎 𝜎
𝑘 + 𝜕2𝜙
𝜕𝜎2 𝜎𝑘 ∆𝜎𝑘 (3)
By approximation of above equation and putting the value in equation (4) we get
𝛥𝜎 = 𝐽𝑇𝐽 −1. 𝐽𝑇. 𝑉
𝑠− 𝑉𝑚 (6)
The inversion of the hessian matrix is illposed and therefore the stable numerical solution depends on the regularization factor. The well known regularization method is Tikhonov zero-order regularization method. Hence the equation becomes
𝛥𝜎 = 𝐽𝑇𝐽 + 𝜆𝐼 −1. 𝐽𝑇. 𝑉𝑠− 𝑉𝑚 (7)
4.
Reconstruction Methods
[image:2.595.345.514.287.453.2]This paper focuses on Inverse problem for 2-D reconstruction considering the position of impurity as unknown. Initial stage for estimating the permittivity and conductivity distribution in plastic container is to create finite element model of electrodes and circular container. This finite model is solved by assuming homogenous conductivity and calculating voltage distribution..
Fig 3: Electrode arrangement in Saline Solution inside plastic container
Fig 4: Reconstruction of saline solution in plastic container using EIDORS
The Legend line along with outputs shows the distribution of voltage with respect to colors from low voltage to high. In EIDORS dark blue color symbolize the low voltage and dark red color signify high voltage while the voltages from low to high varies with the color from blue to red respectively.
[image:3.595.336.523.72.431.2]All experiments have been performed after verifying the homogenous conductivity of saline solution.
[image:3.595.345.515.82.247.2]Fig 5: A wooden ball kept near 11, 12 and 13
Fig 6: Reconstruction of a wooden ball kept near 11, 12 and 13
Fig 6 shows the variation of voltage distribution profile when single non-conducting impurity i.e. large wooden ball is placed near electrode 11, 12 and 13. Presence of non conducting impurity increases the voltage in that region so that voltage rises in respective area indicated by red color. It is found that this algorithm can identify more than one impurity as shown in fig 7 and 8.
Fig 7: Small ball at 3, 4 and big ball at 11, 12 and 13
Fig 8: Reconstruction of Small ball kept near 3, 4 and big ball kept near 11, 12 and 13
[image:3.595.80.253.169.448.2]Similarly the conducting impurity is placed near electrode 9 and it is detected by decrease in voltage indicated by blue color as shown in fig 9 and 10.
[image:3.595.76.257.334.508.2] [image:3.595.345.513.497.664.2]Fig 10: Reconstruction of Copper Spindle near 9
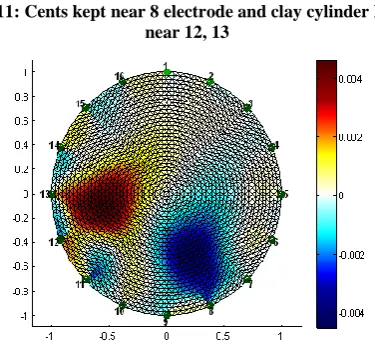
[image:4.595.344.512.86.315.2]Another experiment is performed this time by changing the impurities and their respective positions in the phantom. A cylinder of 17 cents placed is placed near electrode 8 and clay cylinder is placed near 12, 13. The reconstruction is shown in fig 12.
Fig 11: Cents kept near 8 electrode and clay cylinder kept near 12, 13
[image:4.595.72.266.312.668.2]Fig 12: Reconstruction of Cents near 8 and clay cylinder near 12, 13
Fig 13: Oval marble placed at the centre
Fig 14: Reconstruction of Oval Marble at centre
5.
RESULT
The geometry of positions of electrodes and the location of impurity is clearly seen in reconstructed EIDORS images. The blue color in Fig 10 and 12 shows the abrupt declining in conductivity. Thus the presence of conducting impurities is confirmed. Similarly from the fig 6, 8, 12 and 14, the red color in reconstructed images detects the presence of non conducting impurity.
6.
CONCLUSION AND FUTURE PLANS
Thus Electrical Impedance Tomography is used to tackle challenging problem of detection of abnormalities in human tissue as well as the inhomogeneities in materials. The simulation carried out by EIDORS detects the objects having high electrical conductivity as well as low electrical conductivity. The conductivity distribution depends on the material of electrodes, number of electrodes and the medium used in experiment.
[image:4.595.82.253.315.482.2] [image:4.595.73.261.491.666.2]7.
ACKNOWLEDGMENTS
The authors thank Xavier Institute of Engineering and VJTI. This work was not possible without the help of Fr Reginald Tauro, Director XIE and Fr Fabian Barreto, Administrator XIE.
8.
REFERENCES
[1] Webster J. G, “Medical Instrumentation Application and Design”, Third edition, Wiley India, 2007.
[2] Bohare M. D, Cheeran A. N and Sarode V, “Analysis of Breast MRI images using Wavelets for Detection of Cancer” ICEICE 2011, Proceedings published by International Journal of Computer Applications (IJCA).
[3] Pahuja S. K, Anand S., and Sengupta A., ”Electrical impedance tomography based image reconstruction and feto-maternal monitoring in pregnancy”, Vol.3, No.8, pp.:482-486(2011) doi:10.4236/health.2011.38079.
[4] Brown B. H, Smallwood R H, Barber D. C, Lawford P. V and Hose D. R, “Medical Science Series MEDICAL PHYSICS AND BIOMEDICAL ENGINEERING”, UK Institute of Physics Publishing Bristol and Philadelphia (1999), Chapter 12.
[5] Erwati M. T, and Farrukh N., “Applications of electrical impedance tomography for imaging in biomedical and material technology”, Proceedings of 2009 IEEE Students Conference on research and development. (SCOReD 2009), 16-18 Nov ‟09, UPM Serdang, Malaysia.
[6] Kumar S., Anand S. and Sengupta A., ”Impedence based image reconstruction of the field distribution inside the closed phantom using finite element method”, (IJCNS) International Journal of Computer and Network Security. Vol. 2, No 7, July 2010.
[7] Zou Y. and Guo Z., “A review of electrical impedance techniques for breast cancer detection”, Elsevier Medical Engineering and Physics 25, (2003).
[8] Adler A. and Lionheart W.R.B., “EIDORS: Towards a community-based extensible software base for EIT”.
[9] Adler A. and Lionheart W.R.B., “Uses and abuses of EIDORS: An extensible software base for EIT”, ISSN 1749-9097 May 2006.
[10] Vauhkonen M., Lionheart W.R.B, Heikkinen L.M.,. Vauhkonen P. J and Kaipio J. P,”A MATLAB Package for the EIDORS project to reconstruct two-dimensional EIT images”, ISSN 0788-4672, September 2000..
[11] Bera T. K and Nagaraju J., “Resistivity Imaging of a reconfigurable phantom with circular inhomogeneities in 2D-electrical impedance tomography”, Measurement 44(2011), pp 518-526, doi:10.1016/j.measurement. 2010.11.015
[12] Bera T. K and Nagaraju J., “Studying the resistivity imaging of chicken tissue phantoms with different current patterns in Electrical Impedance Tomography (EIT)”, Measurement(2012), doi:10.1016/j.measurement. 2012.01.002
[13] Manage P., Sarode V. and Dr Cheeran A., “Electrical Impedance Tomography And Its Applications” i-COST Electronics & Communication Conference proceedings 13-15 January 2011 S.S.V.P.S„s B.S. Deore College of Engineering & Polytechnic, Dhule pp 2.22. 1
[14] Brown B. H and Seagar A. D, “The Sheffield data collection system”, Clin. Phys. Physiol. Meas., 1987, Vol. 8, Suppl. A, 91-97.
[15] Sarode V., Chimurkar P. M. and Cheeran A. N., “Electrical Impedance Tomography (EIT) based Medical Imaging using Finite Element Method (FEM)”, International Journal of Engineering Sciences & Emerging Technologies Feb 2012 Vol. 1, Issue 2, pp 83-89 (IJESET).
[16] Soleimani M., “Electrical impedance tomography system: an open access circuit design” Biomedical Engineering Online, 03 May 2006.