Location Based Personalization and Prediction of Data
Services using a Learning Algorithm
Sagar Jhobalia
Dwarkadas J. Sanghvi College
of Engineering.
University of Mumbai
Monal Vora
Dwarkadas J. Sanghvi College
of Engineering.
University of Mumbai
Bhavin Palan
Dwarkadas J. Sanghvi College
of Engineering.
University of Mumbai
ABSTRACT
This paper outlines a model that enriches the user experience of using Mobile Value Added Services (MVAS). Specifically the location based data services segment of MVAS is taken into consideration for experimentation purposes. The model describes a method to personalize user information related to various data services offered to the user on a mobile phone. Our model is trained to predict the services required by specific set of users at a given time and location. In addition to prediction the algorithm ranks services to personalize the user experience; anticipating user‘s need and preferences. The model delineated is an intelligent model that evolves with usage of the application. The user interacts via query-alert and feedback. The paper also describes some efficiency measures, implementation guidelines and the details of surveys conducted and the conclusions deduced on experiments performed with a simulated prototype.
General Terms
Mobile Computing, Data Mining & Prediction.
Keywords
Location Based Data Services, Relative Ranking Algorithm, Personalization, Prediction.
1.
INTRODUCTION
Mobile Value Added Services (MVAS) have come a long way from simple SMS-based services to multimedia-rich content. With advances in handsets, cellular networks and Web technologies, users can access an almost infinite array of applications for games, ringtones, commerce, m-governance, m-education, m-infotainment, location-aware services, etc. With voice becoming a commodity across global markets and with the carriers focus on non-voice services growing, facilitated by availability of 3G & 4G access technologies, rising penetration of smart phones and a vibrant applications and services ecosystem, the contribution of MVAS revenues is increasing across emerging as well as developed markets. Leading carriers in developed and emerging markets have mobile non-voice services contributing to as much as 50% and 35-40% of their total wireless revenues, respectively [1]. This serves to emphasize that when the experience is right, mobile users are looking for ways to add value to their device experience– and are in many cases prepared to pay to get what they want.
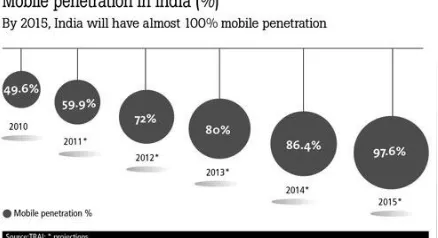
As the Indian telecom industry sees a rapid decline in voice tariffs, it is looking at services beyond standard voice calls in the form of Mobile Value Added Services (MVAS) to propel it to the next level of growth. Fig.1 underscores the facts that with mobile penetration expected to go up to nearly 100% by 2015, and the recent advent of 3G in India; MVAS revenues are expected to grow to approximately INR 48,000 crores in India that is an increase from 34% in 2010 to 54% [2].This
augurs the notion that the Indian cellular market will not only look at MVAS as a growth driver but also as a key differentiator in the near future.
Yet despite this, MVAS in India appears to lag most other countries, even when compared with other developing markets, leading to a ―MVAS Vacuum‖ [3]. We observe three main reasons for this. First, the mobile operators have till date focused on acquiring customers in the urban areas where VAS has not been needed or used as a differentiator. Secondly, SMS usage in India is much lower than in other developing markets, perhaps a function of low literacy rates, and certainly inversely correlated with high voice usage. Finally, the late release of 3G spectrum and licenses may also mean that operators have not yet devoted the resources to develop MVAS applications, which typically happens when at least one player starts actively to push its 3G network. But as the Indian market enters its next phase of growth, MVAS is destined to be an important part of the operators‘ product mix [3].A recent market study spanning across a wide range of age groups, socio-economic backgrounds and demographic locations, conducted by Nokia showed that 86% of the 1052 respondents were interested in MVAS Services with 25% being very interested and 34% being quite interested in MVAS [4].
[image:1.595.321.540.256.375.2]Though MVAS encompasses a gamut of value add-on services, we have delineated location-aware personalized data service - a very recent development in the MVAS segment. The MVAS data service model implemented today in India lacks personalization and fails to deliver appropriate location-aware information customized to the user‘s requirement. Consumers today are literally bombarded with unwanted information —and as a result, they often turned off and frustrated. Personalized LBS data service eliminates the noise by adapting content and services to their individual preferences, needs and interests. A recent Neilsen Research survey showed that 63 percent of consumers would sign up
for personalized services if offered– totaling an estimated $17 billion in new service provider business by 2014 globally [5] .Our prototype is designed to be an evolutionary self-learning model that employs a rank algorithm to personalize and prioritize the location based data services most likely to be useful for the consumer. Our model not only helps network providers drive revenues directly, but also helps them build strong relationships with customers as customer data can be mined to create customized services that increase loyalty and stickiness. Our model provides a three-fold market strategic goal for network providers by helping them to augment: revenue growth, customer acquisition and customer retention.
2.
RELATED WORK
A rapid surge and evolution in Location Determination Technologies (LDT‘s) coupled with the advances made in the field of wireless cellular technologies in recent years has given rise to the possibility of precisely locating a mobile phone. This has opened up a plethora of a new set of wireless applications, known as ―Location Based Services‖ (LBS), which carry great commercial potential. Examples of LBS applications include navigation (directions, traffic control), information (travel and tourist guides, personalized data alerts), tracking (people, vehicle or product tracking), emergency (police, ambulance), advertising (advertisement alerts), billing (road tolls), and social networking (locating friends, instant messaging) [6].
LBS services can be categorized as triggered LBS services (push services) and user-requested LBS services (pull services). In a triggered (push) LBS service, the location of user's mobile device is retrieved when a condition set in advance is fulfilled. For example, a call to emergency center can automatically trigger a location request. Advertisement messages can be delivered to users who enter a specific area in a shopping mall, and warning messages can be delivered to users who are in the area where weather conditions will change (e.g. hurricane, rain). In a user-requested (pull) LBS service, the user decides whether and when to retrieve the location of his/her mobile device and use it in the service. User-requested LBS service can involve personal location (i.e. finding the current location of the user) or services location (i.e. finding the location of the nearest restaurant or bank). Navigation and direction system is an example of pull LBS services [7].
Though various challenges have emerged for personalized LBS-database management, profile building and updating, efficient data transfer over cellular networks, spatial and temporal query processing, security and privacy issues etc - the growth trajectory of LBS is striking. According to a recent report from Allied Business Intelligence Inc., LBS revenues are expected to reach an annual global total of $13.3 billion by 2013, up from an estimated $515 million during 2007. Acknowledging the market potential, some network operators, such as KDDI and NTT DoCoMo in Japan and E-Plus in Germany, have made LBS a core part of their strategy and are focusing on deploying accurate location technology and services as a differentiation mechanism [8]. The mobile city guide ―GUIDE‖ application for the city of Lancaster, UK, was one of the first systems to provide ‗personalized‘ information to the mobile user. Nevertheless, due to time constraints and application complexities, personalized data alerts on mobile devices could not be implemented completely. More recent projects like ―LoL@‖, a local location assistant, is a prototype of a location based UMTS data services, implementing a tourist guide for the inner city of Vienna, Austria. [9]. Some recent startups built around personalized location tracking
such as ‗Foursquare‘ and ‗Gowalla‘ provide web-based data alerts to mobile users, while other non-web platforms such as iOS, Android, Symbian are also entering the LBS data service markets worldwide providing personalized LBS data services to quite an extent [10].
In India, the Indira Gandhi National Open University (IGNOU) has launched a joint initiative with a local network provider to provide location-sensitive exam alerts, available in five regional sectors with a network of 30,000– 50,000 students [2]. The Kerala State Road Transport Corporation in India has also initiated a data service alert system which provides citizens with a list of all long distance buses, including the detailed schedule for select buses, and the contact telephone numbers of important stations via SMS [2].However, majority of these systems are very limited when it comes to providing effective ‗personalized‘ LBS data service alerts. Especially in India, there is a dearth of such players dealing with location-aware personalized data services.
3.
MODEL DESCRIPTION
The Indian market has yet to see the emergence of major providers of location sensitive personalized data services. Our paper expounds a model that strives to personalize location-aware data services for each subscribed mobile customer of a network provider specifically for the Indian market. The model makes use of an evolutionary learning model that employs a rank algorithm to personalize and prioritize the services most likely to be useful for the consumer. It is materialized through a client-side mobile application installed on the cell phone of the customer, and a server-side centralized database located at the network provider‘s facility. For each existing and new customer of a network provider, a Customer Profile (CP) is created which contains the personal information, preferred data service categories and query logs. The CP of each customer is updated timely to make it ‗customer-personalized‘ based on the location of the user, user logs, user queries, statistical analysis and a real-time adviser. An initial survey of over 350 participants across India was conducted to create the initial training dataset for our self-learning prediction module. The survey acquired various user details such as mobile brand, monthly income, age, gender, socio-economic background, preferred data services categories etc. This initial training data set was then classified based on three classifying attributes- age, gender and socio-economic background to create an initial predictor module. For simplicity we have only considered three data service categories: food, shopping, and places to visit in our model.
query for any data service category that he is interested in at any given location and time. A Relative Ranking Algorithm forms the core component of the self-learning predictor module. The algorithm ‗learns‘ by assessing the user‘s location, query logs, profile and user feedback's. Another unique aspect to our model is the concept of ‗Global preferences‘ and ‗Local preferences‘. That is, a change in preferences indicated by users of the same category has a ripple effect on the alerts received by other users of the same category.
A centralized source database holds the data of the subscribed users and their respective CP‘s. This database is maintained at the network provider‘s facility. To prevent excessive data from becoming a bottleneck while performing computations, the CP‘s are subjected to modules of prioritization, followed by summarization, thereby creating a summarized database. Other non-summarized data is pushed onto a secondary storage devise and can be retrieved easily on-demand. The mobile application at the user‘s side allows the users to fire data queries pertaining to various data service categories. These queries are logged as a part of the user‘s profile in the cell phone and are transferred to the server-side database at timely intervals.
4.
ALGORITHM
4.1
Collect Dataset
A survey of potential users should be the foremost step. Analysis of this survey not only gives an insight into the services that the users would like to use, but also helps in classifying users into groups based on various user characteristics. A training dataset is crucial to gauge the popular services for each category of users. The surveyor should especially be mindful to survey a veritable assortment of participants to ensure fair representation of all possible user classes. We have surveyed a group of 350 potential users. From the survey we deduced the following:
i. Basis of user groups/category: for the sake of simplicity, we have considered the basis of classification to be a participant‘s age, sexuality and socio-economic background. These three form the classifying attributes for our model.
ii. Thresholds for each category: 3 groups for age – youngsters, middle-aged and seniors; 3 groups as per the socio economic backgrounds – lower, middle and upper class and 2 groups as per gender – male and female
An example of the usage of the user groups is: a user can be youngster from middle-class background and of the sex male. The training dataset enables us to form classification and association rules. These factor in whilst determining a set of suitable data services for new users or a specific class of participants.
4.2
Classification and Association
The dataset distilled from the survey conducted is duly classified to attain shrewd insights into the data service preferences of each user category. The classification technique should be as accurate as possible. Although a trade-off between the accuracy (and granularity) required and the time spent in finer distillations should be weighed in advance.
We have used the Naïve-Bayesian classification technique to determine the data services preferred by various user classes. Naïve-Bayesian classification technique is based on Bayes rule of conditional probability. As compared to C4.4 and ID3,
it requires much lesser computation and is apt for our model [11]. Association rules are easy to form from the classified outputs of the Naïve-Bayesian classification.
Each data service is weighed and measured for each user group. Accordingly a weighed priority is assigned to each data service (e.g. shopping alerts) for each user category. As and when new subscribers are added, this information serves as a guideline to the preferences of the consumer.
4.3
Databases Used
The choice of database should be such that it is compatible with the legacy system and which simultaneously offers faster query retrievals and storage. All relevant data should be either associated with foreign keys or be grouped together.
We have used an open source database technology: MySQL. Its inherent features and compatibility with various technologies makes it an ideal backend storage facility.
Tables detailing each data service are maintained separately yet are easily associated using foreign keys. Another set of tables encompasses each user‘s preferences, logs, feedback etc. Maintaining these details aids in prediction of services and also personalizing the data service for each user. As users acquaint themselves with the application, the model learns and ‗familiarizes‘ itself with each user‘s preferences and accommodates itself to a more appropriate style for the user.
Another set of database tables are required to store the various user groups and their captured preferences. Care should be taken to segregate static data tables from the dynamic and real-time ones. A summarized database is created that encompasses user specific details. The table is light weight since it is requires to be passed on between various Mobile Switching Centers (MSCs) when the user travels from one location to another (e.g. Travel between cities).
4.4
Alerts
The output of the system can be achieved through Alerts or Queries. While queries are explicit and specified by the user; the alerts are predictive implicit personalized events used to intimate the user of the available location based data services. The alerts are triggered by spatial and temporal changes. For instance a user showing interest in shopping for clothes of a specific make and brand, would receive alerts during sale seasons, arrival of new stock for the particular brand, opening of a shop hosting the brand in the user‘s vicinity etc.
Similarly if the said user moves from one significant location (traced using Mobile Switching Centers-MSCs) to another MSC (for instance changing cities), the alerts will be triggered to inform the user of alternate shops that serve the user‘s choice of clothing.
The spatial and temporal aspects of the alerts ensure that the data services provided to the user do not become a nuisance.
4.5
Queries
It provides a means for the user to explicitly search the data services. The result is allowed to be location independent, enabling the user to query to a wider set of services. Queries are submitted to the system with location, genre of the data services and a string query. But the system preferences can be altered to ignore the location based query results.
accommodate any change in preferences the user is experiencing.
4.6
Feedback
Feedback provides an essential means to not only collect and address user critiques but also to gauge the efficiency of the system. Feedback allows users to view and modify the priority of the data services personalized for them, which is based on their usage of the system.
Based on the user‘s feedback various parameters of the system are revisited (esp. the User Preferences of the data services). All the feedbacks (the changes made by users in the data service priority and the feedback provided for the system) are analyzed by the system to learn. The rank algorithm is a weightage based algorithm. It gives more weightage to user‘s response than to the data evaluated after classification and association. Thus the rank algorithm is exploited to consider the uniqueness of each individual‘s taste and preferences.
5.
IMPLEMENTATION
The model uses various techniques to ensure efficient working of the system on a mobile device. The location of the user is detected using GPRS instead of GPS. The use of GPRS over GPS ensures that precious resources like the battery of the device are not drained. GPS though gives more accurate results, but is battery intensive. GPRS allows access to the nearest cell tower rather than a more precise location. Using the network id of the cell tower, the data services applicable to the vicinity can be determined. These data services are the mapped onto the user preferences for a specific user. This data is then sent to the user in the form of alerts.
When the user travels from one MSC to another, the user‘s summarized database is exchanged between the MSCs. This process is done when the user first enables the system in the new MSC. The summarized database is compact and easy to exchange between MSCs. The summarized database consists of the data services preferred by the user and the usage of the system in brief. User‘s actions in the MSC are immediately notified to the service provider‘s server. This helps track user logs and feedback, and hence provide a more accurate service.
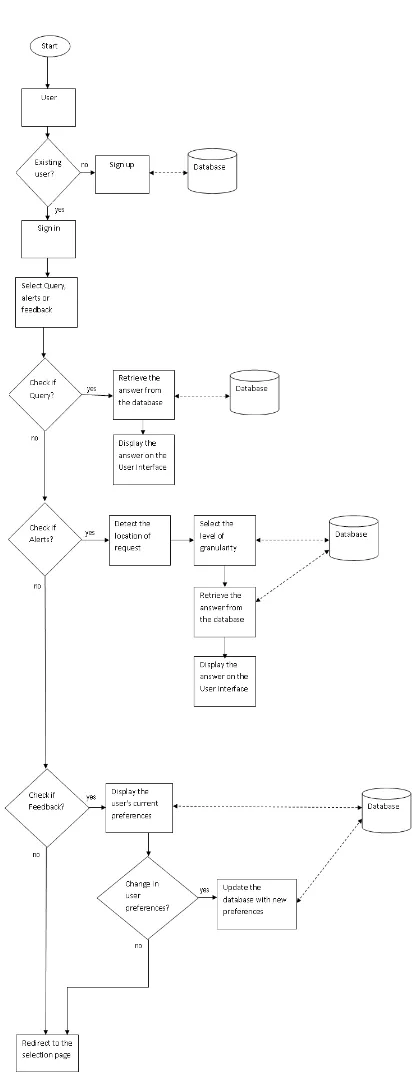
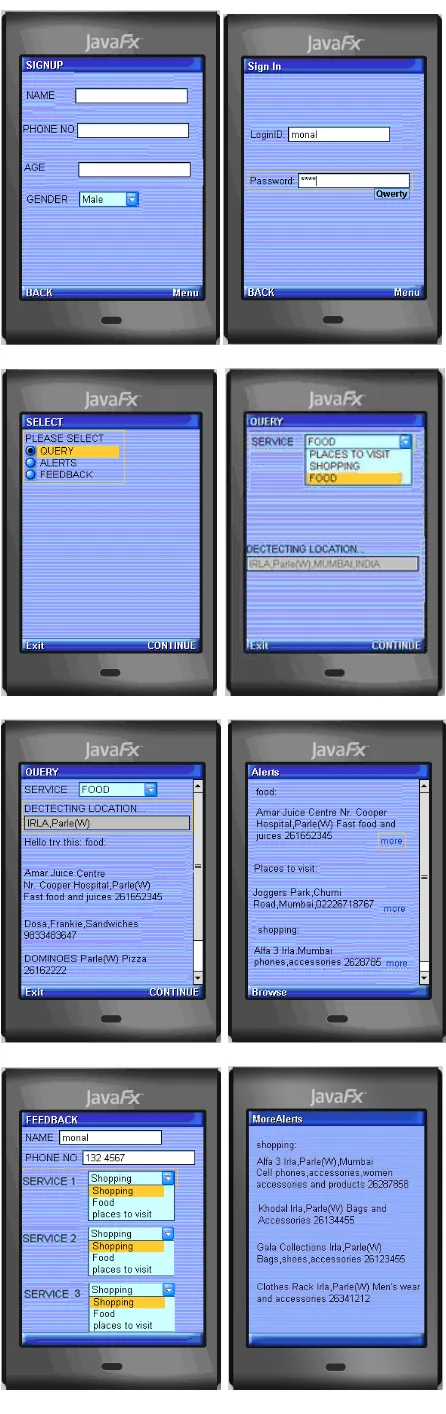
The fig 2 and fig 4 depict the system flowchart and the system block diagram in a nutshell. Fig 3 gives a brief insight into the simulation that we have developed for testing and experimentation purposes. The simulation offers a multitude of options and is apt for novice users. The GUI is kept simple and contains only the essentials necessary to gauge user‘s enthusiasm towards data services and to MVAS as an extension.
6.
EXPERIMENT RESULTS
We conducted a survey of 52 individuals across the state of Maharashtra, India to gauge the efficiency and usefulness of our model that provides personalized and location aware data alerts. We prepared a survey questionnaire with a few questions pertaining to the user experience with our mobile application. The customers who had volunteered to use our application for the duration of one week were made to fill out the questionnaire. They were told to rate various parameters on a scale of 100, every day. At the end of the week, the average of all the parameter ratings provided everyday by all the customers was deduced. Table 1 provides the comprehensive results of the survey conducted.
Table 1. Survey Questionnaire Results
Parameter Customer Satisfaction
User Friendliness 87%
Accurate Prediction of
data services 89%
Relevant data services
provided 92%
[image:4.595.332.538.206.745.2]Overall application review 85%
Source classified DB
Response Query Request Query
Enable/Disable
To other MSC’s
Mobile Application Device
Query Generator
Feedback Generator
CLIENT
(Mobile
User’s Side)
Classification &Association module
Prioritizing module
Location Analyzer module
Alert Generator
Ranking Algorithm
Feedback analyzer Survey
Summarized DB
Feedback Alerts
SERVER
(Service Provider’s Side)
User log
7.
FUTURE WORK
The breadth of the alerts is only as wide as the data regarding the services present in the server database of the network provider. The granularity of details provided by various data service providers for the same data service may vary widely. For instance restaurateur ‗A‘ may provide only the location of the restaurant but another restaurateur may provide a rate card too. Additionally the database containing various details of any particular data service is vast and thus is unlikely to be complete. This reduces the choices that could be supplied to an interested user. These additions could boost the credibility of the system as the user‘s specific queries would return relevant and more detailed choices of results.
In the future this model can be taken up by major network providers to add value to the core services that they are currently offering. As time progresses, the network service provider could also broaden the core data services provided to the user. This scale up to provide more data service categories would make the experience more surreal.
8.
CONCLUSION
Mobile Value Added Services form the modern day solution for service providers to maintain their current clientele and also attract potential customers by engendering customer satisfaction. With the cut throat competition among service providers across the globe, providing this type of services has become an inevitable necessity to prevent being wiped off from the market.
By classifying the users based on choices of the peers of the same categories and predicting their preferences further personalizes the experience of the user. The changes in the preferences of a user in turn affect those of other peers in the same category, thus facilitating social prediction. We have strived to achieve this with respect to the data services in MVAS.
9.
ACKNOWLEDGEMENTS
Our sincere gratitude to Prof. Meera Narvekar, Dwarkadas J. Sanghvi College of Engineering, University of Mumbai under whose motivation and guidance we have developed this project.
10.
REFERENCES
[1] A Joint Report by IAMAI and Analysys Mason. 2011. "Evolution of Mobile VAS in India:Imperatives for ExponentialGrowth".
Available:http://www.slideshare.net/AnalysysMason/aml -iamai-report-on-evolution-of-mobile-vas-in-india-201107
[2] Sachin Sondhi, G. G. 2011. "Mobile Value Added Services (MVAS)- A vehicle to usher in inclusive growth and bridge the digital divide".Deloitte.Available at:
https://www.deloitte.com/assets/Dcom-India/Local%20Assets/Documents/Deloitte_ASSOCHA M_MVAS_Study.pdf
[3] Balakrishnan, V. "Mobile Value Added Services in India: filling the VAS Vacuum to drive high performance". Available:
http://www.accenture.com/SiteCollectionDocuments/PD F/Accenture_Mobile_Value_Added_Services_in_India.p df
[4] Nokia. "The Demand for Mobile Value Added Services-MarketStudy".Available:
http://www.ecportal.ir/c/document_library/get_file?p_l_i d=10450&folderId=10623&name=DLFE-3410.pdf
[5] Amanda Noz, T. E. "Cashing in on Personalized Services". Available:
https://docs.google.com/viewer?a=v&q=cache:1JRTQ9
WPb3wJ:www.alcatel-lucent.com/wps/DocumentStreamerServlet%3FLMSG_C ABINET%3DDocs_and_Resource_Ctr%26LMSG_CON TENT_FILE%3DOther/Cashing_in_Personalized_Servic es_Article.pdf+&hl=en&gl=in&pid=bl&srcid=ADGEES gO6OL3VVXTxwJ9FYlRZcvJAwbBeYchyZXIUOgnev mkmSSicM5dYnhaaq0Hs_b13WXmmMeHz12WxcUiY nFWxNy_DC_7P1Tg1uT5B5MJmeT9rgBLPHVPTVgK HGtFP48ZXg80CGxh&sig=AHIEtbTqK4SC50AFmQb OhN-NP_IofWwObQ
[6] Nayot Poolsappasit, I. R. (2009). "Towards Achieving Personalized Privacy for Location-Based Services". Transaction on Data Privacy 2 , 77-99.
[7] Amit Kushwaha, V. K. (2011). "Location Based Services using Android Mobile Operating System". International Journal of Advances in Engineering & Technology(IJAET). , 14-20.
[8] Heng Xu, S. G. 2009. "Balancing User Privacy Concerns in the Adoption of Location-Based Services:An Empirical Analysis across Pull-Based and Push-Based Applications". In Proceedings of the iConference Conference at Chapel Hill.
[9] Susanne Boll, J. K. 2004. "Personalized Mobile Multimedia meets Location-Based".In Proceedings of the Annual Conference of the German Society for Informatics.
[10] Yiming Liu, E. W. 2011. "Personalized Location-Based Services". In Proceedings of the iConference Conference at Seattle.