http://dx.doi.org/10.4236/msa.2014.512089
The Study of Green Compression Strength
of a Green Sand Mould Using Statistical
Approach
Aondona Paul Ihom, Aniekan Offiong
Department of Mechanical Engineering, University of Uyo, Uyo, Nigeria Email: [email protected], [email protected]
Received 10 July 2014; revised 30 August 2014; accepted 14 September 2014
Copyright © 2014 by authors and Scientific Research Publishing Inc.
This work is licensed under the Creative Commons Attribution International License (CC BY).
http://creativecommons.org/licenses/by/4.0/
Abstract
The study of green compression strength of a green sand mould using statistical approach has been undertaken. Empirically generated data in National Metallurgical Development Centre, Jos Sand Testing Laboratory were used for the study. Coefficient of correlation, coefficients of deter-mination and coefficient of multiple deterdeter-minations were used to explain the relationship existing between the two independent variables of clay and moisture content and green compression strength, the dependent variable. The study showed that the coefficient of determination for Ys: X1 was 0.88 while the coefficient of correlation was 0.94, coefficient of determination for Ys: X2 was 0.90 while the coefficient of correlation was 0.95 and the coefficient of multiple determination was 0.72; these coefficients assisted tremendously in the study of green compression strength.A ma-thematical model was developed for the prediction of green compression strength; it was tested and proved to be a good estimation tool for estimating green compression strength values on the foundry shop floor. The study has clearly shown that statistical approach is a good tool for study-ing green compression strength of green sand moulds.
Keywords
Moulds, Statistical Approach, Study, Sands, Green Compression
1. Introduction
increases with moisture until a point is reached where further increase in moisture leads to decrease in compres-sion strength. Green comprescompres-sion strength decreases with coarse grains but increases with increase in fineness of sand grains. Green compression strength increases with increase in clay content of the green sand mould. The findings of Jain agree with several authors who also confirm the above explanation [2]-[4]. Jain [1] tried to as-sess the combined effect of grain size variation and moisture content on green compression strength of green sand mould. He said that as moisture is increased, green compression strength also increases until a point is reached where further increase leads to decrease in green compression. He noted that as moisture increases coarse grained sand moulds have higher green compression strength than fine-grained sand moulds. Jain in his work also noted that as moisture is increased angular shaped grain sand moulds lose their green compression strength more than round grained sand moulds. Green compression strength is very important in the preparation of moulds. One reason is because it determines the mouldability of a sand mixture. For a sand mixture to be mouldable it must have a green compression strength value of 1.5 psi (10.34 kPa) and above [5]. Low green compression strength in green moulds may result in defective and unsound casting [6]. This is because there will be erosion, collapse, and damage of the mould wall and this will result in defects like rat tails, sand inclusions, incomplete molten metal flow, rough surfaces etc. This explains how important this property is in mould pro-duction and is always monitored in sand casting [4]-[7].
Statistical approach of the study of this important property will give in-depth information on how to produce good moulds. This fact has been upheld by several authors [8]-[12] who argued that statistical models will pro-vide models for the quick estimation of green compression strength propro-vided the clay content and moisture con-tent is known. This will save the time used in setting up instrument for tests to determine green compression strength. They also agreed that statistical approaches will bring out clearly the nature of relationships that exists between green compression strength the dependent variable, clay content and moisture content the independent variables [8]-[12].
The objective of the work is to study green compression strength of a green sand mould using statistical ap-proach.
2. Materials and Method
2.1. Materials
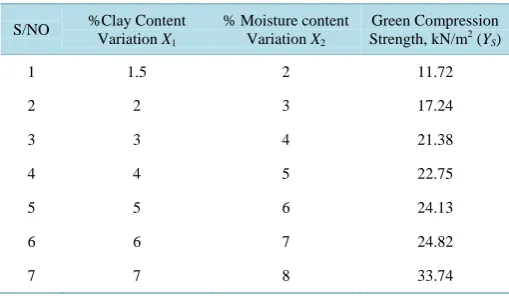
[image:2.595.184.439.569.717.2]The materials used for this work were obtained from empirically generated data on various moulding sand sys-tems at the sand testing laboratory of the National Development Centre, Jos. This particular data was generated from green compression strength tests on green moulds using Bacita foundry sand, clay binder and moisture (H2O). Universal strength testing machines, manual green compression strength tester, sand rammer, mixer, measuring cylinders were used during the work as equipment. The main variables in the work were clay (binder) which was varied from 1.5% to 7% and moisture (water) which was varied from 2% to 8%. Other variables like mixing time, number of rams, sand (grain size and shape) were all kept constant.Table 1 shows the data that was used for this study.
Table 1. Green compression strength data with variation in clay and moisture content.
S/NO %Clay Content Variation X1
% Moisture content Variation X2
Green Compression Strength, kN/m2 (Y
S)
1 1.5 2 11.72
2 2 3 17.24
3 3 4 21.38
4 4 5 22.75
5 5 6 24.13
6 6 7 24.82
2.2. Method
2.2.1. Multiple Regression Model Development
The basic two variable models (one dependent and one independent variable) is
Y= +a bx (1)
Which can be solved using the normal equations thus: Y=an b+ x
∑
∑
(2)2
XY =a X+b X
∑
∑
∑
(3)From this can be developed models with more than two variables and this is illustrated below using a 3 varia-ble model (one dependent and two independent variavaria-bles, Y, X1, and X2)
1 2
1X 2X
Y = +a b +b (4)
Which can be solved by the normal equations for a three variable model, as follows:
1 1 2 2
Y =an b+ X +b X
∑
∑
∑
(5)2
1 1 1 1 2 1 2
X Y=a X +b X +b X X
∑
∑
∑
∑
(6)2
2 2 1 1 2 2 2
X Y =a X +b X X +b X
∑
∑
∑
∑
(7)The line of best fit gives way to a plane of best fit, b1 is the slope of the plane along the X1 axis, b2 is the slope along the X2 axis and the plane cuts the Y axis at “a”. The aim of adding to the simple two variable models is to improve the fit of the data. The closeness of fit is measured by the coefficient of multiple determination R2 for which the general formula and a useful computational formula is given below
(
)
(
)
2
1 1 2 2
2
2 2
Y
a Y b X Y b X Y
[image:3.595.189.438.514.577.2]n R Y Y n + + − = −
∑
∑
∑
∑
∑
∑
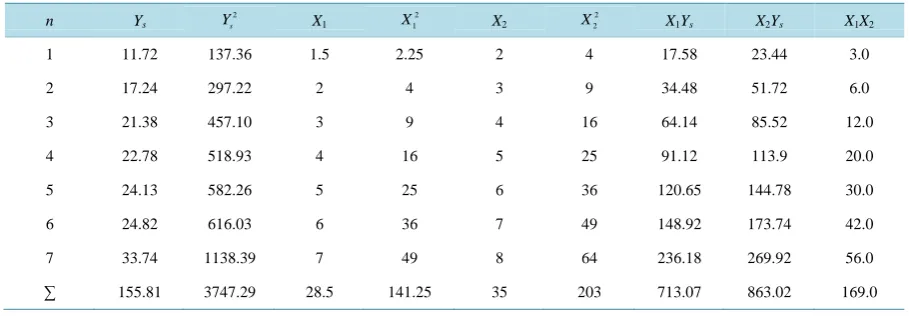
(8)Table 2gives the calculation of separate regressions with green compression strength as Ys, clay content as X1
and moisture content as X2.
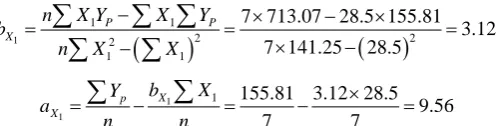
2.2.2. For Regression Ys on X1 (Clay Content %)
(
)
(
)
1 1 1 2 2 2 1 17 713.07 28.5 155.81 3.12
7 141.25 28.5
P P
X
n X Y X Y
b
n X X
− = × − × = × − = −
∑
∑ ∑
∑
∑
1 11 155.81 3.12 28.5
9.56 7 7 X p X b X Y a n n × =
∑
−∑
= − =The regression equation for the relationship of clay content and green compression strength value of the green mould is
1 1 1 1 9.56 3.12 1
X X X
Y =a +b X = + X
1 9.56 3.12 1
X
Y = + X (9)
The coefficient of correlation for this relationship is
(
)
(
)
1 1 1 2 2 2 2 1 1 P P X p pn X Y X Y
r
n X X n Y Y
− =
− × −
∑
∑ ∑
∑
∑
∑
∑
(10)Table 2. Calculation of separate regressions with green compression strength as Ys. n Ys
2 s
Y X1
2 1
X X2
2 2
X X1Ys X2Ys X1X2
1 11.72 137.36 1.5 2.25 2 4 17.58 23.44 3.0
2 17.24 297.22 2 4 3 9 34.48 51.72 6.0
3 21.38 457.10 3 9 4 16 64.14 85.52 12.0
4 22.78 518.93 4 16 5 25 91.12 113.9 20.0
5 24.13 582.26 5 25 6 36 120.65 144.78 30.0
6 24.82 616.03 6 36 7 49 148.92 173.74 42.0
7 33.74 1138.39 7 49 8 64 236.18 269.92 56.0
∑ 155.81 3747.29 28.5 141.25 35 203 713.07 863.02 169.0
1 0.94 X r = 1 2 0.88 X
r = i.e. coefficient of determination for Ys: X1.
2.2.3. For Regression of Ys on X2 (% Moisture Content)
(
)
( )
2 2 2 2 2 2 2 2 6041.14 5453.35 3 7 203 35P P
X
n X Y X Y
b
n X X
− − = = = × − −
∑
∑ ∑
∑
∑
2 22 155.81 3 35
– 7.26 7 7 X p X b X Y a n n × =
∑
−∑
= =The regression equation for the relationship of moisture content with green compression strength value of the green mould is
2 2 2 2 7.26 3 2
sX X X
Y =a +b X = + X (11)
The coefficient of correlation for this relationship is
(
)
(
)
2 2 2 2 2 2 2 2 2 587.79 0.95 618.90 P P X p pn X Y X Y
r
n X X n Y Y
− = = = − × −
∑
∑ ∑
∑
∑
∑
∑
2 2 0.90 Xr = i.e. coefficient of determination for Ys: X2.
2.2.4. The Multiple Regression (Ys: X1 and X2)
The multiple regression calculations are carried out using the three variable normal Equations (4)-(7) with subs-titution with values fromTable 2 new set of equations are derived as follows
1 2
155.81=7a+28.5b +35b (12)
1 2
713.07=28.5a+141.25b +169b (13)
1 2
863.02=35a+169b +203b (14)
Solving these three equations simultaneously gave
9.34 a= 1 3.07 b = 2 0.03 b =
Now substituting the model equation for three variables in Equation (4), this new model equation is obtained
1 2
9.34 3.07 0.03
s
This mathematical model is derived with the combined influence of clay content and moisture content all taken into account and therefore can be used to predict the green compression strength of the green sand mould. Table below shows empirical values with calculated values using the mathematical model.
2.2.5. Coefficient of Multiple Determination, R2
From Equation (9)
2 202.17
0.72 279.18
R = =
3. Results and Discussion
3.1. Results
The various coefficients of determination can now be summarized
1 2
0.88
X
r =
2 2
0.90
X
r =
2 0.72
R =
Equations (9), (11) and (15) are the developed regression models for simple and multiple linear regression re-lationships existing between green compression strength and the two variables of clay content and moisture content in the green mould.
[image:5.595.89.537.540.722.2]Table 2is the result of separate calculation of the regression with green compression strength as the depen-dent variable
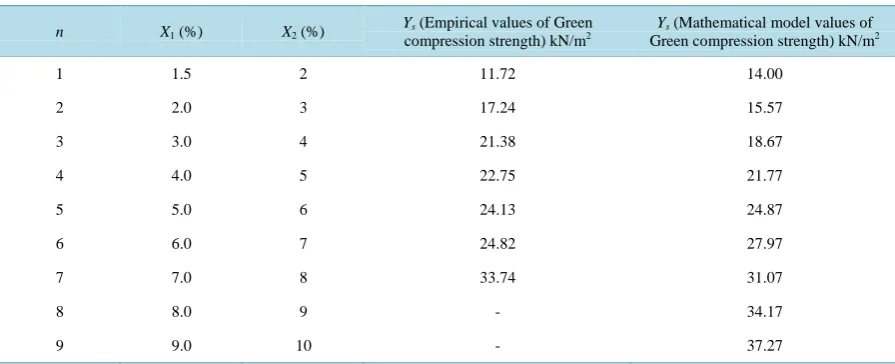
Table 3 gives the empirical values of green compression strength against mathematical model values and predicted values of green compression strength.
3.2. Discussion
The various coefficients are interpreted as follows:
1 2
X
r : this indicates that about 88% of the variation in green compression is caused by variation in clay content this is a major influence and the influence is positive which means that an increase in clay content % will bring about an increase in green compression strength.
2 2
X
r : this indicates that 90% of the variation in green compression strength is caused by variation in moisture content %; this is a major positive influence that moisture content % has on green compression strength which means as moisture content increases green compression strength also increases.
Table 3. Empirical values and mathematical model values.
n X1 (%) X2 (%)
Ys (Empirical values of Green
compression strength) kN/m2
Ys (Mathematical model values of
Green compression strength) kN/m2
1 1.5 2 11.72 14.00
2 2.0 3 17.24 15.57
3 3.0 4 21.38 18.67
4 4.0 5 22.75 21.77
5 5.0 6 24.13 24.87
6 6.0 7 24.82 27.97
7 7.0 8 33.74 31.07
8 8.0 9 - 34.17
R2: this shows the combined influence of the two variables of clay content and moisture content %. The in-fluence is a major inin-fluence and it is positive. 72% of the changes in green compression strength values in green sand mould are brought about by the combined influence of clay content % and moisture content %.
The individual correlation between clay content and green compression strength is given by the coefficient of correlation rX1 and the value is 0.94 and is a positive relationship. This means that 94% of changes in green
compression strength are caused by clay content. The individual influence on green compression strength is therefore significant. Equation (9) which is a model for predicting the green compression strength of green sand mould based on the influence of clay content only can be used assuming the only influence on green compres-sion is coming from clay content. The model will not be correct if there are other variables involved in deter-mining green compression strength. The correlation agrees completely with existing theories as clay content in-creases green compression strength also inin-creases. This explains why clay that does not have sufficient binding ability in small quantity in moulding mixtures becomes mouldable when the quantity of clay is increased. Lite-ratures reviewed for this work also support the above strong correlation between clay content and green com-pression strength [13] [14].
Moisture content has a very strong positive correlation with green compression strength of green sand moulds. The correlation is 0.95 which means that 95% of the increase in green compression strength will be caused by increase in moisture content of the moulding mixture if the moisture content is the only variable. The impor-tance of moisture is also observed practically while preparing moulds. Moulds with moisture content below op-timum do tend to be lacking in green compression strength. Literatures that have being reviewed for this work have also shown that moisture content increase do lead to increase in green compression strength until an opti-mum point is reached where further increase leads to a decrease in green compression strength [6] [13] [14].
The combined effect of clay content and moisture content as well as the influence on green compression strength has been given by the coefficient of multiple determination and interpreted above. The established rela-tionship from the coefficient of multiple determination agrees with what is obtained practically and empirically generated results both clay content and moisture content increase green compression strength of moulding mix-ture making it mouldable [6] [13] [14]. Jain has made this observation in his work [1]. Equation (15) is devel-oped based on the influence of both clay content and moisture content variation on green compression strength of green sand moulds as indicated by the coefficient of multiple determination R2. This mathematical model is derived with the combined influence of clay content and moisture content all taken into account and therefore can be used to predict the green compression strength of the green sand mould. On the strength of thisTable 3
was produced.
Table 3 gives the empirical values of green compression strength against green compression strength values calculated using the developed mathematical model. A look atTable 3 shows that the difference between the empirical values of green compression strength and the calculated green compression strength values is not so much. The table showed that green compression strength has been predicted for 8% clay content and 9% mois-ture content, and 9% clay content and 10% moismois-ture content and the result of the prediction is within a reasona-ble range as can be seen in the tareasona-ble. The results inTable 3 have shown that the developed model can be a quick method or tool for the prediction of green compression strength on the shop floor. Given the importance of this parameter the green compression strength of a moulding mixture can be estimated using the model and the in-formation can be used in predicting the mouldability of the moulding mixture. As stated earlier green compres-sion strength of 10.34 kPa and above is required for mouldability of green sand moulds [4]-[6] [14]. Statistical approach have indeed proven to be a good method for the study of green compression strength as can be seen above it had provided a step by step analysis of the relationship between green compression strength and the two variables of clay content and moisture content. Their interactive influence on green compression strength has also been studied through the use of multiple coefficient of determination R2. No wonder it had been supported by many researchers as a useful research tool [8]-[14].
4. Conclusions
The study of green compression strength of a green sand mould using statistical approach has been successfully carried out and the following conclusions are from the study:
2) The coefficients of correlation, coefficients of determination and coefficient of multiple determinations are great tools for studying the relationship between the variables (independent and dependent variables).
3) The study has shown the positive strong relationship that exists between green compression strength of the dependent variable and the two independent variables of clay content and moisture content. The study showed a coefficient of multiple determination of 0.72 which translates to 72% of the variation in green compression strength coming from the combined effect of clay content and moisture content.
4) The study developed a mathematical model which can be used for the prediction and estimation of green compression strength in green sand moulds. This clearly confirms the crucial nature of statistical approach in the study of green sand moulds.
Acknowledgements
The authors hereby extend their sincere appreciation to the staff of the Sand Testing Laboratory of NMDC Jos who assisted with the generation of this data. We also acknowledge your effort for the enormous amount of data bank that now exists in that Laboratory on Nigerian foundry sands.
References
[1] Jain, R.K. (2009) Production Technology. 16th Edition, Khana Publishers, Nai Sarak, 153-158.
[2] Ihom, A.P. (2012) Foundry Raw Materials for Sand Casting and Testing Procedures. A2P2 Transcendent Publishers, Jos, 71-92.
[3] Khanna, O.P. (2008) A Text Book of Material Science and Metallurgy. 8th Reprint, Dhanpat Rai Publications, New Delhi, 51-8-10.
[4] Ihom, A.P., Agunsoye, J., Anbua, E.E. and Bam, A. (2009) The Use of Statistical Approach for Modeling and Studying the Effect of Ramming on the Mould Parameters of Yola Natural Sand. Nigerian Journal of Engineering, 16, 186-192. [5] Brown, J.R. (1994) Foseco Foundryman’s Handbook. 10th Edition, Pergamon Press PLC,Oxford, 10-68.
[6] Heine, R.W., Loper Jr., C.R. and Rosenthal, P.C. (1967) Principles of Metal Casting. 2nd Edition, Tata Mcgraw-Hill Publishing Company Ltd, New Delhi, 100-150.
[7] Zrimsek, A.H. and Vingas, G.J. (1961) Effect of Moulding Variables Parameters on the Properties of Clay Bonded Sands. Modern Casting, 39, 85.
[8] Lucey, T. (2000) Quantitative Techniques. 7th Edition, Low Priced Edition Funded by the British Government, 99- 150.
[9] Chakoraborty, M. and Dhindaw, B.K. (1979) Utilization of Regression Equations in Optimization of Properties of Clay Bonded Sands. Proceedings of the 41st International Foundry Congress, Liege, 8.
[10] Chakoraborty, M. and Dhindaw, B.K. (1985) Application of the Statistical Design of Experiments in the Study of Clay-bonded Sand Mixtures, the British Foundryman. Journal of the Institute of the British Foundrymen, 114-118. [11] Ihom, A.P., Yaro, S.A. and Aigbodion, V.S. (2006) Application of Multiple Regression-Model to the Study of Foundry
Clay-Bonded Sand Mixtures. JICCOTECH, 2, 161-168.
[12] Eckey, D.C. and Goldress, J.E. (1989) The Design of Experiments in the Sand Casting Foundry. Transactions of the American Foundryman Society, 62, 605.
[13] Ihom, A.P., Agunsoye, J, Anbua, E.E. and Ogbodo, J. (2011) Effect of Moisture Content on the Foundry Properties of Yola Natural Sand. Leonardo Electronic Journal of Practices and Technologies, 19, 85-96.