Munich Personal RePEc Archive
Estimation in semiparametric spatial
regression
Gao, Jiti and Lu, Zudi and Tjostheim, Dag
The University of Western Australia, Curtin University, The
University of Bergen
May 2003
Online at
https://mpra.ub.uni-muenchen.de/11971/
Jiti Gao
School of Mathematics and Statistics
The University of Western Australia, Crawley WA 6009, Australia∗
Zudi Lu
Institute of Systems Science, Academy of Mathematics and Systems Sciences, Chinese Academy of Sciences, Beijing 100080, P. R. China, and
Department of Statistics, London School of Economics, WC2A 2AE, U.K.†
Dag Tjøstheim Department of Mathematics
The University of Bergen, Bergen 5007, Norway‡
Abstract. Nonparametric methods have been very popular in the last couple of decades in time series and regression, but no such development has taken place for spatial models. A
rather obvious reason for this is the curse of dimensionality. For spatial data on a grid evaluat-ing the conditional mean given its closest neighbours requires a four-dimensional nonparametric regression. In this paper, a semiparametric spatial regression approach is proposed to avoid this
problem. An estimation procedure based on combining the so–called marginal integration tech-nique with local linear kernel estimation is developed in the semiparametric spatial regression setting. Asymptotic distributions are established under some mild conditions. The same
con-vergence rates as in the one-dimensional regression case are established. An application of the methodology to the classical Mercer wheat data set is given and indicates that one directional
component appears to be nonlinear, which has gone unnoticed in earlier analyses.
∗We would like to thank the Editors, the Associate Editor and the referees for their constructive comments
and suggestions. Research of the authors was supported by an Australian Research Council Discovery Grant, and
the second author was also supported by the National Natural Science Foundation of China and a Leverhulme Trust research grant.
1991Mathematics Subject Classification. Primary: 62G05; Secondary: 60J25, 62J02.
Key words and phrases. Additive approximation, asymptotic theory, conditional autoregression, local linear
kernel estimate, marginal integration, semiparametric regression, spatial mixing process.
∗Jiti Gao is from School of Mathematics and Statistics, The University of Western Australia, Perth, Australia.
Email: [email protected]
†Zudi Lu currently works at The London School of Economics. E-mail: [email protected]
‡Dag Tjøstheim is from Department of Mathematics, The University of Bergen, Norway. Email:
1. Introduction
Data collected at spatial sites occur in many scientific disciplines such as econometrics, envir-onmental science, epidemiology, image analysis, and oceanography. Often the sites are irregu-larly positioned, but with the increasing use of computer technology data on a regular grid and measured on a continuous scale are becoming more and more common. This is the kind of data that we will be considering in this paper.
In the statistical analysis of such data almost exclusively the emphasis has been on parametric modelling. So–called joint models were introduced in the papers by Whittle (1954, 1963), but after the ground breaking paper by Besag (1974) the literature has been dominated by conditional models, in particular with the use of Markov fields and Markov chain Monte Carlo techniques. Another large branch of literature, mainly on irregularly positioned data, though, is concerned with the various methods of kriging which again in the main is based on parametric asumptions; see e.g. Cressie (1993, chapters 2–5).
In time series and regression, nonparametric methods have been very popular both for predic-tion and characterizing nonlinear dependence. No such development has taken place for spatial lattice models. Since the data are already on a grid, unless there are missing data, the prediction issue is less relevant, but there is still a need to explore and characterize nonlinear dependence relations. A rather obvious reason for the lack of progress is the curse of of dimensionality. For a time series{Yt}, a nonparametric regressionE[Yt|Yt−1=y] ofYton its immediate predecessor
is one–dimensional, and the corresponding Nadaraya–Watson (NW) estimator has good stat-istical properties. For spatial data {Yij} on a grid, however, the conditional mean ofYij given
its closest neighborsYi−1,j,Yi,j−1,Yi+1,j, andYi,j+1 involves a four–dimensional nonparametric
regression. Formally this can be carried out using the NW estimator, and an asymptotic theory can be constructed. In practice, however, this can not be recommended unless the number of data points is extremely large.
In spite of these difficulties there has been some recent theoretical work in this area. Ker-nel and nearest neighbor density estimates have been analysed by Tran (1990) and Tran and Yakowitz (1993) under spatial mixing conditions. Clearly, in the marginal density estimation case, the curse of dimensionality is not an obstacle. TheL1 theory was established by Carbon,
2004), Hallin, Lu and Tran (2004b), and others. We have found these papers useful in developing our theory, but our perspective is rather different.
There are several ways of circumventing the curse of dimensionality in non–spatial regression. Perhaps the two most commonly used are semiparametric models, which in this context will be taken to mean partially linear models, and additive models. Actually, Cressie (1993, p. 283) points out the possibility of trying such models for spatial data noting that the nonlinear krige technique called disjunctive kriging (cf. Rivoirard 1994) takes as its starting point an additive decomposition. The problem, as seen from a traditional Markov field point of view, is that additivity clashes with the spatial Markov assumption. This is very different from the time series case where the partial linear autoregressive model (see Gao 1998)
Yt=βYt−1+g(Yt−2) +et
is a Markov model of second order if {et} consists of independent and identically distributed
(iid) random errors independent of{Yt−s, s >0}.
In the spatial case, so far we have not been able to construct nonlinear additive or semi-parametric models which are at the same time Markov. The problem can be illustrated by considering the line process {Yi}. Assuming {Yi} to be Markov on the line and conditional
Gaussian with density
p(yi|yi−1, yi+1) =
1
√
2πσe
−(yi−g(yi−1)−h(yi+1))
2
2σ2 ,
it is easily seen using formulae (2.2) and (3.3) of Besag (1974) that the Markov field property implies g(y)≡h(y)≡ay+bfor two constants aand b. The same holds for the corresponding model on the two–dimensional lattice.
In ordinary regression, semiparametric and additive fitting can be thought of as an ap-proximation of conditional quantities such as E[Yt|Yt−1, . . . , Yt−k], and sometimes (Sperlich,
Tjøstheim and Yang 2002) interaction terms are included to improve this approximation. The approximation interpretation continues to be valid in the spatial case, so that semiparamet-ric and additive models can be viewed as approximations to conditional expressions such as E[Yij|Yi−1,j, Yi,j−1, Yi+1,j, Yi,j+1]. The conditional spirit of Besag (1974) is retained, being in
terms of conditional means, however, rather than conditional probabilities. (Note that also in nonlinear time series dependence is described by taking the conditional mean as a starting point; see in particular the contributions by Bjerve and Doksum 1993 and Jones and Koch 2003). The conditional meanE[Yij|Yi−1,j, Yi,j−1, Yi+1,j, Yi,j+1], say, is meaningful if first order moments
model, that can be exactly represented by this approximation. In this respect the situation is the same as for nonlinear disjunctive kriging, where the conditional mean of Yij at a certain
location is sought approximated by an additive decomposition going over all of the remaining observations (cf. Cressie 1993, p. 279). Classes of lattice models where there does exist an exact representation is the class of auto-Gaussian models (cf. Besag 1974) or unilateral one-quadrant representations where Yij is represented additively in terms of sayYi−1,j, Yi,j−1 only and an
in-dependent residual term (cf. Lu. et al2005). But the former is linear, and the latter a “causal” unilateral expansion which may not be too realistic. In general, in the nonlinear spatial case one must live with the approximative aspect. In practical time series modeling this is also the case, but in that situation at least one is able to write up a fairly general and exact model, where Y can be expressed as an additive function of past values and an independent residual term. Fortunately, as will be seen, the asymptotic theory does not require the existence of such a representation.
The purpose of this paper is then to develop estimators for a spatial semiparametric (par-tially linear) structure and to derive their asymptotic properties. In the companion paper by Lu, et al (2005), the additive approximation is analyzed using a different set–up and differ-ent techniques of estimation. An advantage of using the partially linear approach is that a priori information concerning possible linearity of some of the components can be included in the model. More specifically, we will look at approximating the conditional mean function m(Xij, Zij) =E(Yij|Xij, Zij) by a semiparametric (partially linear) function of the form
(1.1) m0(Xij, Zij) =µ+Zijτβ+g(Xij)
such that E[Yij −m0(Xij, Zij)]2 or equivalently E[m(Xij, Zij)−m0(Xij, Zij)]2 is minimized
over a class of semiparametric functions of the form m0(Xij, Zij) subject toE[g(Xij)] = 0 for
the identifiability of m0(Xij, Zij), where µ is an unknown parameter, β = (β1, . . . , βq)τ is a
vector of unknown parameters,g(·) is an unknown function overRp,Zij = (Zij(1), . . . , Zij(q))τ and
Xij = (Xij(1), . . . , X (p)
ij )τ may contain both exogenous and endogenous variables; i.e. neighboring
values ofYij. Moreover, a componentZij(r)ofZijor a componentXij(s)ofXij may itself be a linear
combination of neighbouring values ofYij, as will be seen in section 4, whereZij(1) =Yi−1,j+Yi+1,j
and Xij(1) =Yi,j−1+Yi,j+1.
Motivation for using the form (1.1) for non–spatial data analysis can be found in H¨ardle, Liang and Gao (2000). As for the non–spatial case, estimating g(·) in model (1.1) may suffer from the curse of dimensionality wheng(·) is not necessarily additive andp≥3. Thus, we will propose approximating g(·) by ga(·), an additive marginal integration projector as detailed in
be written as
(1.2) m0(Xij, Zij) =µ+Zijτβ+ p
X
l=1
gl(Xij(l))
subject toEhgl(Xij(l))
i
= 0 for all 1≤l≤pfor the identifiability ofm0(Xij, Zij) in (1.2), where
gl(·),l= 1,· · ·, p are all unknown one–dimensional functions overR1.
Our method of estimatingg(·) orga(·) is based on an additive marginal integration projection
on the set of additive functions, but where unlike the backfitting case, the projection is taken with the product measure ofXij(l) forl= 1,· · · , p(cf. Nielsen and Linton 1998). This contrasts with the smoothed backfitting approach of Lu,et al(2005), who base their work on an extension of the techniques of Mammen, Linton and Nelson (1999) to the nonparametric spatial regression case. Marginal integration, although inferior to backfitting in asymptotic efficiency for purely additive models, seems well suited to the framework of partially linear estimation. In fact, in previous work (cf. Fan, H¨ardle and Mammen 1998) in the independent regression case marginal integration has been used, and we do not know of any work extending the backfitting theory to the partially linear case. Marginal integration techniques are also applicable to the case where interactions are allowed between the theXij(k)–variables (cf. also the use of marginal integration for estimating interactions in ordinary regression problems).
We believe that our approach to analysing spatial data is flexible. It permits nonlinearity and non–Gaussianity of real data. For example, re-analysing the classical Mercer and Hall (1911) wheat data set, one directional component appears to be nonlinear, and the fit is improved relatively to earlier fits, that have been linear. The presence of spatial dependence creates a host of new problems and in particular it has important effects on the estimation of the parametric component with asymptotic formulae different from the time series case.
The organization of the paper is as follows. Section 2 develops the kernel based marginal integration estimation procedure for the forms (1.1) and (1.2). Asymptotic properties of the proposed procedures are given in Section 3. Section 4 discusses an application of the proposed procedures to the Mercer and Hall data. A short conclusion is given in Section 5. Mathematical details are relegated to the Appendix.
2. Notation and Definition of Estimators
As mentioned after (1.1), we are approximating the conditional mean functionm(Xij, Zij) =
E[Yij|Xij, Zij] by minimizing
over a class of semiparametric functions of the form m0(Xij, Zij) = µ+Zijτβ +g(Xij) with
E[g(Xij)] = 0. Such a minimization problem is equivalent to minimizing
EYij −µ−Zijτβ−g(Xij)
2
=EhEn Yij−µ−Zijτβ−g(Xij)
2
|Xij
oi
over some (µ, β, g). This implies thatg(Xij) =E
h
(Yij −µ−Zijτβ)|Xij
i
,µ=E[Yij−Zijτβ] and
β is given by
β = (E[(Zij −E[Zij|Xij]) (Zij−E[Zij|Xij])τ])−1E[(Zij −E[Zij|Xij]) (Yij−E[Yij|Xij])]
provided that the inverse exists. This also shows that m0(Xij, Zij) is identifiable under the
assumption ofE[g(Xij)] = 0.
We now turn to estimation assuming that the data are available for (Yij, Xij, Zij) for 1≤i≤
m,1 ≤j≤n. Since nonparametric estimation is not much used for lattice data, and since the definitions of the estimators to be used later are quite involved notationally, we start by outlining the main steps in establishing estimators forµ,β and g(·) in (1.1) and thengl(·), l= 1,2,· · · , p
in (1.2). In the following, we give our outline in three steps.
Step 1: Estimating µand g(·) assuming β to be known.
For each fixed β, since µ = E[Yij]−E[Zijτβ] = µY −µτZβ, µ can be estimated by ˆµ(β) =
Y −Zτβ, where µY = E[Yij], µZ = (µ(1)Z ,· · ·, µ(q)Z )τ = E[Zij], Y = mn1 Pmi=1Pnj=1Yij and
Z = mn1 Pmi=1Pnj=1Zij.
Moreover, the conditional expectation
g(x) =g(x, β) = E(Yij−µ−Zijτβ)|Xij =x
= E[(Yij−E[Yij]−(Zij−E[Zij])τβ)|Xij =x]
can be estimated by standard local linear estimation (cf. Fan and Gijbels 1996, p.19) with ˆ
gm,n(x, β) = ˆa0(β) satisfying
(2.1) (ˆa0(β),ˆa1(β)) = arg min (a0, a1)∈R1×Rp
m
X
i=1 n
X
j=1
˜
Yij −Z˜ijτβ−a0−aτ1(Xij −x)
2
Kij(x, b),
where ˜Yij =Yij−Y and ˜Zij = ( ˜Zij(1),· · ·,Z˜ (q)
ij )τ =Zij−Z.
Step 2: Marginal integration to obtain g1,· · ·, gp of (1.2).
The idea of the marginal integration estimator is best explained ifg(·) is itself additive, that is, if
g(Xij) =g(Xij(1),· · ·, Xij(p)) = p
X
l=1
Then, sinceEhgl
Xij(l)i= 0 forl= 1,· · · , p, for kfixed
gk(xk) =E
h
g(Xij(1),· · · , xk,· · · , Xij(p))
i
and an estimate ofgk is obtained by keeping Xij(k) fixed at xk and then taking the average over
the remaining variablesXij(1),· · · , Xij(k−1), Xij(k+1),· · ·, Xij(p). This marginal integration operation can be implemented irrespective of whether or not g(·) is additive. If the additivity does not hold, as mentioned in the introduction, the marginal integration amounts to a projection on the space of additive functions of Xij(l), l = 1,· · ·, p taken with respect to the product measure of Xij(l), l = 1,· · · , p, obtaining the approximationga(x, β) = Ppl=1Pl,ω(Xij(l), β), which will be
detailed below with β appearing linearly in the expression. In addition, it has been found con-venient to introduce a pair of weight functions (wk, w(−k)) in the estimation of each component,
hence the indexw inPl,w. The details are given in equations (2.7)–(2.9) below. Step 3: Estimating β.
The last step consists in estimatingβ. This is done by weighted least squares, and it is easy sinceβ enters linearly in our expressions. In fact, using the expression of g(x, β) in Step 1, one obtains the weighted least squares estimator ˆβ ofβ in (2.10) below. Finally, this is re–introduced in the expressions for ˆµ and ˆP resulting in the estimates in (2.11) and (2.12) below.
In the following, steps 1–3 are written correspondingly in more detail.
Step 1: To write our expression for (ˆa0(β),aˆ1(β)) in (2.1), we need to introduce some more
notation. Let Kij = Kij(x, b) = Qpl=1K
Xij(l)−xl
bl
, with b = bm,n = (b1,· · · , bp), bl = bl,m,n
being a sequence of bandwidths for the l-th covariate variable Xij(l), tending to zero as (m, n) tends to infinity, and K(·) is a bounded kernel function on R1 (when we do the asymptotic analysis in Section 3, we need to introduce a more refined choice of bandwidths, as is explained just before stating Assumption 3.6). Denote by
Xij =Xij(x, b) =
(Xij(1)−x1)
b1
,· · ·, (X
(p) ij −xp)
bp
!τ
,
and letbπ =Qpl=1bl. We define
(2.2) um,n,l1l2 = (mnbπ)−
1 m
X
i=1 n
X
j=1
(Xij(x, b))l1 (Xij(x, b))l2 Kij(x, b), l1, l2 = 0,1, . . . , p,
where (Xij(x, b))l = (Xij(l)−xl)/bl for 1≤l≤p. In addition, we let (Xij(x, b))0 ≡1. Finally, we
define
(2.3) vm,n,l(β) = (mnbπ)−1 m
X
i=1 n
X
j=1
˜
Yij−Z˜ijτβ
and where, as before ˜Yij =Yij −Y¯ and ˜Zij =Zij−Z¯.
Note thatvm,n,l(β) can be decomposed as
(2.4) vm,n,l(β) =vm,n,l(0) − q
X
s=1
βsvm,n,l(s) , forl= 0,1,· · · , p,
in which v(0)m,n,l=vm,n,l(0) (x, b) = (mnbπ)−1 Pmi=1
Pn
j=1Y˜ij (Xij(x, b))l Kij(x, b),
vm,n,l(s) =vm,n,l(s) (x, b) = (mnbπ)−1 m
X
i=1 n
X
j=1
˜
Zij(s) (Xij(x, b))l Kij(x, b), 1≤s≤q.
We can then express the local linear estimates in (2.1) as
(2.5) (ˆa0(β),ˆa1(β)⊙b)τ =Um,n−1 Vm,n(β),
where ⊙ is the operation of the component-wise product, i.e. a1⊙b = (a11b1,· · · , a1pbp) for
a1 = (a11,· · · , a1p) and b= (b1,· · · , bp),
(2.6) Vm,n(β) =
vm,n,0(β)
Vm,n,1(β)
, Um,n =
um,n,00 Um,n,01
Um,n,10 Um,n,11
,
where Um,n,10 = Um,n,01τ = (um,n,01,· · ·, um,n,0p)τ and Um,n,11 is the p×p matrix defined by
um,n,l1 l2 withl1, l2 = 1,· · ·, p, in (2.2). Moreover,Vm,n,1(β) = (vm,n,1(β), . . . , vm,n,p(β))τ with
vm,n,l(β) as defined in (2.3). Analogously for Vm,n, we may define Vm,n(0) and Vm,n(s) in terms of
v(0)m,n and vm,n(s) . Then taking the first component with γ = (1,0,· · ·,0)τ ∈R1+p,
ˆ
gm,n(x, β) =γτUm,n−1(x)Vm,n(x, β) =γτUm,n−1 (x)Vm,n(0)(x)− q
X
s=1
βsγτUm,n−1 (x)Vm,n(s)(x)
=Hm,n(0) (x)−βτHm,n(x),
where Hm,n(x) = (Hm,n(1) (x),· · ·, Hm,n(q) (x))τ with Hm,n(s) (x) = γτUm,n−1(x)V (s)
m,n(x), 1 ≤ s ≤ q.
Clearly,Hm,n(s) (x) is the local linear estimator ofH(s)(x) =E
h
Zij(s)−µ(s)Z |Xij =x
i
, 1≤s≤q.
We now define Zij(0) = Yij and µ(0)Z = µY such that H(0)(x) = E[(Zij(0) −µ
(0)
Z )|Xij = x] =
E[Yij −µY|Xij =x] and H(x) = (H(1)(x),· · · , H(q)(x))τ = E[(Zij−µZ)|Xij = x]. It follows that
g(x, β) = H(0)(x)−βτH(x), which equals g(x) under (1.1) irrespective of whether g itself is additive.
Step 2: Let w(−k)(·) be a weight function defined on Rp−1 such that Ehw(−k)(Xij(−k))i= 1, and wk(xk) =I[−Lk,Lk](xk) defined on R
1 for some largeL
k>0, with
whereIA(x) is the conventional indicator function.
For a givenβ, consider the marginal projection
(2.7) Pk,w(xk, β) =E
h
g(Xij(1),· · · , Xij(k−1), xk, Xij(k+1),· · · , X (p)
ij , β)w(−k)(Xij(−k))
i
wk(xk).
It is easily seen that ifgis additive as in (1.2), then for−Lk≤xk≤Lk,Pk,w(xk, β) =gk(xk)
up to a constant since it is assumed that Ehw(−k)(Xij(−k))
i
= 1. In general, ga(x, β) =
Pp
l=1Pl,w(xl, β) is an additive marginal projection approximation tog(x) in (1.1) up to a
con-stant in the region x ∈ Qpl=1[−Ll, Ll]. The quantity Pk,w(xk, β) can then be estimated by the
spatial locally linear marginal integration estimator
(2.8)
b
Pk,w(xk, β) = (mn)−1 m
X
i=1
n
X
j=1
ˆ gm,n(X
(1)
ij ,· · · , X
(k−1)
ij , xk, X
(k+1)
ij ,· · ·, X
(p)
ij , β)w(−k)(X (−k)
ij )wk(xk)
= ˆPk,w(0)(xk)− q
X
s=1
βsPˆk,w(s)(xk) = ˆPk,w(0)(xk)−βτPˆk,wZ (xk),
where
ˆ
Pk,w(s)(xk) =
1 mn
m
X
i=1 n
X
j=1
Hm,n(s) (Xij(1),· · ·, Xij(k−1), xk, Xij(k+1),· · ·, X (p)
ij )w(−k)(Xij(−k))wk(xk)
is the estimator of
Pk,w(s)(xk) =E
h
H(s)(Xij(1),· · · , Xij(k−1), xk, Xij(k+1),· · · , X (p)
ij )w(−k)(Xij(−k))
i
wk(xk)
for 0≤s≤q andPZ
k,w(xk) = (Pk,w(1)(xk),· · · , Pk,w(q)(xk))τ is estimated by
ˆ
Pk,wZ (xk) = ( ˆPk,w(1)(xk),· · ·,Pˆk,w(q)(xk))τ.
Here, we add the weight function wk(xk) = I[−Lk, Lk](xk) in the definition of ˆP
(s)
k,w(xk), since
we are only interested in the points of xk ∈ [−Lk, Lk] for some large Lk. In practice, we
may use a sample centered version of ˆPk,w(s)(xk) as the estimator of Pk,w(s)(xk). Clearly, we have
Pk,w(xk, β) =Pk,w(0)(xk)−βτPk,wZ (xk). Thus, for every β, g(x) = g(x, β) of (1.1) (or rather the
approximationga(x, β) if (1.2) does not hold) can be estimated by
(2.9) bbg(x, β) =
p
X
l=1
b
Pl,w(xl, β) = p
X
l=1
ˆ
Pl,w(0)(xl)−βτ p
X
l=1
ˆ Pl,wZ (xl).
Step 3; We can finally obtain the least squares estimator of β by
(2.10) βˆ= arg min
β∈Rq
m
X
i=1 n
X
j=1
˜
Yij−Z˜ijτβ−bbg(Xij, β)
2
= arg min
β∈Rq
m
X
i=1 n
X
j=1
ˆ
where ˆYij∗ = ˜Yij−Pl=1p Pˆl,w(0)(Xij(l)) and Zbij∗ = ˜Zij−Ppl=1Pˆl,wZ (Xij(l)). Therefore,
(2.11) βˆ=
m
X
i=1 n
X
j=1
b
Zij∗(Zbij∗)τ
−1
m
X
i=1 n
X
j=1
ˆ Yij∗Zbij∗
and
(2.12) µˆ =Y −βˆτZ.
We then insert ˆβ in ˆa0(β) = ˆgm,n(x, β) to obtain ˆa0( ˆβ) = ˆgm,n(x,βˆ). In view of this, the
spatial local linear projection estimator ofPk(xk) can be defined by
(2.13) bb
Pk,w(xk) = (mn)−1 m
X
i=1 n
X
j=1
ˆ
gm,n(Xij(1),· · · , Xij(k−1), xk, Xij(k+1),· · ·, X (p)
ij ; ˆβ)w(−k)(Xij(−k))
and forxk∈[−Lk, Lk] this would estimategk(xk) up to a constant when (1.2) holds. To ensure
E[gk(Xij(k))] = 0, we may rewrite Pbbk,w(xk)−µˆP(k) for the estimate of gk(xk) in (1.2), where
ˆ
µP(k) = mn1 Pmi=1
Pn
j=1Pbbk,w(Xij(k)).
For the least squares estimator, ˆβ, and Pbbk,w(·), we establish some asymptotic distributions
under mild conditions in Section 3 below.
3. Asymptotic properties
LetIm,n be the rectangular region defined by Im,n ={(i, j) : i, j∈Z2, 1≤i≤m, 1≤j≤
n}. We observe{(Yij, Xij, Zij)} onIm,n with a sample size ofmn.
In this paper, we write (m, n)→ ∞ if
(3.1) min{m, n} → ∞.
In Tran 1990, it is required in addition that mand n tend to infinity at the same rate:
(3.2) C1 <|m/n|< C2 for some 0< C1< C2 <∞.
Let {(Yij, Xij, Zij)} be a strictly stationary random field indexed by (i, j) ∈ Z2. A point
(i, j) in Z2 is referred to as a site. Let S and S′ be two sets of sites. The Borel fields B(S) =
B(Yij, Xij, Zij,(i, j) ∈ S) and B(S′) = B(Yij, Xij, Zij,(i, j) ∈ S′) are the σ-fields generated
by the random variables (Yij, Xij, Zij) with (i, j) being elements of S and S′, respectively. We
will assume that the variables (Yij, Xij, Zij) satisfy the following mixing condition (c.f., Tran,
1990): There exists a functionϕ(t)↓0 as t→ ∞, such that wheneverS,S′ ⊂Z2,
(3.3) α(B(S),B(S
′)) = sup
{A∈B(S),B∈B(S′)}{|P(AB)−P(A)P(B)|}
where Card(S) denotes the cardinality of S, and ˜dis the distance defined by
˜
d(S, S′) = min{p|i−i′|2+|j−j′|2 : (i, j)∈S,(i′, j′)∈S′}.
Here ˜f is a symmetric positive function nondecreasing in each variable. Throughout the paper, we only assume that ˜f satisfies
(3.4) f˜(n, m)≤min{m, n}.
If ˜f ≡1, then the spatial process{(Yij, Xij, Zij)} is called strongly mixing.
Condition (3.4) has been used by Neaderhouser (1980) and Takahata (1983), respectively. It is a special case of the conditions used by Napahetian (1987) and Lin and Lu (1996). Condition (3.4) holds in many cases. Examples can be found in Neaderhouser (1980) and Rosenblatt (1985). For relevant work on random fields, see e.g., Neaderhouser (1980), Bolthausen (1982), Guyon and Richardson (1984), Possolo (1991), Guyon (1995), Winkler (1995), Lin and Lu (1996), Wackernagel (1998), Chiles and Delfiner (1999), and Stein (1999).
To state and prove our main results, we need to introduce the following assumptions.
Assumption 3.1. Assume that the process {(Yij, Xij, Zij) : (i, j) ∈ Z2} is strictly stationary.
The joint probability densityfs(x1,· · · , xs) of (Xi1j1,· · · , Xisjs) exists and is bounded fors= 1,· · · ,2r−1, where r is some positive integer such that Assumption 3.2(ii) below holds. For s= 1, we writef(x) for f1(x1), the density function ofXij.
Assumption 3.2. (i) Let Zij∗ = Zij −µZ −Ppl=1Pl,wZ (Xij(l)) and BZZ = E[Z11∗ (Z11∗ )τ]. The
inverse matrix ofBZZ exists. LetY∗
ij =Yij−µY −Ppl=1Pl,w(0)(Xij(l)) andRij =Zij∗
Y∗
ij−Zij∗τβ
. Assume that the matrix ΣB =P∞i=−∞P∞j=−∞E[(R00−µB)(Rij −µB)τ] is finite.
(ii) Let r be as defined in Assumption 3.1. Assume that there is some λ > 2 such that E|Yij|λr
<∞.
Assumption3.3. The mixing coefficient ϕdefined in (3.3) satisfies
(3.5) lim
T→∞T aX∞
t=T
t2r−1ϕ(t)λrλr−2 = 0
for some constant a > max2(rλ+2)λr ,2+λr2r(λr−−4r2) with λ > 4− 2r as in Assumption 3.2(ii). In
addition, the coefficient function ˜f involved in (3.3) satisfies (3.4).
Assumption3.4. (i) The functions g(·) in (1.1) and gl(·) for 1≤l≤p in (1.2) have bounded
and continuous derivatives up to order 2. In addition, the function g(·) has a second–order derivative matrixg′′(·) (of dimensionp×p), which is uniformly continuous onRp.
(ii) For each k, 1 ≤ k ≤ p, the weight function {w(−k)(·)} is uniformly continuous on Rp−1
and bounded on the compact support Sw(−k) of w(−k)(·). In addition, E
h
Let SW = SW,k = Sw(−k) ×[−Lk, Lk] be the compact support of W(x) = W(x(−k), xk) =
w(−k) x(−k)·I[−Lk,Lk](xk). In addition, let infx∈SW f(x)>0 hold.
Assumption3.5. The functionK(x) is a symmetric and bounded probability density function on R1 with compact support, C
K, and finite variance such that|K(x)−K(y)| ≤M|x−y|for
x, y∈CK and 0< M <∞.
When we are estimating the marginal projector Pk, the bandwidth bk associated with this
component has to tend to zero at a rate slower than bl for l 6= k. This means that for each
k, 1 ≤ k ≤ p, we need a separate set of bandwidths b(k)1 ,· · · , b(k)p such that b(k)k tends to zero
slower than b(k)l for all l 6= k. Correspondingly, we get p different products b(k)π = Qpl=1b(k)l .
Since in the following we will analyse one component ˆPk at a time, to simplify notation we omit
the superscript (k) and write bk, bl, l6=k and bπ instead of b(k)k ,b(k)l , l 6=k and b(k)π . It will be
seen that this slight abuse of notation does not lead to interpretational difficulties in the proofs. To have consistency in notation, Assumptions 3.6 and 3.6’ below are also formulated using this notational simplification. Throughout the whole paper, we use l as any arbitrary index while leavingk for the fixed and specified index as suggested by a referee.
Assumption3.6. (i) Let bπ be as defined before. The bandwidths satisfy
lim
(m,n)→∞max1≤l≤pbl= 0, (m,n)lim→∞mnb 1+2/r
π =∞, lim inf
(m,n)→∞mnb
2(r−1)a+2(λr−2) (a+2)λ
π >0
for some integerr≥3 and someλ >2 being the same as in Assumptions 3.1 and 3.2. (ii) In addition, for thek−th component
lim sup
(m,n)→∞
mnb5k<∞, lim
(m,n)→∞
max1≤l6=k≤pbl
bk
= 0, lim
(m,n)→∞mnb
4(2+r) 2r−1
k =∞
for some integerr≥3.
(ii) As for the non–spatial case (see Condition A of Fan, H¨ardle and Mammen 1998), some technical conditions are needed when marginal integration techniques are employed. In addition, some other technical conditions are required for the spatial case. Condition (3.5) requires some kind of rate of convergence for the mixing coefficient. It holds automatically when the mixing coefficient decreases to zero exponentially. For the non–spatial case, similar conditions have been used. See for example, Condition A(vi) of Fan, H¨ardle and Mammen (1998). For the spatial case, Assumption 3.6 requires that when one of the bandwidths is proportional to (mn)−15, the
optimal choice under a conventional criterion, the other bandwidths need to converge to zero with a rate related to (mn)−15. Assumption 3.6 is quite complex in general. However, it holds
in some cases. For example, when we choosep= 2, r = 3, λ= 4, a= 31,k= 1, b1 = (mn)−
1 5,
and b2= (mn)−
2
5+η for some 0< η < 1
5, both (i) and (ii) hold. For instance,
lim inf
(m,n)→∞mnb
2(r−1)a+2(λr−2) (a+2)λ
π = lim inf
(m,n)→∞(mn)
19
55+1211η =∞>0.
and
lim
(m,n)→∞mnb 1+2
r
π = lim
(m,n)→∞(mn)
5
3η =∞.
(iii) Similarly to the non–spatial case (Fan, H¨ardle and Mammen (1998, Remark 10)), we assume that all the nonparametric components are only two times continuously differentiable and thus the optimal bandwidth bk is proportional to (mn)−
1
5. As a result, Assumption 3.6
basically implies p ≤ 4. For our case, the assumption of p ≤ 4 is just sufficient for us to use an additive model to approximate the conditional meanE[Yij|Yi−1,j, Yi,j−1, Yi+1,j, Yi,j+1] by
g1(Yi−1,j) +g2(Yi,j−1) +g3(Yi+1,j) +g4(Yi,j+1) with each gi(·) being an unknown function. In
addition, for our case study in Section 4, we need only to use an additive model of the form g1(Xij(1)) +g2(Xij(2)) to approximate the conditional mean, where Xij(1) = Yi,j−1 +Yi,j+1 and
Xij(2)=Yi−1,j+Yi+1,j. Nevertheless, we may ensure that the marginal integration method still
works for the case ofp≥5 and achieves the optimal rate of convergence by using a high–order kernel of the form
(3.6)
Z
K(x)dx= 1,
Z
xiK(x)dx= 0 for i= 1,· · · , I−1 and Z
xIK(x)6= 0
forI ≥2 as discussed in Hengartner and Sperlich (2003) for the non–spatial case, whereI is the order of smoothness of the nonparametric components. In order to ensure that the conclusions of the main results hold for this case, we need to replace Assumptions 3.4–3.6 by Assumptions 3.4’–3.6’ below:
Assumption3.4’. (i) The functionsg(·) in (1.1) and gl(·) for 1≤l≤p in (1.2) have bounded
(ii) Assumption 3.4(ii) holds.
Assumption3.5’. Assumption 3.5(i) holds. In addition, the kernel function satisfies (3.6).
Assumption3.6’. (i) Assumption 3.6(i) holds. (ii) In addition, for thek−th component
lim sup
(m,n)→∞
mnb2I+1k <∞, lim
(m,n)→∞
max1≤l6=k≤pbl
bk
= 0, lim
(m,n)→∞mnb
4(2+r) 2r−1
k =∞
forλ >2 and some integer r≥3.
After Assumptions 3.4–3.6 are replaced by Assumptions 3.4’–3.6’, we may show that the conclusions of the results remain true. Under Assumptions 3.4’–3.6’, we will need to make changes to several places in the proofs of Lemmas 6.3–6.5 and Theorems 3.1 and 3.2. Apart from replacing Assumptions 3.4–3.6 by Assumptions 3.4’–3.6’ in their conditions, we need to replacePpk=1b2k byPpk=1bIk and µ2(K) =Ru2K(u)duby µI(K) =
R
uIK(u)dufor example in several relevant places.
To verify Assumption 3.6’, we can choose (remember the notational simplification introduced just before Assumption 3.6) the optimal bandwidthbk∼(mn)−
1
2I+1 andb
l ∼(mn)−
2
2I+1+η with
0< η < 2I+11 for all l6=k. In this case, it is not difficult to verify Assumption 3.6’ for the case ofp≥5. As expected, the order of the smoothness I needs to be greater than 2. For example, it is easy to see that Assumption 3.6’ holds for the case ofp= 6 when we choosea= 31, r= 3, λ= 4 and I >4 + 12. For instance, on the one hand, in order to make sure that the condition lim(m,n)→∞max1≤l6=k≤pbl
bk = 0 holds, we need to have 0< η <
1
2I+1. On the other hand, in order
to ensure that
lim inf
(m,n)→∞mnb
2(r−1)a+2(λr−2) (a+2)λ
π = lim inf
(m,n)→∞(mn)
2I−11 2I+1+
60
11η =∞>0
and
lim
(m,n)→∞mnb 1+2r
π = lim
(m,n)→∞(mn)
6I−52
3(2I+1)+253η =∞
both hold, we need to assumeη > 25(2I+1)52−6I . Thus, we can chooseηsuch that 25(2I+1)52−6I < η < 2I+11 whenI >4 +12. The last equation of Assumption 3.6’(ii) holds automatically whenI >4 +12. As pointed out by a referee, in general to ensure that Assumption 3.6’ holds, we will need to choose η such that [2(p−1)+1](1+2r)−(2I+1)
(p−1)(1+2r) < η < 1
2I+1, which implies that (I, p, r) does need to
satisfyI > (p−1)r+2p2r .
(iv) Assumptions 3.2(ii), 3.3 and 3.6 together require the existence of E|Yij|10+ǫ
for some small ǫ > 0. This may look like a strong moment condition. However, this is weaker than E|Yij|k < ∞ for k = 1,2,· · · and Ee|Yij| < ∞ corresponding to those used in the non–
spatial case. See for example, Assumption 2.4 of Gao, Tong and Wolff (2002).
We can now state the asymptotic properties of the marginal integration estimators for both the parametric and nonparametric components. Recall thatZ∗
ij =Zij −µZ−Ppl=1Pl,w(Xij(l)),
Yij∗ =Yij −µY −Ppl=1P (0) l,w(X
(l)
ij ) andRij =Zij∗
Yij∗−Zij∗τβ.
Theorem 3.1. Assume that Assumptions 3.1–3.6 hold. Then under (3.1),
(3.7) √mnh( ˆβ−β)−µβ
i
→D N(0,Σβ)
with
µβ = BZZ− 1
µB, Σβ = BZZ− 1
ΣB
BZZ−1τ,
where BZZ =EZ11∗ Z11∗ τ, µB =E[Rij]and ΣB =P∞i=−∞
P∞
j=−∞E[(R00−µB)(Rij−µB)τ]. Furthermore, when (1.2) holds, we have
µβ = 0, Σβ = BZZ− 1
ΣB
BZZ−1τ,
where ΣB = P∞i=−∞
P∞
j=−∞E
h
R00Rτij
i
with Rij = Zij∗εij, and εij = Yij −m0(Xij, Zij) =
Yij −µ−Zijτβ−g(Xij).
Remark 3.2. Note that
p
X
l=1
Pl,w(0)(Xij(l))−βτ
p
X
l=1
Pl,wZ (Xij(l)) =
p
X
l=1
Pl,w(0)(Xij(l))−βτPl,wZ (Xij(l))
=
p
X
l=1
Pl,w(Xij(l), β)≡ga(Xij, β).
ThereforeYij∗−Zij∗τβ =εij+g(Xij)−ga(Xij, β), whereg(Xij)−ga(Xij, β) is the residual due to
the additive approximation. When (1.2) holds, it means thatg(Xij) in (1.1) has the expression
g(Xij) = Ppl=1gl(Xij(l)) =
Pp
l=1Pl,w(Xij(l), β) = ga(Xij, β) and H(Xij) =
Pp
l=1Pl,wZ (X (l) ij ), and
henceYij∗−Zij∗τβ=εij. As β minimizes L(β) =E[Yij −m0(Xij, Zij)]2, we haveL′(β) = 0 and
therefore EhǫijZij∗
i
=E[ǫij(Zij −E[Zij|Xij])] = 0 when (1.2) holds. This impliesE[Rij] = 0
and hence µβ = 0 in (3.7) when the marginal integration estimation procedure is employed for
the additive form ofg(·).
In both theory and practice, we need to test whetherH0 : β=β0 holds for a givenβ0. The
some notation. Let
b
BZZ = 1 mn
m
X
i=1 n
X
j=1
b
Zij∗(Zbij∗)τ, Zbij∗ = ˜Zij − p
X
l=1
ˆ
Pl,wZ (Xij(l)),
ˆ µB =
1 mn
m
X
i=1 n
X
j=1
b
Rij, Rbij =Zbij∗
ˆ
Yij∗−Zbij∗τβˆ,
ˆ µβ =
b
BZZ−1µˆB, Σˆβ =
b
BZZ−1ΣˆB
b
BZZ−1
τ
,
in which ˆΣB is a consistent estimator of ΣB, defined simply by
ˆ ΣB =
Mm
X
i=−Mm
Nn
X
j=−Nn ˆ
γij, γˆij =
1 mn
Pm−i u=1
Pn−j
v=1(Rbuv−µˆB)(Rbu+i,v+j−µˆB)τ if (1.1) holds, 1
mn
Pm−i u=1
Pn−j
v=1RbuvRbu+i,v+jτ if (1.2) holds,
where Mm → ∞, Nn → ∞, Mm/m → 0, and Nn/n → 0 as m → ∞ and n → ∞. It can be
shown that both ˆµβ and ˆΣβ are consistent estimators ofµβ and Σβ respectively.
We are now in the position to state a corollary of Theorem 3.1 that can be used to test hypotheses aboutβ.
Corollary 3.1. Assume that the conditions of Theorem 3.1 hold. Then under (3.1),
(3.8) Σˆ−β1/2√mnh( ˆβ−β)−µˆβ
i
→D N(0, Iq)
and
(3.9) mnh( ˆβ−β)−µbβ
iτ
b
Σ−β1h( ˆβ−β)−bµβ
i
→D χ2q.
Furthermore, when (1.2) holds, we have under (3.1),
(3.10) Σb−β1/2√mnβˆ−β→D N(0, Iq)
and
(3.11) √mn( ˆβ−β)τΣbβ−1√mn( ˆβ−β)→D χ2q.
The proof of Theorem 3.1 is relegated to the Appendix while the proof of Corollary 3.1 is straightforward and therefore omitted.
Remark 3.3. Theorem 3.1 implies that there is a big difference between the asymptotic variances in the spatial case and in the time series case. The difference is mainly due to the fact that the time series is unilateral while the spatial process is not. Let us consider the simplest case of a line process with p = q = 1. In the corresponding time series case where Yt = βYt−1 +g(Yt−2) +et, et is usually assumed to be independent of the past information
{Ys, s < t}; then with Zt = Yt−1 and Xt = Yt−2, εt = Yt−E(Yt|Xt, Zt) = et, therefore
fort6= 0 which leads to ΣB =E[R20]. However, in the bilateral case on the line with the index
taking values in Z1 where Yt=βYt−1+g(Yt+1) +et,etcan not be assumed to be independent
of (Yt−1, Yt+1) even when et itself is an i.i.d. normal process and g is linear, since under
some suitable conditions, as shown in Whittle (1954), the linear stationary solution may be of the form Yt = P∞j=−∞ajet−j with all aj non-zero. Then with Zt = Yt−1 and Xt = Yt+1,
εt=Yt−E(Yt|Xt, Zt)6=et, and usually E[R0Rt]6= 0 fort= 0 which leads to Σ6 B 6=E[R20].
Next we state the result for the nonparametric component.
Theorem 3.2. Assume that Assumptions 3.1–3.6 hold. Then under (3.1), for xk∈[−Lk, Lk],
(3.12) pmnbk(Pbbk,w(xk)−Pk,w(xk)−bias1k)→D N(0,var1k),
where
bias1k=
1 2b
2
k µ2(K)
Z
w(−k)(x(−k))f(−k)(x(−k))∂
2g(x, β)
∂x2 k
dx(−k)
and
var1k =J
Z
V(x, β)[w(−k)(x
(−k))f
(−k)(x(−k))]2
f(x) dx
(−k),
with g(x, β) =E Yij−µ−Zijτβ
|Xij=x
, V(x, β) =Eh Yij−µ−Zijτβ−g(x, β)
2
|Xij =x
i
, J = R
K2(u)duand µ2(K) =
R
u2K(u)du.
Furthermore, assume that the additive form (1.2) holds and thatEhw(−k)(Xij(−k))i= 1. Then under (3.1),
(3.13) pmnbk(ˆgk(xk)−gk(xk)−bias2k)→D N(0,var2k),
where
bias2k =
1 2b
2
k µ2(K)∂ 2g
k(xk)
∂x2 k
and var2k=J
Z
V(x, β)[w(−k)(x
(−k))f
(−k)(x(−k))]2
f(x) dx
(−k)
withV(x, β) =EYij −µ−Zijτβ−
Pp
k=1gk(xk)
2
|Xij =x
.
The proof of Theorem 3.2 is relegated to the Appendix.
Finally, we state the corresponding results of Theorems 3.1 and 3.2 under Assumptions 3.1–3.3 and 3.4’–3.6’ in Theorem 3.3 below. Its proof is omitted.
Theorem 3.3. (i) Assume that Assumptions 3.1–3.3 and 3.4’–3.6’ hold. Then under (3.1), the
conclusions of Theorem 3.1 hold.
(ii) Assume that Assumptions 3.1–3.3 and 3.4’–3.6’ hold. Then under (3.1), for xk ∈
[−Lk, Lk],
where
bias1k(I) =
1 2b
I
k µI(K)
Z
w(−k)(x(−k))f(−k)(x(−k))
∂Ig(x, β) ∂xIk dx
(−k)
and
var1k(I) =J
Z
V(x, β)[w(−k)(x
(−k))f
(−k)(x(−k))]2
f(x) dx
(−k)
with g(x, β) =E Yij−µ−Zijτβ
|Xij=x, V(x, β) =E
h
Yij−µ−Zijτβ−g(x, β)
2
|Xij =x
i
, J = R
K2(u)duand µI(K) =RuIK(u)du.
Furthermore, assume that the additive form (1.2) holds and thatEhw(−k)(Xij(−k))i= 1. Then under (3.1),
(3.15) pmnbk(ˆgk(xk)−gk(xk)−bias2k(I))→D N(0,var2k(I)),
where bias2k(I) = 12bIk µI(K)∂
Ig k(xk)
∂xI k
and
var2k(I) =J
Z
V(x, β)[w(−k)(x
(−k))f
(−k)(x(−k))]2
f(x) dx
(−k)
withV(x, β) =EYij −µ−Zijτβ−
Pp
k=1gk(xk)
2
|Xij =x
.
4. An illustrative example with simulation
In this section we consider an application to the wheat data set of Mercer and Hall (1911) as an illustration of the theory and methodology established in this paper. This data set has been analyzed by several investigators including Whittle (1954) and Besag (1974); see also McBratney and Webster (1981) on the analysis from the spectral perspective. It involves 500 wheat plots, each 11 ft by 10.82 ft., arranged in a 20×25 rectangle, plot totals constituting the observations. Two measurements, grain yield and straw yield, were made on each plot. Whittle (1954) analyzed the grain yields, fitting various stationary unconditional normal autoregressions. Besag (1974) analyzed the same data set but on the basis of the homogenous first– and second– order auto–normal schemes (see (5.5) and (5.6) in Besag (1974, page 206)), and found that the first–order auto-normal scheme appears satisfactory (Besag, 1974, p. 221). This model has the conditional mean of Yij, given all other site values equal to
(4.1) γ0+γ1(Yi−1,j+Yi+1,j) +γ2(Yi,j−1+Yi,j+1),
where we use Yij to denote the grain yield, and γ0, γ1 and γ2 are unknown parameters. For
As a first step, we are concerned with whether or not the first–order scheme is linear as in (4.1) or possibly partially linear as in (1.2). This suggests considering the following additive first–order scheme:
(4.2) µ+g1(Xij(1)) +g2(Xij(2)),
whereXij(1) =Yi−1,j+Yi+1,j,Xij(2)=Yi,j−1+Yi,j+1,µ is an unknown parameter, andg1(·) and
g2(·) are two unknown functions onR1. If the Besag scheme is correct, both (1.1) and (1.2) hold
and are linear, and one can model (4.2) as a special case of model (1.2) withβ= 0.
Next, we apply the approach established in this paper to estimateg1 andg2. In doing so, the
two bandwidths,b1= 0.6 andb2= 0.7 were selected using a cross–validation selection procedure
for the case ofp= 2. The resulting estimated functions ofg1(·) andg2(·) are depicted in Figure
1(a) and (b) with solid lines, respectively, where the additive modelling, based on the modified backfitting algorithm proposed by Mammen et al (1999) in iid case and developed by Lu, et al (2005) for the spatial process, is also plotted with dotted lines. We need to point out that in an asymptotic analysis of such a two–dimensional model, two bandwidths tending to zero at different rates have to be used for each component, thus we will need to use four bandwidths altogether. But in a finite sample situation like ours, we think that it may be better to relay on cross–validation. This technique is certainly used in the non–spatial situation too, even in cases where an optimal asymptotic formula exists.
The pictures of the additive first-order scheme indicate that the estimated function of g1(·)
appears to be linear as in Besag (1974), while the estimated function of g2(·) seems to be
nonlinear. This suggests using a partially linear spatial autoregression of the form
(4.3) β0+β1Xij(1)+g2(Xij(2)).
For this case, one can also view model (4.3) as a special case of model (1.2) withµ=β0,β =β1,
Zij =Xij(1),Xij =Xij(2) and g(·) =g2(·). The estimates of β0, β1 and g2(·) were calculated and
the bandwidth of 0.4 was selected using a cross–validation selection procedure resulting in the estimates ˆβ0 = 1.311, ˆβ1 = 0.335 and ˆg2(·), which are also plotted in Figure 1(a) and (b) with
dashed lines, respectively.
We find that our estimate of β1 based on the partially linear first-order scheme is almost
the same as Besag’s first-order auto–normal schemes, which are tabulated in Table 1 below. The estimate ofg2(·) based on the partially linear first–order scheme, similarly to that given in
Figure 1. Estimated functions of semi-parametric first-order schemes: (a)g1(x),
(b) g2(x). Here the solid and the dotted lines are for the estimates of additive
Figure 2. Boxplots of the estimated partial linear first-order scheme for the 100 simulations of the auto-normal first-order model for the nonparametric compon-entg2(x). The sample size is m= 20and n= 25.
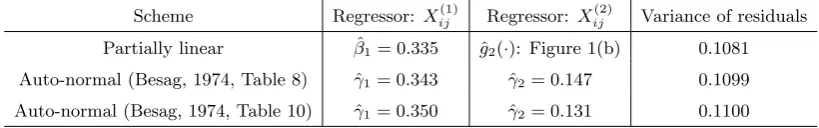
Table 1. Estimates of different first-order conditional autoregression schemes for Mercer and Hall’s data
Scheme Regressor: Xij(1) Regressor: Xij(2) Variance of residuals Partially linear βˆ1= 0.335 gˆ2(·): Figure 1(b) 0.1081
Auto-normal (Besag, 1974, Table 8) γˆ1= 0.343 ˆγ2= 0.147 0.1099
Auto-normal (Besag, 1974, Table 10) γˆ1= 0.350 ˆγ2= 0.131 0.1100
One may wonder whether the apparent nonlinearity ing2 could arise from random variation
even ifg2 is linear. The similarity of the two estimates using different techniques is reassuring,
but we also did some simulations with samples from the auto-normal first-order scheme of conditional mean of (4.1) with γ0 = 0.16, γ1 = 0.34, γ2 = 0.14, and of constant conditional
Figure 3. The estimated kernel density of Xij(2) defined in (4.3) for the grain yields data.
with the bandwidth of 0.4 (the same as that used for the grain yields data in the above). The boxplots of the 100 simulations for the nonparametric componentg2(·) are depicted in Figure 2.
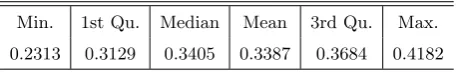
[image:23.595.171.400.513.549.2]A six–number summary for ˆβ1 is given in Table 2 below.
Table 2. A six–number summary forβˆ1
Min. 1st Qu. Median Mean 3rd Qu. Max.
0.2313 0.3129 0.3405 0.3387 0.3684 0.4182
It is clear that the estimate for β1 is quite stable with median almost equal to the actual
parameter ˆβ1 = 0.34, and the estimate for g2 also looks quite linear with small errors around
x = 7.8. The simulation results show that it is unlikely that the estimated nonlinearity in g2
for the grain yields data in Figure 1(b) should be caused by random variations with the true model being linear. In fact, the accuracy of our estimates is quite high around x = 7.8, since the samples of the grain yields are quite dense there (see Figure 3).
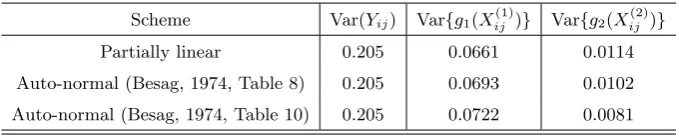
small in view of the rather pronounced nonlinearity of Figure 1. In an attempt to understand this, we also calculated the variances of the estimated components and the variance of Yij
over {(i, j) : 2 ≤ i ≤ 19,2 ≤ j ≤ 24}, reported in Table 3. By combining Table 3 with Table 1, we can see that: (a) clearly, for the partially linear first-order scheme as well as Besag’s auto-normal schemes, the variances of the residuals (in Table 1) are quite large, all about half of the variance of Yij (given in Table 3); (b) the variances of the first component,
Var{g1(Xij(1))}, are much larger (6 times) than those of the second component, Var{g2(Xij(2))},
and therefore the first components in the fitted conditional means play a key role while the impact of the second components is smaller; and (c) if we are only concerned with the estimate of the second componentg2, then the improvement of the partially linear first-order scheme over
[image:24.595.115.455.463.531.2]the auto-normal schemes is clear if measured in terms of the relative increase of the variance: (0.0114−0.0102)/0.0102×100% = 11.76% and (0.0114−0.0081)/0.0081×100% = 40.74% (c.f. Table 3). These facts serve at least as tentative explanations of the slightly contradictory messages of Figure 1 and Table 1. The partially linear scheme does provide an alternative choice of fitting and conveys more information on the data. A referee suggests that the apparent nonlinearity may be due to a inhomogeneity in the data (cf. McBratney and Webster 1981). This is a possibility that cannot be ruled out. Also for time series it is sometimes difficult to distinguish between nonlinearity and nonstationarity.
Table 3. Variances of components of different first–order conditional autoregression schemes for Mercer and Hall’s data
Scheme Var(Yij) Var{g1(Xij(1))} Var{g2(Xij(2))} Partially linear 0.205 0.0661 0.0114
Auto-normal (Besag, 1974, Table 8) 0.205 0.0693 0.0102
Auto-normal (Besag, 1974, Table 10) 0.205 0.0722 0.0081
5. Conclusion and Future Studies
In Section 4, our empirical studies show that the estimated form of g2(·) is nonlinear. To
further support such nonlinearity, one may need to establish a formal test. In general, we may consider testing for linearity in the nonparametric componentsgl(·) involved in model (1.2).
In the time series case, such test procedures for linearity have been studied extensively during the last ten years. Details may be found from Gao and King (2005). In the spatial case, Lu,
et al (2005) propose a bootstrap test and then discuss its implementation. To the best of our knowledge, there is no asymptotic theory available for such a test, and the theoretical problems are very challenging.
To testH0: gk
Xij(k)=Xij(k)γk, where{γk}is an unknown parameter for each givenk. Our
experience with the non–spatial case suggests using a kernel based test statistic of the form
Lk= m
X
i1=1
n
X
j1=1
m
X
i2=1,6=i1
n
X
j2=1,6=j1
Ki1j1(Xi2j2, b)ˆǫ
(k) i1j1ˆǫ
(k) i2j2,
where Ki1j1(Xi2j2, b) =
Qp l=1K
Xi(l)
1j1−X (l)
i2j2
bl
as defined at the beginning of Section 2, and
ˆ
ǫij(k)=Yij−µˆ−Zijτβˆ−Xij(k)γˆk−Pl=1,6=kˆgl(Xij(l)), in which ˆµ, ˆβ, ˆγkand ˆgl(·) are the corresponding
estimators of µ,β,γk and gl(·). These estimators may be defined similarly as in Section 2.
Our experience and knowledge with the non–spatial case would suggest that the normalized version of Lk should have an asymptotically normal distribution under H0, although we have
not been able to rigorously prove such a result. This issue and other related issues, e.g. a test for isotropy, are left for future research.
6. Appendix: Proofs of Theorems 3.1 and 3.2
Throughout the rest of the paper, the letterC is used to denote constants whose values are unimportant and may vary from line to line. All limits are taken as (m, n) → ∞ in sense of (3.1) unless stated otherwise.
6.1. Technical lemmas. In the proofs, we need to repeatedly use the following cross term inequality and uniform-consistency lemmas.
Letf(−k)(·) and f(·) be the probability density functions ofXij(−k) and Xij, respectively. For
k= 1,2,· · ·, pand s= 1,2,· · · , q, let
dijk(xk) =f(Xij(−k), xk)−1 w(Xij(−k)) f(−k)(Xij(−k)),
ǫ(s)ij =Zij(s)−EhZij(s)|Xij
i
, ∆ij(xk) =K
Xij(k)−xk
bk
!
Lemma 6.1. (i) Assume that Assumptions 3.1–3.6 hold. Then under (3.1)
1
√
mnbk m
X
i=1 n
X
j=1
∆ij(xk)→D N(0,var(s)1k),
where
var(s)1k =J
Z
V(s)(x)[w(−k)(x
(−k))f
(−k)(x(−k))]2
f(x) dx
(−k),
in which J = RK2(u) du, V(s)(x) = E((Zij(s) −µ(s)Z −H(s)(x))2|Xij = x), and x(−k) is the
(p−1)-dimensional vector obtained from x with the k-th component, xk, deleted.
(ii) Assume that Assumptions 3.1–3.6 hold. For any (m, n) ∈ Z2, define two sequences of positive integersc1=c1mn and c2=c2mn such that 1< c1 < mand1< c2 < n. For anyxk, let
˜ J(xk) =
m
X
i=1 n
X
j=1
i′6=i m
X
i′=1
orj′6=j n
X
j′=1
E∆ij(xk)∆i′j′(xk),
(6.1)
˜
J1 =c1c2mnb
λr−2
λr+2+1
k , J˜2 =Cmnb
2
λr
k
√ m2+n2
X
i=min(c1,c2)
iϕ(i)λrλr−2
, (6.2)
where C >0 is a positive constant and λ >2 and r ≥1 are as defined in Assumptions 3.1 and 3.2(ii). Then for any xk
(6.3) J˜(xk)
≤ChJ˜1+ ˜J2
i
.
Proof. The proof of (i) follows similarly from that of Lemma 3.1 of Hallin, Lu and Tran (HLT) (2004b) while the proof of (ii) is analogous to that of Lemma 5.2 of HLT (2004b). When applying the Lemma 3.1, one needs to notice that E[ǫ(s)ij ] = 0 andN = 2. For the application of the Lemma 5.2, we need to take δ=λr−2,d= 1 and N = 2 in the lemma.
Lemma 6.2. (The Moment Inequality) Let(i, j)∈Z2 andξij =K((Xij(1)−x1)/b1,· · ·,(Xij(p)−
xp)/bp)θij, where K(·) satisfies Assumption 3.5 and θij =θ(Xij, Yij), in which θ(·,·) is a meas-urable function, satisfy E[ξij] = 0 andE|θij|λr<∞ for a positive integer r and some λ >2. In addition, assume that Assumptions 3.1–3.6 hold. Then there exists a constant C depending onr but depending on neither the distribution of ξij nor bπ and (m, n) such that
(6.4) E
m
X
i=1 n
X
j=1
ξij
2r
≤C(mnbπ)r
holds for allp sets of bandwidths.
Lemma 6.3. Let {Yij, Xij} be a R1 ×Rp-valued stationary spatial process with the mixing coefficient function ϕ(·) as defined in (3.3). Set θij =θ(Xij, Yij). Assume that E|θij|λr < ∞ for some positive integer r and some λ > 2. Denote by R(x) = E(θij|Xij = x). Assume that Assumptions 3.1–3.6 hold, and that R(x) and f(x) are both twice differentiable with bounded second order derivatives on Rp. Then
sup x∈SW
˛ ˛ ˛ ˛ ˛
(mnbπ)−1
m X i=1 n X j=1 θij p Y l=1
K“(Xij(l)−xl)/bl
”
−f(x)R(x)
˛ ˛ ˛ ˛ ˛ (6.5)
=OP (mnb1+2π /r)−r/(p+2r)+ p
X
k=1
b2k
!
.
holds for allp sets of bandwidths.
Proof. Set
Σij(x, b)≡θij p
Y
l=1
K“(Xij(l)−xl)/bl
” −E " θij p Y l=1
K“(Xij(l)−xl)/bl
” #
,
Am,n(x) = (mnbπ)−1 m X i=1 n X j=1
Σij(x, b),
and
˜
Am,n(x)≡Eθij p
Y
l=1
K“(Xij(l)−xl)/bl
”
−f(x)R(x).
Then this lemma follows if we can prove
(6.6) sup
x∈SW
|Am,n(x)|=OP
mnb1+2/rπ −r/(p+2r)
, sup
x∈SW
A˜m,n(x)
=O p X k=1
b2k
!
.
Here the second part of (6.6) can be proved easily by using the compactness of the setSW and
the support of K together with the property of bounded second order derivatives of R(x) and f(x). Therefore, only the first part of (6.6) needs to be proved in the following.
First, we cover the compact setSW ⊂Rp by a finite number of open balls Bi1,···,ip centered atx(i1,· · · , ip)∈Rp, with itsl-th component denoted byxl(i1,· · ·, ip), that is
SW ⊂ ∪1≤il≤jl l=1,···,p
Bi1,···,ip
in such a way that for eachx= (x1,· · · , xp)τ ∈Bi1,···,ip,
kxl−xl(i1,· · ·, ip)k ≤γlmn≡γl, l= 1,· · · , p,
wherejl≤Cγ−l 1 andγlwill be specified later. Denote bySW′ the finite set of all the center point
x(i1,· · · , ip) of such balls, and for simplicity, write xl(i1,· · · , ip) ≡ x′l and x(i1,· · ·, ip) ≡ x′.
Note that
p
Y
i=1
ai− p
Y
i=1
a′i= p X l=1 0 @ Y
i6=l
a′i
1
A(al−a′l) + p
X
l1=1
p
X
l2=1 l26=l1
0
B B @
Y
i6=lj j=1,2
a′i
1
C C A
(al1−a
′
l1)(al2−a
′
+· · ·+ p
X
l1=1,···lp−1=1 lj’s different
0
B B @
Y
i6=lj j=1,···,p−1
a′i
1
C C A
(al1−a
′
l1)· · ·(alp−1−a
′
lp−1).
Takea′ l=K
(Xij(l)−x′ l)/bl
and similarly foralwithxlinstead ofx′l. Then using Assumption
3.5 shows that|al−a′l| ≤C|xl−x′l|/bℓ ≤Cγl/blandb−π1E|θij| Q i6=lj
j=1,···,l∗
a′ i
!
=O((bl1· · ·bll∗)−1)
forl∗ = 1,· · · , p−1. Therefore,
(6.7) Amn1= sup
x∈SW
|Am,n(x)−Am,n(x′)| ≤(mnbπ)−1 sup x∈SW
m X i=1 n X j=1
|Σij(x, b)−∆ij(x′, b)|
≤(mnbπ)−1 sup x∈SW
m X i=1 n X j=1 "
|θij|
˛ ˛ ˛ ˛ ˛ p Y l=1
al− p
Y
l=1
a′l
˛ ˛ ˛ ˛ ˛
+E|θij|
˛ ˛ ˛ ˛ ˛ p Y l=1
al− p
Y
l=1
a′l
˛ ˛ ˛ ˛ ˛ #
≤OP(1)
2 6 6 6 4 p X l=1 γl b2 l + p X
l1=1 p
X
l2=1 l26=l1
γl1γl2 (bl1bl2)2
+· · ·+ p
X
l1=1,···,lp−1=1
lj’s different
γl1· · ·γlp−1 (bl1· · ·blp−1)2
3
7 7 7 5
≤OP(1)
" p X l=1 γl b2 l + p X l=1 γl b2 l !2 +· · ·+ p X l=1 γl b2 l
!p−1#
=OP(αmn),
where γl=b2lαmn was taken in the last equality with αmn to be specified later.
SetAmn2 ≡supx′∈S′
W |Am,n(x
′)|. Then it follows that
(6.8) sup
x∈SW
|Am,n(x)| ≤ sup x∈SW
|Am,n(x)−Am,n(x′)|+ sup x′∈S′
W
|Am,n(x′)|=Amn1+Amn2.
Note that for anyx′ ∈SW′ , it follows from the moment inequality that
(6.9) P |Am,n(x′)|> ε
≤ε−2rE|Amn(x′)|2r≤ε−2rC(mnbπ)−r.
LetNW be the number of elements in SW′ . Then, in view of NW ≤Cλ1· · ·λp and (6.9),
P(|Amn2|> ε) =P sup x′∈S′
W
|Am,n(x′)|> ε
!
≤ X
x′∈S′
W
P |Amn(x′)|> ε
(6.10)
≤Cλ1· · ·λpε−2r(mnbπ)−r≤C(γ1· · ·γp)−1ε−2r(mnbπ)−r
=Cε−2r(b21αmn· · ·b2pαmn)−1(mnbπ)−r=Cε−2r(b2παmnp )−1(mnbπ)−r.
Thus it follows from (6.10) that
(6.11) Amn2 =OP
b−π1/rα−mnp/(2r)(mnbπ)−1/2
We now specify γl by taking αmn =
b−π1/r(mnbπ)−1/2
2r/(2r+p)
. Then it is clear from (6.8) together with (6.7) and (6.11) that
(6.12) sup
x∈SW
|Am,n(x)|=OP
b2/rπ mnbπ
−r/(2r+p)
,
so (6.6) holds and the proof is completed.
Lemma 6.4. LetUm,n be as defined in (2.4). Suppose that Assumptions 3.1, 3.2 and 3.4 hold.
In addition, ifbπ →0 and mnbπ → ∞, then uniformly overx∈SW
(6.13) Um,n→pU ≡f(x)
1 0
τ
0 µ2(K)Ip
,
where0 = (0,· · ·,0)τ ∈Rp, µ
2(K) =R u2K(u)du, Ip is an identity matrix of order p, and →P
denotes the convergence in probability.
Proof. By (2.1), for 1≤k, l≤p,
um,n,kl =um,n,kl(x) = (mnbπ)−1 m
X
i=1 n
X
j=1
Xij(k)−xk)/bk Xij(l)−xl)/bl
Yp
s=1
K X
(s) ij −xs
bs
!
,
it suffices to show that as (m, n)→ ∞,
um,n,kl(x)→p
0 ifk6=l
f(x)Ru2K(u)du ifk=l6= 0
and
um,n,k0(x)→p 0, um,n,0l(x)→p 0, um,n,00(x)−f(x)→p 0
uniformly inx∈SW. But this follows from Lemma 6.3.
6.2. Proofs of Theorems. To prove our main theorems, we will often use the property of the marginal integration estimator, which is to be established here and of independent interest in some other applications.
LetH(s)(x) =E[(Z(s)−µ(s)Z )|X =x] be the conditional regression ofZij(s)−µ(s)Z givenXij =x,
Pk,w(s)(xk) =E
h
H(s)(Xij(−k), xk)w(−k)(Xij(−k))
i
the weighted marginal integration of H(s)(x), and
Ha(s)(x) =Ppk=1Pk,w(s)(xk) the additive approximation ofH(s)(x) based on marginal integrations,
fors= 0,1,· · · , q. The estimates of those functionals were given in Section 2. Let W(x) and SW be as defined in Lemma 6.3. The following lemma is necessary for the proof of the main
Lemma 6.5. Assume that Assumptions 3.1–3.5 hold and that the bandwidths satisfy mnb5k = O(1),Ppl=1,l6=kb2
l =o(b2k). Then under (3.1),
(6.14) pmnbk( ˆPk,w(s)(xk)−Pk,w(s)(xk)−bias(1sk))→DN(0,var(1sk)),
where
bias(1sk)=1 2b
2
kµ2(K)
Z
w(−k)(x(
−k))f (−k)(x(
−k))∂2H(s)(x)
∂x2
k
dx(−k),
var(1sk)=J
Z
V(s)(x)[w(−k)(x
(−k))f
(−k)(x(−k))]2
f(x) dx
(−k),
in whichµ2(K) =Ru2K(u)du, and the other quantities are as defined in Lemma 6.1.
Let Hk(s)(xk) = E
h
Zij(s)−µ(s)Z |Xij(k)=xk
i
. Furthermore, if H(s)(x) = Pk=1p Hk(s)(xk) and
Ehw(−k)(Xij(−k))
i
= 1, then under (3.1),
(6.15) pmnbk( ˆPk,w(s)(xk)−Hk(s)(xk)−bias(2sk))→DN(0,var(2sk)),
where
bias(2sk)=1 2b
2
k µ2(K)
∂2H(s)
k (xk)
∂x2
k
and var(2sk)=J
Z
V(s)(x)[w(−k)(x
(−k))f
(−k)(x(−k))]2
f(x) dx
(−k),
whereV(s)(x) =E
» “
Zij(s)−µ(Zs)−Pp k=1H
(s)
k (xk)
”2
|Xij=x
–
.
Proof. By the law of large numbers, it is obvious that forxk∈[−Lk, Lk]
(6.16) P˜k,w(s)(xk) = (mn)−1 m
X
i=1 n
X
j=1
H(s)(Xij(−k), xk)w(−k)(Xij(−k)) =P (s)
k,w(xk) +OP
1
√mn
.
Throughout the rest of the proof, set γ = (1,0,· · ·,0)τ ∈R1+p. Note that, by the notation and definitions in Section 2,
Hm,n(s) (Xij(−k), xk)−H(s)(Xij(−k), xk)γτUm,n−1 (Xij(−k), xk)Vm,n(s)(Xij(−k), xk)−H(s)(Xij(−k), xk)
(6.17)
=γτUm,n−1 (Xij(−k), xk)
Vm,n(s)(Xij(−k), xk)−Um,n(Xij(−k), xk)
H
(s)(X(−k) ij , xk)
DH(s)(Xij(−k), xk)⊙b
τ
≡γτUm,n−1 (Xij(−k), xk)Bm,n(Xij(−k), xk),
whereDH(s)(x) = (∂H(s)(x)/∂x1,· · · , ∂H(s)(x)/∂xp) with x = (x(−k), xk), the symbol ⊙ is as
defined in (2.5), and (6.18)
Bm,n(x) =
v
(s)
m,n,0(x)−um,n,00(x)H(s)(x)−Um,n,01(x) DH(s)(x)⊙b
τ
Vm,n,1(s) (x)−Um,n,10(x)H(s)(x)−Um,n,11(x) DH(s)(x)⊙b
τ
≡
Bm,n,0(x)
Bm,n,1(x)